Download
1 / 76
760 likes | 893 Vues
Full text and graphics version. Jim Blaze, Zeta-Tech Associates 900 Kings Highway N. in Cherry Hill, New Jersey, USA, 08034 blaze@zetatech.com. Global Economic Railroad Trends & Efficiencies. “You become a trend maker”. March 22, 2007. Here are my themes

E N D
Full text and graphics version Jim Blaze, Zeta-Tech Associates 900 Kings Highway N. in Cherry Hill, New Jersey, USA, 08034 blaze@zetatech.com Global Economic Railroad Trends & Efficiencies “You become a trend maker” March 22, 2007
Here are my themes Finding the Critical Trends in the data “noise” Efficiency “metrics that matter” Global Benchmarking to become the best Becoming a “Trend Maker” Your Challenge after this conference Please allow me to introduce background data about which my fellow speakers will address in turn with more details
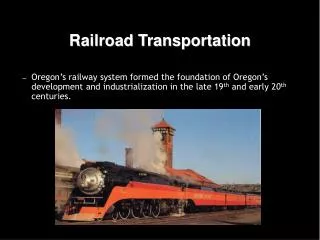
R I am a railway man and this was my company CONRAIL Seattle CONRAIL Montreal Chicago San Francisco New York St. Louis Los Angeles Graphic tricks make It look bigger than it it Major Joint Service Routes Blaze@zetatech.com 2004
Containerization Giant TEU ocean ships High efficiency diesel-electric locomotives Doublestack rail wagons Heavy rail car axle load limits Very long & heavy train sets What technical innovations were implemented in the past two to three decades? We will cover some of these briefly in the coming slides
Hard to see the long supply chain pattern in the fog without evidence We will use facts. patterns and “numbers” from data to illuminate the track ahead
Did you ever have to make up your mind… …to choose one path and leave the other behind? You will have to make choices as to how to serve the supply chains
Implementation pace of technical improvements Changes to meet market competition Changes in market “elasticity of demand” Let us focus first on Strategic Examples of Rail Freight Supply Chain Measurements
Implementation pace of technical improvements More than 50% of breakthrough improvements come from adoption of technology Each generation of managers gets one such opportunity 2 chances if you are really lucky
Implementation pace of technical improvements Winners often take advantage of someone else’s idea …and implement “it” faster and better Can you and will you do this
Just as in boxing or soccer the railway market share prize will go to the best “competitor” • The railway freight prize will be • Market Share • Profitability • Recovery of asset costs Indian team members celebrate 1983 Prudential World Cup
2) Market Competition along Global Supply Chains Identify thy enemy Learn his weakness Use your strengths Density and Fuel Efficiency are your rail advantages • Improve your “economies of scale” and • Beat the truck with lower costs per unit
You need to react swiftly to market actions by competitors Take only 6-hours for publishing a new rail price quote You cannot wait around for 13 months and convinced customers that you are their preferred global freight leader 2) Market Competition along Global Supply Chains You “snooze” -- you lose
3) “Elasticity of demand” in key marrkets… What is your elasticity in key corridors? East China to Rotterdam example This is the competitor 11,000 TEU’s What happens to rail demand when the rail price is raised in the face of such vessels? Will you retain or lose market share?
13/02/2007NEW PROPOSAL for container train running CHINA - Kazakhstan – Russia – Ukraine to Western Europe Russia and Ukraine approved the tariff agreement for the transportation by container train using 40 foot containers The rates are as follows: Kazakhstan $ 847 Russia $ 1,104 Ukraine $ 274 TOTAL $ 2,225 PLUS added costs to reach German markets STRATEGIC QUESTIONCan overland rail compete with an 11,000 TEU Ocean Service? HOW MUCH RAIL SHARE AT THESE PRICES?
You may be faster then the Suez route But the few days saved is worth maybe $200 per box in on-time inventory But if you take prices up and demand drops, your demand influence on the market is inelastic 3) Elasticity of Demand You take price up and you will lose market share and traffic Because ships like this… …are the market price leaders
History shows us how Eurasian railways can beat the Ships and the Suez Corridor Both time …and price charged per box will matter How close to $1,200 plus can you get
1983 – Here is what the train had to beat Launched for APL in 1973 One of four all-container ship design 17 Years after the first Sealand Container ship The 3rd “President Jefferson” APL ship Competing with the first double stack train 1,508 TEU’s 90 ft beam Competition Corridor was “The Panama Canal” route to US East Coast
My friend Ted Krohn will demonstrate what single action allowed US rails to take a 70% plus market share away from the ships and the trucks TECHNOLOGY WAS THE KEY TO THIS SUPPLY CHAIN CHANGE • By decreasing the rail costs incurred per container by up to 45% • Allowing rail PRICE charged per container to drop by about one half to two-thirds third from this single railway action
This was the technology that did it 23 years ago in 1984
Because the 1984 Stack Train proved Successfulgiant ships became economical C-10 C-6 APL built ship’s not capable of the Panama Canal passage The C-10 Class “Truman” was delivered in April 1988 4,300 TEU’s 129 ft and 3-inch beam
Besides APL who are among the best logistics providers? Who organizes these Supply Chain today? Among the best is UPS This analysis is called “benchmarking”
UPS even manages which railway company will distribute many of the finished automobiles by rail wagons UPS decides who is most efficient railway vendor
No longer a trend --- Now the skill to beat Can you do all this with Quality assurance? IF NOT, YOU WILL PROBABLY TAKE ORDERS FROM THOSE THAT CAN
Who has these supply chain skills? Here are a few of the emerging quality “organizers” —ProLogis Bilex PACER “Looks like a trucker, acts like a forwarder”
ORGANIZERNet IncomeProfit Growth UPS $ 6.0 Billion 20% Federal Express $ 2.5 Billion 22% TNT $ 1.3 Billion-11% PACER $ 99 Million 29% UTI Worldwide $ 127 Million 33% C H Robinson WW $ 332 Million 47% “Most leading supply chain organizers are so strong they do not need regulatory protection from railways” TOP SIX in 2006
Let us look closely at just a few North American railway freight trend numbers and see what they broadly tell us Railway trends in the face of supply chain management
Why begin here? Because of their pace of change Because of their wealth of data (metrics) Because they offer a “best of breed” freight benchmark in a global logistics service market A few North America trends Fast Processes Are data rich Strong RESULTS
USA Ton-Mile – All Rail Freight 15 Year Business Increase Up up and up
…rail Ton-Miles in past 7-Years Trend tremendous growth pattern
USA Intermodal Rail 15 Year Business Increase to 12.3 Millions Trailers and Containers in 2006 Two Years with negative growth shown in red columns
10 Year Pattern In Millions of Trailers and Containers per Year Total of 12.3 Mil Units 9.4 mil Containers Cross-over year in 1992 2.9 mil Trailers Trailers versus Containers
These previous unit numbers are not TEU unitsMany of these are the actual number of unitsup to the large 53 –foot long units Equivalent to more than 21 Million TEU’s in 2006
Made possible by doublestacking technology A trucking company is now a leading US rail intermodal player – one of several “truckers”
The “King” At 53-feet 48-foot USA Domestic Box 45-foot Pacific Box “FEU 40-foot Basic Box “TEU 20-foot Basic Box BIG -- BIGGER -- BIGGEST TREND
Cubic feet 3,787 feet 3,427 feet 3,014 feet “FEU 2,372 feet “TEU SEARCH FOR CUBIC CAPACITY 1,149 feet
“FEU Because this TEU box often pays a US rail rate almost equivalent to the 40 or 45 foot rail rate “TEU … the “TEU” is slowing disappearing in the USA market
25% or more of all ocean containers are trans-loaded to larger US boxes on the Pacific Ocean to East Coast Global Corridors NEW SUPPLY CHAIN TREND TRANSLOADING Why? The answer is “Economies of Scale” from cubic capacity of big box doublestacks
Not a decision of regulators or policy planners Since 1999, more than 90% of US double-stack rail cars have been designed with a 53-foot “well” The “well” is the lower container position in a double-stack rail car; The market has voted for the 53-footer
1,850 intermodal rail wagons 28,700 chassis used to transport containers over the highways 28,200 containers This means that for you to become an intermodal player like PACER requires a lots of capital equipment investment 1,000 customers 100 agents 17 offices 700 “contract truckers” 1 Million loads a year Company is worth about $1Billion on the market.
Supply chain is focused on what they can get into their box and not what they can get onto your limited wagon High value cargo needs cubic space
Efficiencies from modern container trains is not possible on most of the world’s railways because of overhead clearance restrictions 20.5 feet in North America on strategic routes Doublestack performance REQUIRES “clearance” investment on key routes
“We need to electrify in order to save fuel costs” say many railroadersWRONG suggests Jim Blaze and ZETA-TECH Associates Inc. Electric wires: big challenge to achieving efficient doublestack corridors for customers
Here are examples of different cost levels and different prices on a Chicago-New York intermodal corridor – per train Marketing tools like ZETA-TECH Intermodal Model and TrackShare help you identify your costs and then help you set competitive prices Out of pocket variable cost $ 30,000 Long run variable costs $ 40,000 Marginal costs on congested routes $ 49,000 Full Costs $ 60,000 Full Costs plus profit margin $ 80,000+ ((Rounded numbers as examples) Do you measure your costs to help set prices in this way?
British Isles Rail Freight Change Metrics 19.4 Billion ton-km in 2002 to 22.1 Billion in 2006 7.5% -4.5% Yes – increasing rail ton-m
The Rail Regulator announced a significant contribution to the Government's objective of achieving an 80% growth in rail freight traffic by 2010 He ruled in favor of “halving” the access charges freight operators pay to Railtrack for use of its network DID IT WORK? UK Regulator reduces freight charges by 50% to win freight to rail April 2001
So far has in fact delivered growth Better volume results than in most of Europe Far better than Africa and South America But at a continuing subsidy cost UK SUCCESS
UK PRODUCTIVITY ISSUES REMAIN • Freights less than 800 meters in length • At best a 25.5 ton axle load versus 30 in Norway • No double stack economies of scale