Download
1 / 64
640 likes | 993 Vues
U.S. Railroad Safety Statistics and Trends. Peter W. French AVP- Safety & Performance Analysis Association of American Railroads January 17, 2006. Railroad Safety: Topics. Safety Statistics & Trends Train Safety (Train Accidents) Grade Crossing Safety Trespassers Passenger Safety

E N D
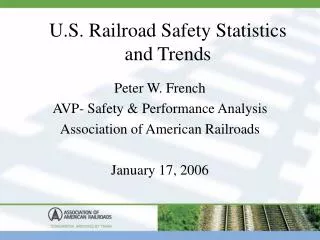
U.S. Railroad Safety Statistics and Trends Peter W. French AVP- Safety & Performance Analysis Association of American Railroads January 17, 2006
Railroad Safety: Topics • Safety Statistics & Trends • Train Safety (Train Accidents) • Grade Crossing Safety • Trespassers • Passenger Safety • Employee Safety • Hazardous Materials Safety
Railroad Safety: Topics (continued) • RR Initiatives to Improve Safety • Improvements in Technology • Safety Programs • Risk-Based Safety Performance Standards
U.S. Railroad Safety Statistics:Main Themes • Railroads have dramatically improved safety over the last two and a half decades. • Railroads compare favorably with other industries & transportation modes. • The most troubling railroad safety problems arise from factors largely outside railroad control. • Railroads have implemented numerous and effective technological improvements and company-wide safety programs.
U.S. Railroad Safety Statistics: In 2004, U.S. railroads achieved their safest year ever for the following measures: • Total Non-Fatal Injuries • Employee On-Duty Injuries & Injury Rates • Grade Crossing Collision Rates • Trespasser Fatalities and Injuries per Million Train Miles Sources of Data: FRA website: http://safetydata.fra.dot.gov/Prelim/2004/r01.htm (preliminary 2004 data) FRA, Railroad Safety Statistics Annual Report, 1997-2004, Tables 1-1, 1-2. FRA, Accident/Incident Bulletin, 1975-1996, Tables 1, 51.
U.S. Railroad Safety Statistics: Thru October 2005, U.S. railroads are again achieving their safest year ever for these same measures: • Total Non-Fatal Injuries: down 2.7% from 2004 • Employee On-Duty Injuries & Injury Rates, down 10% and 14%, respectively from 2004 • Grade Crossing Collision Rates: down 8% Sources: FRA website: http://safetydata.fra.dot.gov/Prelim/2005/r01.htm (preliminary 2005 data) FRA, Railroad Safety Statistics Annual Report, 1997-2004, Tables 1-1, 1-2. FRA, Accident/Incident Bulletin, 1975-1996, Tables 1, 51.
In 2004, 94% of rail-related fatalities weregrade crossing users and trespassers. Grade Crossing Users: 364 Trespassers: 482 Employees: 25 Others: 24 Passengers: 3 Sources: FRA website: http://safetydata.fra.dot.gov/Prelim/2004/r03.htm (preliminary 2004 data). FRA, Railroad Safety Statistics Annual Report 2004, Table 1-3.
In 2004, 66% of rail-related injuries were incurred by employees on duty. Grade Crossing Users: 928 Trespassers: 402 Passengers: 636 Others: 1,034 Employees 5,938 Sources: FRA website: http://safetydata.fra.dot.gov/Prelim/2004/r03.htm (preliminary 2004 data). FRA, Railroad Safety Statistics Annual Report 2004, Table 1-3.
Train accidents per million train-miles have dropped 62% since 1980 and 8% since 1990. 11.43 4.73 4.33 Sources: FRA website: http://safetydata.fra.dot.gov/Prelim/2004/r01.htm (preliminary 2004 data). FRA, Railroad Safety Statistics Annual Report, 1997-2004, Tables 1-1, 1-2. FRA, Accident/Incident Bulletin, 1980-1996, Tables 19, 36. Note: Excludes grade crossing accidents.
Train collisions per million train-miles have dropped 82% since 1980 and 40% since 1990. 1.67 0.52 0.31 Sources: FRA website: http://safetydata.fra.dot.gov/Prelim/2004/r01.htm (preliminary 2004 data). FRA, Railroad Safety Statistics Annual Report, 1997-2004, Tables 1-1, 5-6. FRA, Accident/Incident Bulletin, 1980-1996, Tables 19, 36. Note: Excludes grade crossing collisions.
Mainline train collisions per million train-miles on Class I freight railroads have dropped 84% since 1980 and 49% since 1990. 0.52 0.54 All Collisions: All RRs 0.31 Mainline & Sidings: Class I Freight RRs 0.17 0.09 Sources: FRA website: http://safetydata.fra.dot.gov/Prelim/2004/r01.htm. AAR Analysis of FRA train accident database through 2004. FRA, Railroad Safety Statistics Annual Report, 1997-2004, Tables 1-1, 5-6; FRA, Accident/Incident Bulletin, 1980-1996, Tables 19, 36. Note: Excludes grade crossing collisions. Includes passenger train collisions on Class I freight railroads.
Derailments per million train-miles have dropped 65% since 1980 and 12% since 1990. 8.98 3.11 3.52 Sources: FRA website: http://safetydata.fra.dot.gov/Prelim/2004/r01.htm & r02.htm (preliminary 2004 data) FRA, Railroad Safety Statistics Annual Report, 1997-2004, Tables 1-1, 5-6. FRA, Accident/Incident Bulletin, 1980-1996, Tables 19, 36. Note: Excludes grade crossing accidents.
Equipment-caused accidents per million train-miles have dropped 73% since 1980 and 21% since 1990. 2.03 0.70 0.55 Sources: FRA website: http://safetydata.fra.dot.gov/Prelim/2004/r01.htm & r02.htm (preliminary 2004 data) FRA, Railroad Safety Statistics Annual Report, 1997-2004, Tables 1-1, 5-9. FRA, Accident/Incident Bulletin, 1980-1996, Tables 19, 36. Note: Excludes grade crossing accidents.
Track-caused accidents per million train-miles have dropped 72% since 1980 and 17% since 1990. 4.84 1.60 1.33 Sources: FRA website: http://safetydata.fra.dot.gov/Prelim/2004/r01.htm & r02.htm (preliminary 2004 data) FRA, Railroad Safety Statistics Annual Report, 1997-2004, Tables 1-1, 5-9. FRA, Accident/Incident Bulletin, 1980-1996, Tables 19, 36. Note: Excludes grade crossing accidents.
Human factors-caused accidents per million train-miles have dropped 46% since 1980 and 3% since 1990. 3.24 1.80 1.74 Sources: FRA website: http://safetydata.fra.dot.gov/Prelim/2004/r01.htm & r02.htm (preliminary 2004 data) FRA, Railroad Safety Statistics Annual Report, 1997-2004, Tables 1-1, 5-9. FRA, Accident/Incident Bulletin, 1980-1996, Tables 19, 36. Note: Excludes grade crossing accidents.
Brake equipment-related train accidents have dropped 82% since 1980 and 31% since 1990. 187 34 49 Sources: FRA, Railroad Safety Statistics Annual Report, 1997-2004, Table 5-9. FRA Accident/Incident Bulletin, 1980-1996, Table 19. AAR Analysis of FRA Train Accident Database through 2004. Note: Includes accidents due to locomotive brake defects.
Brake equipment-related train accident rates have dropped 83% since 1980 and 45% since 1990. Accidents per Million Train-Miles 0.26 0.08 0.04 Sources: FRA, Railroad Safety Statistics Annual Report, 1997-2004, Table 1-1, 5-9. FRA Accident/Incident Bulletin, 1980-1996, Table 19, 36. AAR Analysis of FRA Train Accident Database through 2004. Note: Includes accidents due to locomotive brake defects.
Wheel equipment-related train accident rates have dropped 74% since 1980 and 22% since 1990. Accidents per Million Train-Miles 0.411 0.105 0.135 Sources: FRA, Railroad Safety Statistics Annual Report, 1997-2004, Table 1-1, 5-9. FRA Accident/Incident Bulletin, 1980-1996, Table 19, 36. AAR Analysis of FRA Train Accident Database through 2004. Note: Includes accidents due to locomotive wheel defects.
Axle and bearings-related train accident rates have dropped 64% since 1980 and 25% since 1990. Accidents per Million Train-Miles 0.287 0.138 0.104 Sources: FRA, Railroad Safety Statistics Annual Report, 1997-2004, Table 1-1, 5-9. FRA Accident/Incident Bulletin, 1980-1996, Table 19, 36. AAR Analysis of FRA Train Accident Database through 2004. Note: Includes accidents due to locomotive axle or bearing defects.
Truck component-related train accident rates have dropped 77% since 1980 and 33% since 1990. Accidents per Million Train-Miles 0.450 0.153 0.103 Sources: FRA, Railroad Safety Statistics Annual Report, 1997-2004, Table 1-1, 5-9. FRA Accident/Incident Bulletin, 1980-1996, Table 19, 36. AAR Analysis of FRA Train Accident Database through 2004. Note: Includes accidents due to locomotive truck component defects.
Grade crossing collisions have declined 71% since 1980 and 46% since 1990. 10,611 5,715 3,067 Sources: FRA, Railroad Safety Statistics Annual Report, 1997-2004, Table 1-1. FRA Highway/Rail Crossing Accident/Incident & Inventory Bulletin,Table S, FRA website: http://safetydata.fra.dot.gov/Prelim/2004/r01.htm (preliminary 2004 data) Note: Includes accidents involving pedestrians. Includes accidents at private crossings.
Grade crossing fatalities have declined 56% since 1980 and 47% since 1990. 833 698 368 Sources: FRA, Railroad Safety Statistics Annual Report, 1997-2004, Tables 1-1, 1-3. FRA Highway/Rail Crossing Accident/Incident & Inventory Bulletin,Table S, FRA website: http://safetydata.fra.dot.gov/Prelim/2004/r01.htm (preliminary 2004 data) Note: Includes pedestrians, employees, passengers, and accidents at private crossings.
Grade crossing injuries have declined72% since 1980 and 55% since 1990. 3,890 2,407 1,085 Sources: FRA, Railroad Safety Statistics Annual Report, 1997-2004, Tables 1-1, 1-3. FRA Highway/Rail Crossing Accident/Incident & Inventory Bulletin,Table S, FRA website: http://safetydata.fra.dot.gov/Prelim/2004/r01.htm (preliminary 2004 data) Note: Includes pedestrians, employees, passengers, and accidents at private crossings.
Grade crossing collision rates have declined 73% since 1980 and 58% since 1990. Grade Crossing Collisions per Million Train-Miles 14.79 9.39 3.99 Sources: FRA, Railroad Safety Statistics Annual Report, 1997-2004, Table 1-1. FRA Highway/Rail Crossing Accident/Incident & Inventory Bulletin,Table S, FRA website: http://safetydata.fra.dot.gov/Prelim/2004/r01.htm & r02.htm (preliminary 2004 data) Note: Includes accidents involving pedestrians and accidents at private crossings.
Since 1980, public crossings have declined 31% while those with gates have doubled. 31% Decrease Passive 75% Passive 57% Lights 18% Lights 17% Gates 25% Gates 8% Sources: FRA, Railroad Safety Statistics Annual Report 2004, Table 9-3. FRA Highway/Rail Crossing Accident/Incident & Inventory Bulletin, 1980, Table 46.
Grade crossing warning device upgrades work. Gates cut the accident & fatality rates by 93%. Grade Crossing Collisions per Billion Collision Opportunities 296 63 21 Source: AAR Analysis of FRA Grade Crossing Incident & Inventory Databases, using 1999-2003 incident data and the December 2003 inventory data. Note: Collision opportunities are measured here as the average number of trains per hour multiplied by the average number of vehicles per hour moving over each crossing. It is useful primarily as a measure of relative, not absolute, exposure, since the time period (hour) is arbitrary.
Grade crossing collisions are usually caused by motorist error. Stopped, Proceeded 7% Stopped on Tracks: 26% Did Not Stop 49% Other 6% Drove Around Gate: 12% Sources: FRA, Railroad Safety Statistics Annual Report 2004, Table 8-6. AAR Analysis of Highway-Rail Incident Database for 2004. Note: Motor vehicle highway-rail incidents at public crossings.
Trespasser fatalities continue to pose a significant safety problem. 543 457 482 Sources: FRA, Railroad Safety Statistics Annual Report, 1997-2004, Tables 1-2, 10-3. FRA Accident/Incident Bulletin, 1980-1996, Table 13. FRA website: http://safetydata.fra.dot.gov/Prelim/2004/r03.htm (preliminary 2004 data) Note: Excludes "trespasser" fatalities at grade crossings.
But the trespasser fatality rate per million train miles is actually down slightly. 0.89 0.64 0.63 Sources: FRA, Railroad Safety Statistics Annual Report, 1997-2004, Tables 1-2, 10-3. FRA Accident/Incident Bulletin, 1980-1996, Table 13. FRA website: http://safetydata.fra.dot.gov/Prelim/2004/r03.htm (preliminary 2004 data) Note: Excludes "trespasser" fatalities at grade crossings.
91% of trespasser fatalities in 2004 resulted from being struck by trains or freight cars. Train Accidents 2 Other 41 Struck by Train 439 Source: FRA, RR Safety Statistics Annual Report 2004, Table 10-10. AAR Analysis of FRA Casualty Database for 2004. Note: Excludes "trespasser" fatalities at grade crossings.
Many Trespassers are Killed While Intoxicated. • A North Carolina study for the period 1990-1994 found that 78% of 128 trespassers killed on railroad property were intoxicated. • The median blood alcohol level for this group was 2.5 times the legal limit. • A 1994 South Carolina study of 24 train-related pedestrian fatalities found that 79% were intoxicated. • Toxicology results on 78 of 132 railroad trespassers killed in Georgia in the period 1990-1996 found 40 (51%) with alcohol levels above 100 mg/dL. Sources: Andrew Pelletier, MD, "Deaths Among Railroad Trespassers: The Role of Alcohol in Fatal Injuries,” Journal of the American Medical Association, Vol. 277, No. 13, April 2, 1997, pp. 1064-66. Center for Disease Control, Morbidity & Mortality Weekly Report, Vol. 48, No. 25, July 2, 1999.
Passengers are 15 to 20 times as likely to die on the highway as on a train. Passenger Fatalities per Billion Passenger Miles Highway Railroads Airlines Sources: National Transportation Statistics, 1993, p. 52, 1996, p. 72; NTSB, Aviation Accident Data Base FHWA, Highway Statistics 2003, Table VM-1. NHTSA, Traffic Safety Facts 2004, Early Ed., Table 4, p. 18. FRA Accident/Incident Bulletin, Tables 13, 36; RR Safety Statistics Annual Report 2004, Tables 1-3, 2-9. Excludes 232 airline passenger fatalities in the Sept. 11, 2001 terrorist attacks. Domestic flights only.
Railroads and airlines have comparable passenger fatality rates. Passenger Fatalities per Billion Passenger Miles Railroads Airlines Sources: National Transportation Statistics, 1993, p. 52, 1996, p. 72; NTSB, Aviation Accident Data Base FRA Accident/Incident Bulletin, Tables 13, 36; RR Safety Statistics Annual Report 2004, Tables 1-3, 2-9. Note: 1993 RR fatalities included 42 killed in one Amtrak accident caused by a barge hitting & misaligning a RR bridge and another 6 killed by a gunman on the Long Island RR. Excludes 232 fatalities in 9/11 attacks.
Railroads have reduced employee casualty rates by 77% since 1980 and 66% since 1990. Total Casualties per 100 Full-Time Employees 11.16 7.59 2.60 Sources: FRA, Railroad Safety Statistics Annual Report, 1997-2004, Tables 1-2, 4-1. FRA Accident/Incident Bulletin, 1980-1996, Tables 13, 36. FRA website: http://safetydata.fra.dot.gov/Prelim/2004/r01.htm & r02.htm (preliminary 2004 data) Note: Casualties include fatalities as well as injuries and occupational illnesses.
Railroads have lower employee injury rates than do other major industry groups. Lost Workday Injuries & Illnesses per 100 Full Time Employees, 2004 Source: Bureau of Labor Statistics, http://www.bls.gov/iif/oshwc/osh/os/ostb1487.pdf
Railroads have lower employee injury rates than do other transportation modes. Lost Workday Injuries & Illnesses per 100 Full Time Employees, 2004 Source: Bureau of Labor Statistics, http://www.bls.gov/iif/oshwc/osh/os/ostb1487.pdf
Railroads have lower employee fatality rates than do most other transportation modes. Fatalities per 100,000 Full Time Employees, 2004 Sources: Bureau of Labor Statistics, National Census of Fatal Occupational Injuries, 2004, Table 2; And BLS Quarterly Census of Employment & Wages (QCEW) Program for number of employees. FRA, Railroad Safety Statistics Annual Report 2004, Tables 1-1 and 1-2.
Railroads have about the same injury severityas do other industries. Percent of Lost Workday Employee Injuries, 2003 Source: Bureau of Labor Statistics, Table R49. Number of nonfatal occupational injuries and illnesses involving days away from work by nature of injury and industry division, 2003. http://www.bls.gov/iif/ oshwc/osh/case/ostb1427.pdf . FRA, Railroad Safety Statistics Annual Report 2003, Table 4-1.
Railroads have about the same injury severity as do other industries. Percent of Lost Workday Employee Injuries, 2003 (Sprains not shown) Source: Bureau of Labor Statistics, Table R49. Number of nonfatal occupational injuries and illnesses involving days away from work by nature of injury and industry division, 2003. http://www.bls.gov/iif/ oshwc/osh/case/ostb1427.pdf . FRA, Railroad Safety Statistics Annual Report 2003, Table 4-1.
U.S. railroads have had lower employee injury rates than have most major European railroads. Lost Workday Injuries per 100 Employees Spain Italy Belgium Austria France Norway BR Germany U.S. Britain Sweden Sources: UIC, Statistics on Accidents at Work, 1993-2001. FRA, Accident/Incident Bulletin, Tables 43, 45, 46. FRA, Railroad Safety Statistics Annual Reports, 1997-2001, Tables 4-1, 1-1. UIC discontinued these stats after 2001. Notes: Excludes occupational illnesses. Excludes injuries with no days away from work. Includes fatal injuries. Data for Sweden & Norway (1993-96) and for U.S. (all years) is per 200,000 hours actually worked, hence higher.
The safest U.S. RRs have had lower employee injury rates than have the safest European RRs. Lost Workday Injuries per 100 Employees Norway Sweden BR IC CSX UP BNSF NS Sources: UIC, Statistics on Accidents at Work, 1993-2001. FRA, Accident/Incident Bulletin, Tables 43, 45, 46. FRA, Railroad Safety Statistics Annual Reports, 1997-2001, Tables 4-1, 1-1. UIC discontinued these stats after 2001. Notes: Excludes occupational illnesses. Excludes injuries with no days away from work. Includes fatal injuries. Data for Sweden & Norway (1993-96) and for U.S. (all years) is per 200,000 hours actually worked, hence higher.
Train accidents and grade crossing collisions account for about 5% of employee injuries. All Other Incidents 95.44% Train Accidents 2.62% Grade Crossing Collisions 1.94% Source: FRA website: http://safetydata.fra.dot.gov/Prelim/2004/r03.htm (preliminary 2004 data) See also FRA, Railroad Safety Statistics Annual Report 2004, Table 1-3.
Railroads have reduced employee on duty fatalities by 74% since 1980 and 38% since 1990. 97 40 25 Sources: FRA, Railroad Safety Statistics Annual Report, 1997-2004, Tables 1-2, 1-3, 4-2. FRA Accident/Incident Bulletin, 1980-1996, Tables 13. FRA website: http://safetydata.fra.dot.gov/Prelim/2004/r03.htm (preliminary 2004 data)
Railroads employee fatality rates have fallen 24% since 1990. Employee On-Duty Fatalities per 100,000 Employees 14.5 10.9 Sources: FRA, Railroad Safety Statistics Annual Report, 1997-2004, Tables 1-1, 4-2. FRA Accident/Incident Bulletin, 1980-1996, Tables 13, 36. FRA website: http://safetydata.fra.dot.gov/Prelim/2004/r03.htm & r02.htm (preliminary 2004 data)
Of 25 employee fatalities in 2004, 11 were due to being struck by moving on-track equipment and 8 were in train or grade crossing collisions. Struck by Road Train – 2 (“SOFA”) Transportation, Not in Train Accident Switching, Struck By Cars (“SOFA”)- 9 Road Train Collisions - 6 Grade Xing Collision - 2 Shop Accident - 1 Hwy Accident - 1 Maintenance of Equipment Transportation: Train Accident Fell from Car - 1 Crushed by Track Car - 1 Maintenance of Way Sources: News clippings and FRA, Monthly Reports on Employee Fatalities, 2004. FRA, Railroad Safety Statistics Annual Report, 1997-2004, Tables 1-2.
Hazmat incident release rates have declined 72% since 1980 and 58% since 1990. Incidents per Thousand Hazmat Carloads 1.52 0.99 0.42 99.96% Incident Free Sources: USDOT, Pipeline & Hazardous Materials Safety Administration, Hazardous Materials Incidents by Year & Mode. http://hazmat.dot.gov/files/hazmat/10year/10yearfrm.htm for 1995-2004. Includes releases in train accidents as well as non-accident releases. ICC/STB Waybill Sample. 1995-2004. Carloadings adjusted to counter known hazmat underreportings of hazmat designations.
Hazmat accident rates have declined 89% since 1980 and 40% since 1990. Train Accidents with a Release per Thousand Hazmat Carloads 0.143 99.9974% of Carloads are Accident Release Free 0.016 0.027 Sources: FRA, RR Safety Statistics Annual Report, 1997-2004, Table 6-1. FRA, Accident/Incident Bulletin, Table 26. ICC/STB Waybill Sample. 1995-2004. Carloadings adjusted to counter known hazmat underreportings. Note: An accident may involve releases from more than one car.
Accidents with a hazmat release have declined 76% since 1980 and 17% since 1990. Train Accidents with a Hazmat Release 119 29 35 Sources: FRA, RR Safety Statistics Annual Report, 1997-2004, Tables 6-1. FRA, Accident/Incident Bulletin, Table 26. Note: An accident may involve releases from more than one car. AAR Analysis of FRA Train Accident Database through 2004.
Less than 1% of train accidents result in a release of hazardous materials. No Hazmat Cars Present 2,725 76.6% Hazmat Cars in Consist 453 12.7% Hazmat Cars Derailed or Damaged 352 9.9% Hazmat Released 29 0.8% Source: AAR Analysis of Year 2004 FRA Train Accident Database. Note: Includes grade crossing train accidents meeting dollar threshold.
Rail freight transport incurs about 13% of the fatalities that trucks do per trillion ton-miles. 3,762 3,300 680 422 Sources: FRA, RR Safety Statistics Annual Report 2003, Table 1-4. Rail Ton-Miles in 2003 from RR Facts, 2004 Ed., p. 32, Eno Foundation. USDOT, FMCSA, Large Truck Crash Facts, 2003, Table 13, http://ai.volpe.dot.gov/CarrierResearchResults/PDFs/LargeTruckCrashfacts2003.pdf (p. 19) Tractor-trailer net ton-miles in 2002 estimated at 1.14 trillion from 2002 USDOC,Vehicle Inventory & Use Survey (VIUS), updated to 2003 based on VMT from same Table 13.