Download
1 / 21
210 likes | 359 Vues
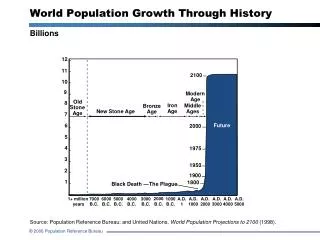
Notes on Trends in Population Growth Worldwide. This figure illustrates the lag between changes in the rate of growth and the net increase in population per year.

E N D
Notes on Trends in Population Growth Worldwide • This figure illustrates the lag between changes in the rate of growth and the net increase in population per year. • Over the period 1985-1995, the population growth rate declined (a reflection of declining fertility), yet millions of people were added to the world’s population (which peaked around 1985, when 87 million people were added each year). • From 2000 on, the growth rate will continue to decline. Between 2015 and 2020, we will still be adding 72 million people each year. Why? Because the generation of women now having their children is very large as the result of high fertility in their mothers’ and grandmothers’ generations.
Growth in More, Less Developed Countries Billions Less Developed Regions More Developed Regions Source: United Nations, World Population Prospects: The 2004 Revision (medium scenario), 2005.
World Population Clock 2005 Source: Population Reference Bureau, 2005 World Population Data Sheet.
Birth and Death Rates, Worldwide Rates of birth, death, and natural increase per 1,000 population Natural Increase Source: United Nations, World Population Prospects: The 2004 Revision, 2005.
Notes on Birth and Death Rates, Worldwide Birth rates and death rates are declining around the world. Overall economic development, public health programs, and improvements in food production and distribution, water, and sanitation have led to dramatic declines in death rates. And women now have fewer children than they did in the 1950s. Nevertheless, if death rates are lower than birth rates, populations will still grow. Also, it is possible for absolute numbers of births to increase even when birth rates decline.
Women of Childbearing Age and Fertility Worldwide Source: United Nations, World Population Prospects: The 2004 Revision (medium scenario), 2005.
Notes on Women of Childbearing Age and Fertility The number of women in their childbearing years has increased since the 1950s and is projected to continue to increase to 2050. The number of children per woman has declined since the 1950s and is projected to continue to decline. Even though women have on average fewer children than their mothers, the absolute number of babies being born continues to increase because of the increases in the total number of women of childbearing age.
Trends in Life Expectancy, by Region Life Expectancy at Birth, in Years Source: United Nations, World Population Prospects: The 2004 Revision (medium scenario), 2005.
Notes on Trends in Life Expectancy, by Region In 2045-2050, infants born around the world can expect to live an average of 75 years — up ten years from today. Africa will experience the largest increase in life expectancy: from 49 years to 65 years. Life expectancy varies widely by region. In more developed countries, life expectancy averages 76 years, compared with only 49 years in Africa.
Age Distribution of the World’s Population Population Structures by Age and Sex, 2005 Millions Less Developed Regions More Developed Regions Age 80+ 75-79 70-74 65-69 60-64 55-59 50-54 45-49 40-44 35-39 30-34 25-29 20-24 15-19 10-14 5-9 0-4 Male Female Male Female Source: United Nations, World Population Prospects: The 2004 Revision, 2005.
Notes on Age Distribution of the World’s Population Sex and age distributions show that less developed countries have significantly younger populations than more developed countries. Almost one-third of the population in less developed countries is under age 15. In contrast, less than one-fifth of the population in more developed countries is under 15. Today there are more than 2 billion young people below age 20 in less developed regions—the age cohort that will soon become the world’s newest group of parents. Young age structures in the less developed countries are due mainly to higher levels of childbearing in recent decades.
The Classic Stages of Demographic Transition Note: Natural increase is produced from the excess of births over deaths.