Global Population Growth: Key Milestones, Rankings, and Urbanization Trends
This overview highlights significant global population milestones, detailing the rapid increase from 1 billion in 1804 to projected figures of 9.7 billion by 2050. It presents statistical rankings of countries by their populations, emphasizing shifts from 2006 to 2050, where India is set to surpass China. The analysis also explores population distribution across major regions, the challenges of urbanization, and the environmental factors influencing demographic changes. Additionally, it addresses issues related to food supply and natural resource management amid population growth.

Global Population Growth: Key Milestones, Rankings, and Urbanization Trends
E N D
Presentation Transcript
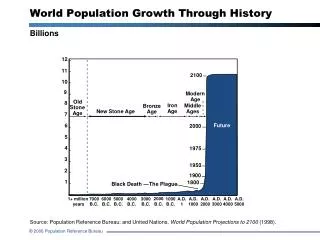
World Population Milestones • 1 billion in 1804 • 2 billion in 1927 (123 years later) • 3 billion in 1960 ( 33 years later) • 4 billion in 1974 ( 14 years later) • 5 billion in 1987 ( 13 years later) • 6 billion in 1999 ( 12 years later)
Countries Ranked by Population: 2006 -------------------------------------------------------- Rank Country Population -------------------------------------------------------- 1 China 1.3 billion 2 India 1.1 billion 3 United States 300 million 4. Indonesia 231million 5 Brazil 188 million 6 Pakistan 165 million 7 Bangladesh 147 million 8 Russia 142 million 9 Nigeria 132 million 10 Japan 127 million
Countries Ranked by Population: 2050 -------------------------------------------------------- Rank Country Population ------------------- 1 India 1.8 billion 2 China 1.4 billion 3 United States 420 million 4 Nigeria 356 million 5 Indonesia 313 million 6 Pakistan 294 million 7 Bangladesh 279 million 8 Brazil 228 million 9 Congo (Kinshasa)183 million 10 Mexico 147 million
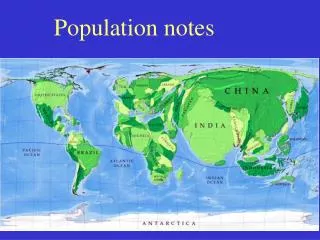
Population Patterns 1. Population distribution – An area’s physical environment, especially climate, limits the number of people who can live there. There are 4 centers of heavy population in the world:
Eastern Asia has the greatest concentration of people on earth – it is centered in China – 21% of the Earth’s population
South Asia is the second largest concentration of people—it is centered in India – 16% of the world’s population.
Europe is the third largest concentration. Western Europe- people are concentrated near natural resources needed for industry.
D. East US. In the US, the chain of cities start from the city of Boston to south of Washington D.C. This is called a megalopolis.
Population Density – tells you how concentrated the numbers of people are in an area. It makes it possible to compare areas of different size and population in an area.
Rank Urbanized Area Population Square Miles Population per Square Mile Population per Square Kilometer Decade of Estimate Source for Urbanized Area Largest 1 Tokyo 31,797,000 1,728 18,401 7,099 1986-1995 Kenworthy-Laube 2 Mexico City 17,250,000 570 30,263 11,676 1996-2005 Demographia, 2001 3 Sao Paulo 16,800,000 950 17,684 6,823 1996-2005 Demographia, 1998 4 Seoul 16,732,000 270 61,970 23,908 1986-1995 Kenworthy-Laube 5 New York 16,044,000 2,967 5,407 2,086 1986-1995 US Census 6 Mumbai 15,700,000 200 78,500 30,285 1996-2005 Demographia, 1998 7 Osaka-Kobe-Kyoto 12,300,000 700 17,571 6,779 1996-2005 Demographia, 1998 8 London 12,264,000 2,932 4,183 1,614 1996-2005 Demographia, 1998 9 Calcutta 12,100,000 400 30,250 11,671 1996-2005 Demographia 10 Los Angeles 11,402,000 1,966 5,800 2,237 1986-1995 US Census 11 Buenos Aires 11,100,000 970 11,443 4,415 1996-2005 Demographia, 1998 12 Delhi 10,300,000 225 45,778 17,661 1996-2005 Demographia. 1998 13 Rio de Janiero 10,300,000 900 11,444 4,415 1996-2005 Demographia, 1998 14 Karachi 10,100,000 360 28,056 10,824 1996-2005 Demographia, 1996
1. 1. Food Supply a. 13-18 million people die each year because they do not have a good diet (35,000 a day, 24 a minute)
B. The population explosion has raised such issues as how to increase food supplies. Drying rice in Thailand
D. How to find new sources of food. 1.Today 90% of the world’s food comes from 15 crops and 7 livestock animals 2. There are more than 10 million kinds of plants and animals on Earth.
E. Natural Resource Issues 1. Certain resources are in limited supply, such as fossil fuels 2. Fresh water is one basic resource that is being threatened.
Migration • 1. People move because of either economic or political reasons (push- pull forces) • 2. Worldwide, more people are moving from the countryside to urban areas – and from developing to industrialized countries. This places huge demands on the country or cities economy.
Economic Geography AA. Various levels of economic activities. 1. Primary economic activities make direct use of natural resources. a. Agriculture b. Forestry c. Mining
2. Secondary economic activities convert raw materials into new products. a. Food processing b. Manufacturing c. Refining