Download
1 / 15
150 likes | 165 Vues
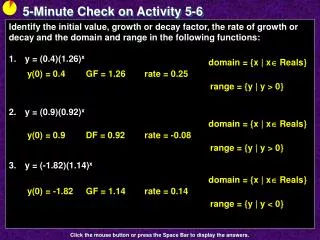
Learn problem-solving methods and input-output relationships in this activity-packed lesson covering mileage, temperatures, and mathematical functions.

E N D
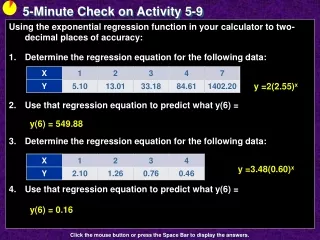
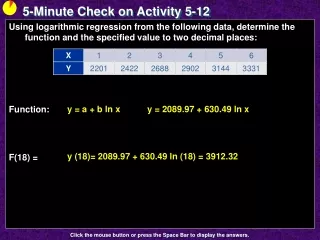
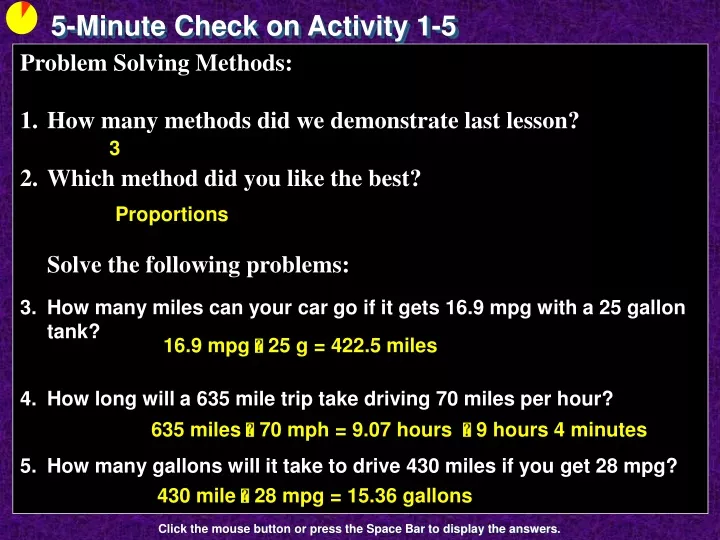
5-Minute Check on Activity 1-5 • Problem Solving Methods: • How many methods did we demonstrate last lesson? • Which method did you like the best?Solve the following problems: • How many miles can your car go if it gets 16.9 mpg with a 25 gallon tank? • How long will a 635 mile trip take driving 70 miles per hour? • How many gallons will it take to drive 430 miles if you get 28 mpg? 3 Proportions 16.9 mpg 25 g = 422.5 miles 635 miles 70 mph = 9.07 hours 9 hours 4 minutes 430 mile 28 mpg = 15.36 gallons Click the mouse button or press the Space Bar to display the answers.
Activity 1 - 6 Hot in Texas
Objectives • Identify input and output in situations involving two variables • Identify a functional relationship between two variables • Identify the independent and dependent variables • Use a table to numerically represent a functional relationship between two variables • Represent a functional relationship between two variables graphically • Identify trends in data pairs that are represented numerically and graphically, including increasing and decreasing
Vocabulary • Variable – usually represented by a letter, a quantity that may change in value • Function – a correspondence between an input variable and an output variable that assigns a single unique output variable to each input value • Input – the variable that we have control over or that is independent • Output – corresponds to a particular input value • Independent – the input variable • Dependent – the output variable
Vocabulary cont • Ordered Pairs – table of values or points on a graph in the form of (input value, output value) • Numerically defined function – using ordered pairs of numbers; for each input value, only one output value • Rectangular coordinate system – horizontal axis represents the input variable and the vertical axis represents the output • Quadrants – sections of coordinate plane defined by x, y axes (starts with I in upper right and goes counterclockwise)
Vocabulary cont • Increasing – a function is increasing if its graph rises to the right • Decreasing – a function is decreasing if its graph falls to the right • Constant – a function is constant if its graph is horizontal
Activity: Moving to Texas It is July, and you have just moved to Midland-Odessa, Texas. The area is in the middle of a heat spell. The high temperature for each of the last 5 days has exceeded 100°F. You are sweltering and you check the internet to look at the average monthly high temperatures in Midland-Odessa compared to Marion Virginia (where you were).
Temperature as a Function Identify the input and output variables in the table. What is the average hi temperature for July? for Jan? For each input variable (month number), how many different outputs (ave hi temperatures) are there? input month output average high temperature 94.3 vs 83.7 56.8 vs 43.3 only one
Functions • A function is a correspondence between an input variable and an output variable that assigns a single, unique output value to each input value. If x represents the input variable and y represents the output variable, then the function assigns a single, unique y-value to each x-value. • Numerically as ordered pairs (x, y) if no two ordered pairs have the same x-value and different y-values • Graphically, a curve represents a function if it passes what is called the vertical line test
y x Vertical Line Test A vertical line can only touch a function in one place If a vertical line touches a curve in more than one place, then it is not a function.
Determine if They are Functions • The amount of property tax you have to pay is a function of the assessed value of the house • The weight of a letter in ounces is a function of the postage paid for mailing the letter yes; some sort of a linear function maybe; domestically no; internationally
y Graphing Functions Plot the Midlands-Odessa data as squares and the Marion data as dots x 100 90 80 70 60 50 40 30
y x Quadrants Start in the upper right and go in a counterclockwise direction numbering the quadrants Quadrant II Quadrant I Quadrant III Quadrant IV
y y y x x x Increasing, Decreasing and Constant • An increasing graph rises from left to right • A decreasing graph falls from left to right • A horizontal line is constant Slope: m > 0 Slope: m < 0 Slope: m = 0
Summary and Homework • Summary • Input variables are the independent variables; listed first in an ordered pair; Output variables are the dependent variables; listed second in an ordered pair • Functions related input to output variables in a special way so that a single unique output is assigned to each input • Functions can be defined numerically using ordered pairs (or equations) or graphically using plotted points • Perpendicular coordinate axes (x and y) divide the plane into 4 quadrants (counterclockwise) • Functions increase if their graph rises to the right, decrease if their graph falls to the right and is constant if its graph is horizontal • Homework • pg 52-55; 1-9