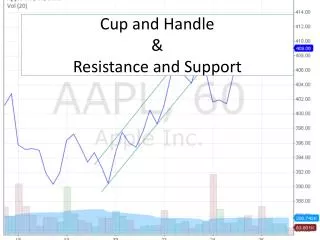
Cup with Handle Base
Cup with Handle Base. Saucer Base.

Cup with Handle Base
E N D
Presentation Transcript
Saucer Base The Saucer base is basically a long, drawn out cup base. Characteristics of a Saucer are:1. A depth of 12-20%.2. A length of 7 weeks to more than a year.3. If a handle forms then the buy point is the peak just before the pull back plus 10 cents.4. However a handle will often not form after the long period of this base. If there is no handle then the buy point is the peak on the left side of the saucer plus 10 cents
Double Bottom Flat Base – (Second Stage) Second stage base that follows an uptrend off of a stage 1 proper base (cup with saucer, saucer, double bottom) and an uptrend Tight Closes and Narrow Price Spreads Prior Sequence 1. Uptrend 2. Proper Base
Ascending Base – (Second Stage) Second stage base that follows an uptrend off of a stage 1 proper base (cup with saucer, saucer, double bottom) and an uptrend Pull-backs occur at general market declines Square Box – (Second Stage) Second stage base that follows an uptrend off of a stage 1 proper base (cup with saucer, saucer, double bottom) and an uptrend Buy Point = $ 0.10 above highest peak < 10-15% 4 – 7 Weeks
3 – 4 Weeks Tight – (Second Stage) Second stage base that follows an uptrend off of a stage 1 proper base (cup with saucer, saucer, double bottom) and an uptrend. • Volume over 3 – 4 weeks is well under control • Weekly closes within 1%, however, 1 week can be 1.5% • Opportunity to add High Tight Flag The pattern forms when a stock surges 100% to 120% in four to eight weeks. The stock then corrects 10% to 25% in three to five weeks. The ideal buy point is the high of the flag plus 10 cents Breakout from Proper Base followed by price run-up of > 100% within 4-8 weeks 3 – 5 weeks correction between 10 – 25% Buy Point = 0.10 higher than peak of correction
Base on Base If an uptrend is less than 20% and the stock builds another base, it's called a "base-on-base" pattern and is counted as part of the previous base.