Download
1 / 53
530 likes | 724 Vues
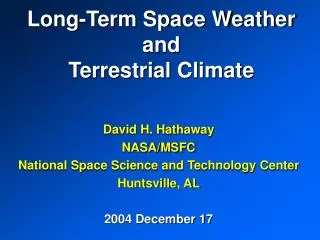
Sunspots, Space Weather, and Climate. Dr. David H. Hathaway NASA Marshall Space Flight Center AAS/SPD Public Lecture 2009 June 16. Outline. Sunspots “Discovered” The Sunspot Cycle Solar Flares and Solar Activity Solar Activity and Space Weather Solar Activity and Terrestrial Climate.

E N D
Sunspots, Space Weather, and Climate Dr. David H. Hathaway NASA Marshall Space Flight Center AAS/SPD Public Lecture 2009 June 16
Outline • Sunspots “Discovered” • The Sunspot Cycle • Solar Flares and Solar Activity • Solar Activity and Space Weather • Solar Activity and Terrestrial Climate
Sunspots “Discovered” Sunspots were “discovered” on the Sun within months of the first use of the telescope for observing celestial objects in 1609. However, spots on the Sun were previously noted by Chinese observers as early as 28 BC. Galileo Galilei Thomas Harriot
Sunspots Sunspots are dark (and cooler) regions on the surface of the Sun. They usually have a darker inner region (the Umbra) surrounded by a lighter ring (the Penumbra). Sunspot usually appear in groups that form over hours or days and last for days or weeks. These early sunspot observations indicated that the Sun rotates once in about 27 days.
Discovery Astronomers had been observing sunspots for over 230 years before Heinrich Schwabe, an amateur astronomer in Dessau, Germany, discovered in 1844 that the number of sunspot groups and the number of days without sunspots increased and decreased in cycles of about 10-years. Schwabe’s data for the number of sunspot groups observed each year from 1826 to 1843. Schwabe’s data for the number of spotless days observed each year from 1826 to 1843.
Wolf’s Sunspot Numbers Shortly after Schwabe’s discovery of the sunspot cycle, Rudolf Wolf in Switzerland realized the need for continuous daily observations and organized a network of observers that started in 1849. He recognized the difficulty of counting individual sunspots and devised a “Relative” sunspot number, R, given as: R=k(10g+n) Where k is a correction factor, g is the number of sunspot groups, and n is the number of individual sunspots. He found records from earlier observers and reconstructed sunspot numbers back to 1749. Rudolf Wolf (1816-1893)
23 Cycles of Wolf Sunspot Numbers While there were many days without observations prior to 1849 but, sunspots have been counted on every day since. To this day we continue to use Wolf’s Relative Sunspot Number and his sunspot cycle numbering. The average cycle lasts about 11 years, but with a range from 9 to 14. The average amplitude is about 100, but with a range from 50 to 200.
Sunspot Latitudes In 1858 Richard Carrington noted that sunspots appear in two bands on either side of the equator and that these bands drift toward the equator as the cycle progresses. This was debated until E. Walter Maunder’s “Butterfly Diagram” of 1904.
A Dozen Butterflies We can now see that sunspot cycles overlap by 2-3 years and that bigger cycles have wider sunspot zones that extend to higher latitudes.
The Maunder Minimum In 1890 Maunder reported in MNRAS on the work of Spörer: “For a period of about seventy years, ending in 1716, there seems to have been a very remarkable interruption of the ordinary course of the spot cycle.” The existence of the “Maunder Minimum” is now well established after the efforts of Eddy (1976). In particular Hoyt and Schatten (1998) have tabulated daily observations with nearly complete coverage over this period.
The Key to Sunspots: Magnetism In 1908 George Ellery Hale reported “On the probable existence of a magnetic field in Sun-spots.” This was the key to understanding sunspots. It also turned out to be the key to understanding many other aspects of the sunspot cycle and solar activity. George Ellery Hale (1868-1938)
Spectral Analysis If a sliver of light from the Sun is passed through a prism we can see its full spectrum of colors. Some colors (wavelengths of light) are absorbed by atoms and ions in the Sun’s atmosphere. The absorbed color represents the precise energy needed to bump an electron into a higher orbit around the nucleus of the atom or ion. The orbits of electrons in atoms and ions are changed in the presence of a magnetic field. Electrons orbiting in one direction will have more energy than electrons in the same orbit traveling in the opposite direction. The light absorbed by these atoms and ions will be shifted to the red or blue and the strength and direction of the magnetic field is revealed!
Sunspot Structure Sunspots are regions where intense magnetic fields break through the surface of the Sun and spread out across its surface. The magnetic field strengths are typically about 6000 times stronger than the Earth’s magnetic field. Weiss, Thomas, Brummell, & Tobais (2004)
Sunspot Structure Details SOHO/MDI and Swedish Solar Telescope (Scharmer)
Hale’s Magnetic Polarity Law In 1919 Hale (along with Ellerman, Nicholson, and Joy) found that the magnetic field in sunspots followed a definite law, “Hale’s Law” such that: “…the preceding and following spots … are of opposite polarity, and that the corresponding spots of such groups in the Northern and Southern hemispheres are also opposite in sign. Furthermore, the spots of the present cycle are opposite in polarity to those of the last cycle”.
Active Region Tilt- Joy’s Law In that same 1919 paper Joy noted that sunspot groups are tilted with the leading spots closer to the equator than the following spots. This tilt increases with latitude.
Polar Field Reversals In 1959 Babcock noted that the magnetic polarities of the Sun’s weak polar fields also reverse from one cycle to the next, and that this reversal happens at about the time of sunspot cycle maximum.
Sunspot Cycle Behavior In addition to these magnetic polarity changes and the equatorward drift of the sunspot latitudes, there are important flows on the surface and within the Sun that influence the sunspot cycle: Differential Rotation – faster at the equator, slower near the poles; and Meridional Flow – flow from the equator toward the poles.
Probing the Sun’s Interior We can probe the temperature, density, and flows within the Sun using Helioseismology – the study of the properties of sound waves seen traveling along the surface of the Sun. Thompson et al. (1996)
Babcock’s Dynamo (1961) Dynamo models have been developed to explain the sunspot cycle. a) Dipolar field at cycle minimum threads through a shallow layer below the surface. b) Differential rotation shears out this poloidal field to produce a strong toroidal field (first at the mid-latitudes then progressively lower latitudes). c) Buoyant fields erupt through the photosphere giving Hale’s polarity law and Joy’s Law. d) Meridional flow away from the active latitudes gives cancellation near the poles and equator.
Solar Flares and Solar Activity In 1859 Richard Carrington reported observing a large sunspot group on the afternoon of September 1st when “…two patches of intensely bright and white light broke out…” R. Hodgson observed and reported on the same event which he described as having “…the appearance of a very brilliant star of light, much brighter than the sun’s surface…”
Flares over the Solar Cycle Solar flares have been monitored by x-ray detectors on NOAA’s GOES satellites since 1976. They are classified by how bright they are in x-rays with X-Class flares being the brightest. The number of X-Class flares per month increases with the number of sunspots but big flares can occur anytime sunspots are present.
The 1972 Seahorse Flare The “Seahorse” flare of August 7th, 1972 released the energy equivalent of over 10,000,000 atomic bombs over the course of about an hour. This event could have caused harm to astronauts had they been on the moon at that time.
Prominences Prominences are clouds of plasma held above the surface of the sun by magnetic fields. They can be seen during total solar eclipses and with specialized equipment. Quiescent prominences can stay suspended for days or weeks. Eruptive prominences lift off of the Sun in hours. Prominence Drawings (1872) Total eclipse of August 11, 1999
The Granddaddy Prominence One of the largest eruptive prominences was observed at the High Altitude Observatory in 1945.
Quiescent? Prominences High resolution images from the Hinode satellite show that even Quiescent Prominences are always active.
Coronal Mass Ejections The Sun’s Corona, its hot tenuous outer atmosphere, could only be observed during total eclipses prior to the space age. It wasn’t until then that Coronal Mass Ejections or CMEs were discovered. At the peak of the sunspot cycle many can be seen in a day. At the minimum of the sunspot cycle days can go by without one. SMM Coronagraph (HAO) SOHO Coronagraph (NRL)
Solar Activity Solar Flares, Prominence Eruptions, and Coronal Mass Ejections are all forms of solar activity. Each can occur on its own but they often occur together.
Space Weather Space weather refers to conditions on the Sun and in the space environment that can influence the performance and reliability of space-borne and ground-based technological systems, and can endanger human life or health.
CME Impact on Earth Magnetized clouds of plasma blasted off of the Sun as CMEs can impact the Earth’s environment – distorting the magnetic field surrounding the Earth and producing energetic particles that stream into the polar regions to create aurorae.
Geomagnetic Activity Variations in the strength and direction of the Earth’s magnetic field have been routinely measured at a number of geographic locations since the mid-1800s. The source of these variations can be found in CMEs and other disturbances in the solar wind.
Effects of Solar Activity: On Power Grids Solar disturbances that shake the Earth’s magnetic field set up huge electrical currents in power lines and pipe lines. The solar storm of March 13th 1989 fried a $10M transformer in NJ. The same storm interrupted power to the province of Quebec for 6 days.
Solar Activity & Satellites Radiation (Solar Energetic Particles including protons, electrons, alpha particles) from solar flares and coronal mass ejections can damage electronics on satellites. • 1991 GOES • 1995 Deutsche Telekom • 1996 Telesat Canada • 1997 Telstar 401 • 2000/07/14 ASCA • 2003 Mars Odyssey • 4500 spacecraft anomalies over last 25 years • A big event could cause billions of dollars in damage
Satellite Drag Credit: S.Solomon The solar activity cycle modulates the temperature and density of the thermosphere. Variations in the Sun’s UV and EUV irradiance over a solar cycle produce factors of 10 changes in the density at some spacecraft altitudes.
Solar Activity & Human Space Flight Shuttle missions and Extra-Vehicular Activity require particular attention. The Space Radiation Analysis Group (SRAG) reports to Mission Control when: Geomagnetic K-index > 6, X-Ray Flux > M5, Protons at >100 MeV > 50.
HF Communication only Effects of Solar Activity: On Airline Operations • Polar flights departing from North America use VHF (30-300 MHz) comm or Satcom with Canadian ATCs and Arctic Radio. • Flights rely on HF (3 – 30 MHz) communication inside the 82 degree circle. • Growth: Airlines operating China-US routes goes from 4 to 6 and then number of weekly flights goes from 54 to 249 over the next 6-years.
Galactic Cosmic Ray Modulation The solar activity cycle modulates the radiation environment in the inner solar system. While the flux of Solar Energetic Particles (SEP) from solar flares and coronal mass rises and falls with the sunspot number, the flux of Galactic Cosmic Rays (GCR) is low when sunspot number is high.
The Climate Connection Solar cycle related variations are evident in the terrestrial temperature record. Estimates of the variations in temperature at the Earth’s Surface (Mann et al. 1998, Moberg et al. 2005) show significant correlations with variations in the amplitude of the sunspot cycle.
The Long-Term Record The radioisotopes 14C and 10Be are produced in the Earth’s upper atmosphere by the impact of Cosmic Rays on nitrogen. The solar activity cycle modulates the production of these radioisotopes since there are fewer Cosmic Rays when the Sun is active. This leaves an imprint of solar activity in 14C in tree rings and 10Be in ice cores.
The Climate ConnectionJack Eddy In the mid 1970’s Jack Eddy was instrumental in drawing attention to the existence of the Maunder Minimum and its effect on terrestrial climate. Jack Eddy 1931-2009
The Total Solar Irradiance Previously called the Solar Constant, The Total Solar Irradiance shows variations associated with solar activity. The passage of individual sunspot groups produces dips while the background level rises and falls with the solar cycle. The solar cycle variation observed by the ACRIM instrument on SolarMax (SMM) was about 0.1%.
Three Solar Cycles of TSI Several different instruments on several different satellites now provide coverage over three solar cycles. While each instrument obtains precise measurements of the variations, the absolute calibrations are uncertain. This results in composite that disagree on critical points. Was the TSI the same at each cycle minima? Was the TSI the same at each cycle maxima? They do agree that the variation is about 0.1%.
Total Irradiance and Climate The 0.1% change in the Total Solar Irradiance seen over the last three solar cycles only produces a 0.1° C temperature change in climate models. However, the Sun seems to have a bigger impact. Two other mechanisms (besides direct forcing by the Total Solar Irradiance variations) are under study: 1) solar ultraviolet and extreme ultraviolet variability and 2) Cosmic Ray modulation on cloud cover.
EUV Irradiance Variations Solar activity related changes in Extreme Ultraviolet light from the Sun are many times larger than the Total Solar Irradiance changes. These EUV variations could produce changes in upper atmospheric chemistry that might have a bigger influence on climate.