Download
1 / 2

E N D
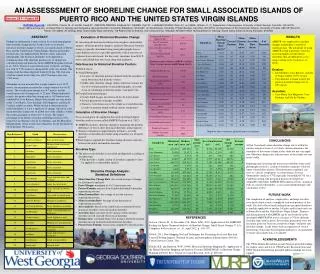
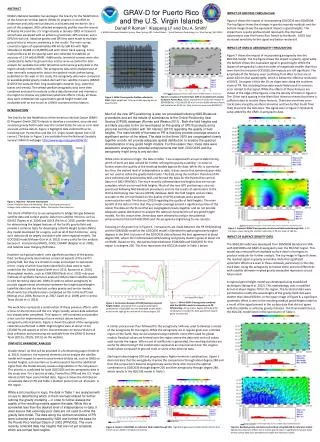
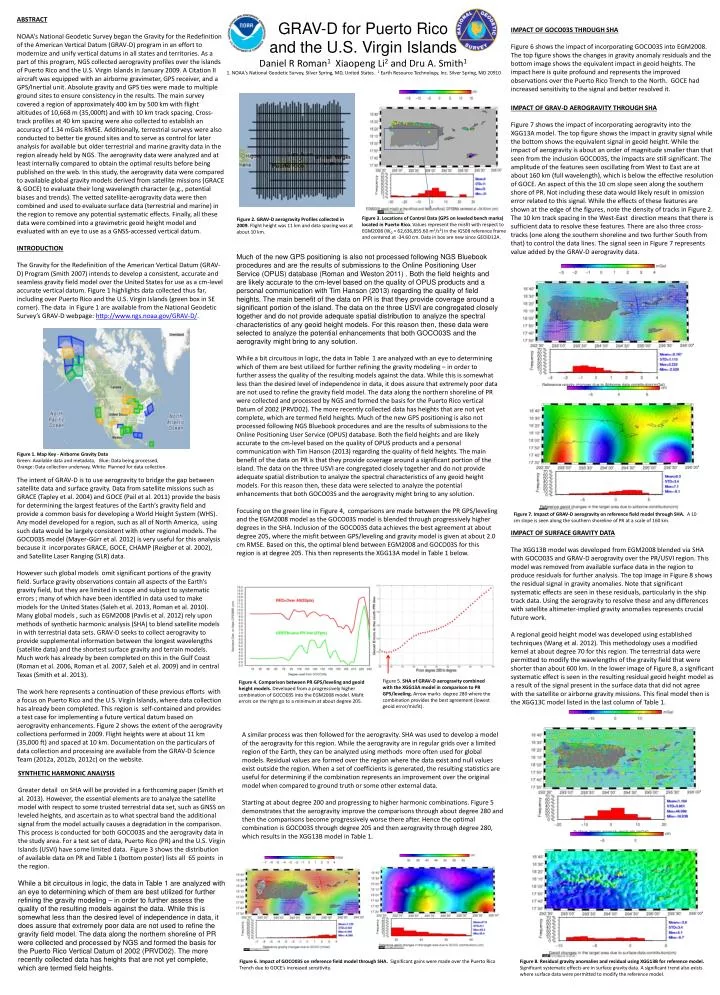
ABSTRACT NOAA’s National Geodetic Survey began the Gravity for the Redefinition of the American Vertical Datum (GRAV-D) program in an effort to modernize and unify vertical datums in all states and territories. As a part of this program, NGS collected aerogravity profiles over the islands of Puerto Rico and the U.S. Virgin Islands in January 2009. A Citation II aircraft was equipped with an airborne gravimeter, GPS receiver, and a GPS/Inertial unit. Absolute gravity and GPS ties were made to multiple ground sites to ensure consistency in the results. The main survey covered a region of approximately 400 km by 500 km with flight altitudes of 10,668 m (35,000ft) and with 10 km track spacing. Cross-track profiles at 40 km spacing were also collected to establish an accuracy of 1.34 mGals RMSE. Additionally, terrestrial surveys were also conducted to better tie ground sites and to serve as control for later analysis for available but older terrestrial and marine gravity data in the region already held by NGS. The aerogravity data were analyzed and at least internally compared to obtain the optimal results before being published on the web. In this study, the aerogravity data were compared to available global gravity models derived from satellite missions (GRACE & GOCE) to evaluate their long wavelength character (e.g., potential biases and trends). The vetted satellite-aerogravity data were then combined and used to evaluate surface data (terrestrial and marine) in the region to remove any potential systematic effects. Finally, all these data were combined into a gravimetric geoid height model and evaluated with an eye to use as a GNSS-accessed vertical datum. INTRODUCTION The Gravity for the Redefinition of the American Vertical Datum (GRAV-D) Program (Smith 2007) intends to develop a consistent, accurate and seamless gravity field model over the United States for use as a cm-level accurate vertical datum. Figure 1 highlights data collected thus far, including over Puerto Rico and the U.S. Virgin Islands (green box in SE corner). The data in Figure 1 are available from the National Geodetic Survey’s GRAV-D webpage: http://www.ngs.noaa.gov/GRAV-D/. IMPACT OF GOCO03S THROUGH SHA Figure 6 shows the impact of incorporating GOCO03S into EGM2008. The top figure shows the changes in gravity anomaly residuals and the bottom image shows the equivalent impact in geoid heights. The impact here is quite profound and represents the improved observations over the Puerto Rico Trench to the North. GOCE had increased sensitivity to the signal and better resolved it. GRAV-D for Puerto Rico and the U.S. Virgin Islands Daniel R Roman1XiaopengLi2 and Dru A. Smith1 1. NOAA's National Geodetic Survey, Silver Spring, MD, United States. 2 Earth Resource Technology, Inc. Silver Spring, MD 20910 IMPACT OF GRAV-D AEROGRAVITY THROUGH SHA Figure 7 shows the impact of incorporating aerogravity into the XGG13A model. The top figure shows the impact in gravity signal while the bottom shows the equivalent signal in geoid height. While the impact of aerogravity is about an order of magnitude smaller than that seen from the inclusion GOCO03S, the impacts are still significant. The amplitude of the features seen oscillating from West to East are at about 160 km (full wavelength), which is below the effective resolution of GOCE. An aspect of this the 10 cm slope seen along the southern shore of PR. Not including these data would likely result in omission error related to this signal. While the effects of these features are shown at the edge of the figures, note the density of tracks in Figure 2. The 10 km track spacing in the West-East direction means that there is sufficient data to resolve these features. There are also three cross-tracks (one along the southern shoreline and two further South from that) to control the data lines. The signal seen in Figure 7 represents value added by the GRAV-D aerogravity data. Figure 3. Locations of Control Data (GPS on leveled bench marks) located in Puerto Rico. Values represent the misfit with respect to EGM2008 (W0 = 62,636,855.60 m2/s2) in the IGS08 reference frame and centered at -34.60 cm. Data in box are new since GEOID12A. Figure 2. GRAV-D aerogravity Profiles collected in 2009. Flight height was 11 km and data spacing was at about 10 km. Much of the new GPS positioning is also not processed following NGS Bluebook procedures and are the results of submissions to the Online Positioning User Service (OPUS) database (Roman and Weston 2011) . Both the field heights and are likely accurate to the cm-level based on the quality of OPUS products and a personal communication with Tim Hanson (2013) regarding the quality of field heights. The main benefit of the data on PR is that they provide coverage around a significant portion of the island. The data on the three USVI are congregated closely together and do not provide adequate spatial distribution to analyze the spectral characteristics of any geoid height models. For this reason then, these data were selected to analyze the potential enhancements that both GOCO03S and the aerogravity might bring to any solution. While a bit circuitous in logic, the data in Table 1 are analyzed with an eye to determining which of them are best utilized for further refining the gravity modeling – in order to further assess the quality of the resulting models against the data. While this is somewhat less than the desired level of independence in data, it does assure that extremely poor data are not used to refine the gravity field model. The data along the northern shoreline of PR were collected and processed by NGS and formed the basis for the Puerto Rico vertical Datum of 2002 (PRVD02). The more recently collected data has heights that are not yet complete, which are termed field heights. Much of the new GPS positioning is also not processed following NGS Bluebook procedures and are the results of submissions to the Online Positioning User Service (OPUS) database. Both the field heights and are likely accurate to the cm-level based on the quality of OPUS products and a personal communication with Tim Hanson (2013) regarding the quality of field heights. The main benefit of the data on PR is that they provide coverage around a significant portion of the island. The data on the three USVI are congregated closely together and do not provide adequate spatial distribution to analyze the spectral characteristics of any geoid height models. For this reason then, these data were selected to analyze the potential enhancements that both GOCO03S and the aerogravity might bring to any solution. Focusing on the green line in Figure 4, comparisons are made between the PR GPS/leveling and the EGM2008 model as the GOCO03S model is blended through progressively higher degrees in the SHA. Inclusion of the GOCO03S data achieves the best agreement at about degree 205, where the misfit between GPS/leveling and gravity model is given at about 2.0 cm RMSE. Based on this, the optimal blend between EGM2008 and GOCO03S for this region is at degree 205. This then represents the XGG13A model in Table 1 below. Figure 1. Map Key - Airborne Gravity Data Green: Available data and metadata, Blue: Data being processed,Orange: Data collection underway, White: Planned for data collection. The intent of GRAV-D is to use aerogravity to bridge the gap between satellite data and surface gravity. Data from satellite missions such as GRACE (Tapley et al. 2004) and GOCE (Pail et al. 2011) provide the basis for determining the largest features of the Earth’s gravity field and provide a common basis for developing a World Height System (WHS). Any model developed for a region, such as all of North America, using such data would be largely consistent with other regional models. The GOCO03S model (Mayer-Gürret al. 2012) is very useful for this analysis because it incorporates GRACE, GOCE, CHAMP (Reigber et al. 2002), and Satellite Laser Ranging (SLR) data. However such global models omit significant portions of the gravity field. Surface gravity observations contain all aspects of the Earth’s gravity field, but they are limited in scope and subject to systematic errors ; many of which have been identified in data used to make models for the United States (Saleh et al. 2013, Roman et al. 2010). Many global models , such as EGM2008 (Pavlis et al. 2012) rely upon methods of synthetic harmonic analysis (SHA) to blend satellite models in with terrestrial data sets. GRAV-D seeks to collect aerogravity to provide supplemental information between the longest wavelengths (satellite data) and the shortest surface gravity and terrain models. Much work has already by been completed on this in the Gulf Coast (Roman et al. 2006, Roman et al. 2007, Saleh et al. 2009) and in central Texas (Smith et al. 2013). The work here represents a continuation of these previous efforts with a focus on Puerto Rico and the U.S. Virgin Islands, where data collection has already been completed. This region is self-contained and provides a test case for implementing a future vertical datum based on aerogravity enhancements. Figure 2 shows the extent of the aerogravity collections performed in 2009. Flight heights were at about 11 km (35,000 ft) and spaced at 10 km. Documentation on the particulars of data collection and processing are available from the GRAV-D Science Team (2012a, 2012b, 2012c) on the website. Figure 7. Impact of GRAV-D aerogravity on reference field model through SHA. A 10 cm slope is seen along the southern shoreline of PR at a scale of 160 km. IMPACT OF SURFACE GRAVITY DATA The XGG13B model was developed from EGM2008 blended via SHA with GOCO03S and GRAV-D aerogravity over the PR/USVI region. This model was removed from available surface data in the region to produce residuals for further analysis. The top image in Figure 8 shows the residual signal in gravity anomalies. Note that significant systematic effects are seen in these residuals, particularly in the ship track data. Using the aerogravity to resolve these and any differences with satellite altimeter-implied gravity anomalies represents crucial future work. A regional geoid height model was developed using established techniques (Wang et al. 2012). This methodology uses a modified kernel at about degree 70 for this region. The terrestrial data were permitted to modify the wavelengths of the gravity field that were shorter than about 600 km. In the lower image of Figure 8, a significant systematic effect is seen in the resulting residual geoid height model as a result of the signal present in the surface data that did not agree with the satellite or airborne gravity missions. This final model then is the XGG13C model listed in the last column of Table 1. Figure 5. SHA of GRAV-D aerogravity combined with the XGG13A model in comparison to PR GPS/leveling. Arrow marks degree 280 where the combination provides the best agreement (lowest geoid error/misfit). Figure 4. Comparison between PR GPS/leveling and geoid height models. Developed from a progressively higher combination of GOCO03S into the EGM2008 model. Misfit errors on the right go to a minimum at about degree 205. A similar process was then followed for the aerogravity. SHA was used to develop a model of the aerogravity for this region. While the aerogravity are in regular grids over a limited region of the Earth, they can be analyzed using methods more often used for global models. Residual values are formed over the region where the data exist and null values exist outside the region. When a set of coefficients is generated, the resulting statistics are useful for determining if the combination represents an improvement over the original model when compared to ground truth or some other external data. Starting at about degree 200 and progressing to higher harmonic combinations. Figure 5 demonstrates that the aerogravity improve the comparisons through about degree 280 and then the comparisons become progressively worse there after. Hence the optimal combination is GOCO03S through degree 205 and then aerogravity through degree 280, which results in the XGG13B model in Table 1. SYNTHETIC HARMONIC ANALYSIS Greater detail on SHA will be provided in a forthcoming paper (Smith et al. 2013). However, the essential elements are to analyze the satellite model with respect to some trusted terrestrial data set, such as GNSS on leveled heights, and ascertain as to what spectral band the additional signal from the model actually causes a degradation in the comparison. This process is conducted for both GOCO03S and the aerogravity data in the study area. For a test set of data, Puerto Rico (PR) and the U.S. Virgin Islands (USVI) have some limited data. Figure 3 shows the distribution of available data on PR and Table 1 (bottom poster) lists all 65 points in the region. While a bit circuitous in logic, the data in Table 1 are analyzed with an eye to determining which of them are best utilized for further refining the gravity modeling – in order to further assess the quality of the resulting models against the data. While this is somewhat less than the desired level of independence in data, it does assure that extremely poor data are not used to refine the gravity field model. The data along the northern shoreline of PR were collected and processed by NGS and formed the basis for the Puerto Rico Vertical Datum of 2002 (PRVD02). The more recently collected data has heights that are not yet complete, which are termed field heights. Figure 6. Impact of GOCO03S on reference field model through SHA. Significant gains were made over the Puerto Rico Trench due to GOCE’s increased sensitivity. Figure 8. Residual gravity anomalies and residual using XGG13B for reference model. Significant systematic effects are in surface gravity data. A significant trend also exists where surface data were permitted to modify the reference model.
OUTLOOK A great deal of interest has been expressed in developing such a model for at least the region of North America (Smith et al. 2012, Jacob et al. 2012). Such a model should be a subset or at least easily tied into a World Height System. Collections by satellite systems remains the likely avenue for WHS unification. However, they are insufficient to resolve systematic errors due omission or commission in terrestrial data. This paper has explored the potential for using aerogravity to refine and improve the local gravity field and subsequent geoid height model. Future work will include incorporating data flown at 1.67 km (5000 ft), cleaning the surface data, changing the blending ranges in SHA, and adjusting the degree used in the kernel modification. With little data improvement, the model determined here meets or exceeds all others. With further work, it should achieve the desired goal of cm-level accuracy. ANALYSIS All models are compared to the 65 GPS/leveling points available in the region. Refer to the Table 1 legend for details as to how the Table is organized. However, the first 44 stations were those used to develop the Synthetic Harmonic Analysis that developed the subject models. While the individual stations are useful to isolate potential outliers, the summary statistics by region and by geoid model provide the most succinct insight. Those GPS/leveling points on PR represent the best spatial distribution of data on a single common datum. All points in the USVI are tied to the Virgin Islands Vertical Datum of 2009 (VIVD09) and in fact each island has it’s own tide gauge and, therefore, own datum. Rather than deal with such disparity, the focus is on those points on PR. There at the bottom below Table 1 in bold are the summary statistics for all points (in the database, new, and OPUS-derived), where a steady improvement is seen going to models that incorporate all signal. SUMMARY GPS/leveling data, particularly that available on the island of Puerto Rico, were used to develop optimal filters for Synthetic Harmonic Analysis. Filters for combing GOCO03S at degree 205 and aerogravity through degree 280 were implemented on the EGM2008 model to generate a revised reference model (XGG13B). This model was used to a more traditional approach to regional geoid modeling and compared against all GPS/leveling points. Naturally, the comparison was best at the points on PR since it was used in determining the filters. However, these filters were against data that had significant (for this region) spatial extents and could optimally determine the local gravity field at intermediate to long wavelengths. The most optimal combination came from using all available information to develop regional geoid height model. Table 1. GPS/Leveling data in the Puerto Rico (PR) and the U.S. Virgin Islands (USVI) versus various geoid height models. There are a total of 65 bench marks on the islands: 44 total points on PR and 21 on the USVI. Of the 44 on PR: 36 points have fully adjusted ellipsoid and orthometric heights and were used to make the GEOID12A model; 2 are new points with adjusted ellipsoid heights but only Field quality leveling heights; and 6 more have ellipsoid heights from resolved through OPUS and Field heights. All 21 points in the USVI are fully adjusted and were available for GEOID12A though three were dropped (text in red for St. Croix) due to high residual values. These data sets are compared in the above groups and collectively at the bottom of the Table to: GEOID12A, USGG2012, EGM2008, XGG13A, XGG13B, and XGG13C. Coordinates for NAD 83 were used for GEOID12A, while all others were given in the IGS08 reference frame using a GRS-80 ellipsoid. For each comparison: the geoid height for the respective model at that location is in the first column; the difference between the ellipsoid height and orthometric height (h-H) and the geoid height (N) is given in the middle column; and the third column removes the average for the subset region to show the distribution of points around the regional mean. No stats are available for St. John since there was only one point. Overall, GEOID12A does very well, but these data were used to make it. It does poorer in regions where new data are added. The best comparison data remains all the aggregate GPS/leveling for PR as this forms a loop with significant spatial extent. Those statistics are highlighted in bold at the bottom of Table 1. USGG2012 does slightly better than EGM2008 but this is expected because USGG2012 has higher resolution information. Adding in GOCO03S (XGG13A) helped improve EGM2008 significantly. Adding in aerogravity (XGG13B) further refined the solution and inclusion of the terrestrial data yielded the best result. Clearly adding in the aerogravity along with GOCO03Shelped the solution. Additionally, the most optimal results come from use of surface data, so this cannot just be rejected or ignored in future models (i.e., aerogravity by itself is not the optimal solution). References GRAV-D Science Team (2012a). GRAV-D General Airborne Gravity Data User Manual, Theresa Damiani, ed., v. 1, Available 10 May 2013, www.ngs.noaa.gov/GRAV-D/data_TS01.shtml GRAV-D Science Team (2012b). "Gravity for the Redefinition of the American Vertical Datum (GRAV-D) Project, Airborne Gravity Data; Block TS01". Available 10 May 2013. Online at: http://www.ngs.noaa.gov/GRAV-D/data_TS01.shtml GRAV-D Science Team (2012c). "Block TS01 (Atlantic South 01); GRAV-D Airborne Gravity Data User Manual." Monica A. Youngman and Carly A. Weil, ed. Version 1. Available: 10 May 2013. Online at: http://www.ngs.noaa.gov/GRAV-D/data_TS01.shtml Jacob T, J Wahr, R Gross, and S Swenson (2012) estimating geoid height change in North America: past, present and future, J. Geodesy, 86 (5), 337-358, DOI: 10.1007/s00190-011-0522-7. Mayer-Gürr T, D Rieser, E. Hoeck, JM Brockman, W-D Schuh, I Krasbutter, J Kusche, A Maier, S Krauss, W Hausleitner, O Baur, A Jaeggi, U Meyer, L Prange, R Pail, T Fecher, and T Gruber. (2012) The new combined satellite only model GOCO03S. Paper S2-183, GGHS Meeting in Venice, Italy 9-12 OCT 2012. Pail R, S Bruinsma, F Migliaccio, C Foerste, H Goiginger, W-D Schuh, E Höck, M Reguzzoni, JM Brockmann, O Abrikosov, M Veicherts, T Fecher, R Mayrhofer, I Krasbutter, F Sansò, CC Tscherning (2011) First GOCE gravity field models derived by three different approaches, J. Geodesy, 85 (11), 819-843, DOI: 10.1007/s00190-011-0467-x. Pavlis, NK, SA Holmes, SC Kenyon, and JK Factor (2012) The development and evaluation of the Earth Gravitational Model 2008 (EGM2008), JGR, 117 (B4), Article Number: B04406, DOI: 10.1029/2011JB008916. Reigber, Ch., Balmino, G., Schwintzer, P., Biancale, R., Bode, A., Lemoine, J.-M., Koenig, R., Loyer, S., Neumayer, H., Marty,J.-C., Barthelmes, F., Perosanz, F. and Zhu, S. Y. (2002). A high quality global gravity field model from CHAMP GPS tracking data and Accelerometry (EIGEN-1S),Geophysical Research Letters, 29(14), 10.1029/2002GL015064. Roman DR, YM Wang, JM Brozena, VA Childers, DL Rabine, SB Lutcke, J Blair, SA Martinka, MA Hofton (2006) Gravity-Lidar Study for 2006: Refined Gravity Field for the North-Central Gulf of Mexico, Proceedings of the 1st International Symposium of the International Gravity Field Service, Istanbul, Turkey, available at: http://www.hgk.msb.gov.tr/dergi/makaleler/18ozelsayi.asp. Roman D.R., and N.D. Weston (2011). OPUS-Database: Supplemental Data for Better Datum Conversion Models, presented at the F.I.G Working Week in Marrakech, Morocco, May 18-22, 2011, http://www.fig.net/pub/fig2011/papers/ts04a/ts04a_roman_weston_4860.pdf. Roman DR, YM Wang, JM Brozena, VA Childers, DL Rabine, SB Lutcke, SA Martinka, and MA Hofton (2007) Regional Geoid Modeling Compared to Ocean Surface Observations, Eos Trans. AGU, 88(23), Jt. Assem. Suppl., Abstract G33B-04. Roman DR, D Winester, and J Saleh (2010) Surface gravity observations define gravity field change over 30 years, Abstract G41A-0789 presented at 2010 Fall Meeting, AGU, San Francisco, Calif., 13-17 Dec. Saleh J, X Li, YM Wang, DR Roman, and DA Smith (2013) Error analysis of the NGS’ surface gravity database, J. Geodesy, 87 (3), 203-221, DOI 10.1007/s00190-012-0589-9 Saleh J, YM Wang, DR Roman, X Li (2009) Validation and inter-comparison of GRAV-D airborne gravity anomalies at three flight altitudes over the coast of Western Florida and Alabama, Eos Trans. AGU, 90 (52), Fall Meet. Suppl., Abstract G51A-0651. Smith DA (2007) The GRAV-D project: gravity for the redefinition of the American Vertical Datum. Available online at: http://www.ngs.noaa.gov/GRAV-D/pubs/GRAV-D_v2007_12_19.pdf Smith DA, M Véronneau, DR Roman, J Huang, YM Wang, and MG Sideris (2012) Towards the Unification of the Vertical Datum Over the North American Continent. Chapter 36 in: Z. Altamimi and X. Collilieux (eds.), Reference Frames for Applications in Geosciences, International Association of Geodesy Symposia 138, Springer-Verlag Heidelberg , DOI 10./1007/978-3-642-32998-2_36 Smith D, S Holmes, X Li, S Guillaume, Y Wang, B Bürki, and D Roman (2013) Confirming Regional 1 cm Differential Geoid Accuracy from Airborne Gravimetry: The Geoid Slope Validation Survey of 2011, J. Geodesy, submitted. Tapley BD, S Bettadpur, M Watkins, and C Reigber (2004) The gravity recovery and climate experiment: Mission overview and early results. Geophysical Research Letters, 31 (9), L09607, DOI: 10.1029/2004GL019920 Wang, Y.M., J Saleh, X. Li, and D.R. Roman (2012). The US Gravimetric Geoid of 2009 (USGG2009): model development and evaluation, J. Geod., 86, 165-180, DOI 10.1007/s00190-011-0506-7