Download
1 / 15
150 likes | 275 Vues
FOOD SYSTEM VULNERABILITY AND ADAPTIVE CAPACITY ENHANCING OPTIONS VAISHALI DISTRICT, BIHAR (SITE-4) 7 th Feb, 2009 at New Delhi. Gyaneshwar Singh Gorakhpur Environmental Action Group, Bihar Email: geag2@sancharnet.in and paramgsingh@gmail.com Website: www.geagindia.org.

E N D
FOOD SYSTEM VULNERABILITYANDADAPTIVE CAPACITY ENHANCING OPTIONSVAISHALI DISTRICT, BIHAR (SITE-4)7th Feb, 2009 at New Delhi Gyaneshwar Singh Gorakhpur Environmental Action Group, Bihar Email: geag2@sancharnet.in and paramgsingh@gmail.com Website: www.geagindia.org
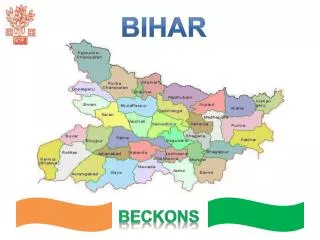
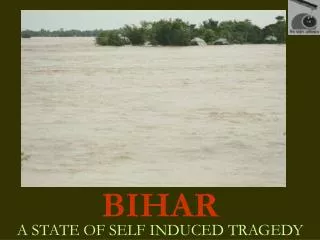
Profile of Vaishali District Geo-Graphical: • Locked By Mountains and Hills of the Himalayas and Plateau of Jharkhand • Surrounded by River Ganga in South and Gandak in West. • Topograhy- Chaur ( Low Land Area) • Annual Rainfall -1121 mm. • Drought and Flood Prone Area • Local Climate & Soil Type Favorable for Rice, Wheat & Maize - Major Cereals
Socio-Economic • Population: 94 % Rural and 6% Urban • 90% Population have Agriculture as Primary Income and 64% Population have Migration as Secondary Income • Per Capital Income = Rs. 3830 is 13% of National Average (in 2006-2007) • 63% Population Suffering From Poverty • 80% of Population Suffering From Malnutrition
Agricultural • 90% of Population dependent on agriculture • Small and Scattered Land (Above 90% with 0.37 hectare) • 40% agricultural land is unused • 65% area is occupied by local varieties • 67% area is irrigated • 37% area is sown more than once • 2 % Agricultural growth rate (45% of average Bihar Ag growth rate)
FOOD SYSTEM & DETERMINANTS: a. Food Availability Outcome
Climatic Variability - Water Stresses • Uncertain, Unequal and Abrupt Rainfall (e.g. onset in 2005 & 2006: Mid of Jeth; in 2007: 3rd Week of Baishakh; in 2008: Ist Week of Baishakh) • Increase of Soil and Air Temperature in last 10 yrs (based on farmers’ perception of irrigation demand) • Decreasing Trend of Rainfall In Last 33 Years (1974 to 2007 – Met Office stats) • Flooding (With Water Logging) & Drought both Common • Severity Trend of Water Stresses- Initially Flood with Water Logging- then drought- then Flood With Prolonged Water (in 2007 and 2008) (Farmer’ Perceptions)
Households’ Perceptions of Their Own Food Security Vulnerability to Water Stresses Grounds of Classification: Land Holding, Agricultural Production, Economic Status & Wealth, Affordability, Diversified Source Of Income, Remittances, Storage Facilities, Control Over Production, Food Availability, Access And Reach To Government Schemes Etc. ( Data Taken in June,07)
Urgent Demand of Farming Community Towards Adaptation • Timely Availability of Quality Inputs • Drought & Flood Resistant High Yielding Crop Varieties • Irrigation Facilities • Information on Modern Techniques ( Crop and Equipments ) • Ease Credit Schemes • Alternate Options of Chemical and High Cost of Inputs • Additional Livelihood Options • Government Schemes ( Like NREGA, PDS)
Adaptation Response Priority F.S. OUTCOMES Food Availability ACTORS ACTIVITIES Production Distribution Production( Increase Crop Diversification, Intensification ) Government Machineries Exchange Food Access Processing & Packaging ( Better Storage ) Private Sector (Ex: Market, Affordability Allocation Distribution & Retail (Improve Road, Transportation ) Preferences Civil Society Organization Food Utilization Resource Manager ( Farmers) Consumption ( Safe drinking water facilities ) Nutritional Value Social Value Food Safety