STRATIGRAPHIC SEQUENCES IN THE CAROLINA COASTAL PLAIN DELINEATED FROM WELL DATA
STRATIGRAPHIC SEQUENCES IN THE CAROLINA COASTAL PLAIN DELINEATED FROM WELL DATA. Rick Diecchio George Mason University. OBJECTIVES. Visualization in 4-dimensions Comparison of stratigraphy with respect to thickness and time Recognition of stratigraphic information on a geologic map.

STRATIGRAPHIC SEQUENCES IN THE CAROLINA COASTAL PLAIN DELINEATED FROM WELL DATA
E N D
Presentation Transcript
STRATIGRAPHIC SEQUENCES IN THE CAROLINA COASTAL PLAIN DELINEATED FROM WELL DATA Rick Diecchio George Mason University
OBJECTIVES • Visualization in 4-dimensions • Comparison of stratigraphy with respect to thickness and time • Recognition of stratigraphic information on a geologic map
Plio-Pleistocene --------------------------------------- 5 mya Miocene --------------------------------------- 24 mya Oligocene --------------------------------------- 37 mya Upper Eocene --------------------------------------- 46 mya Lower Eocene --------------------------------------- 58 mya Paleocene --------------------------------------- 66 mya upper Upper Cretaceous --------------------------------------- 77 mya middle Upper Cretaceous --------------------------------------- 88 mya lower Upper Cretaceous --------------------------------------- 98 mya Lower Cretaceous --------------------------------------- 144 mya Jurassic time-rock units
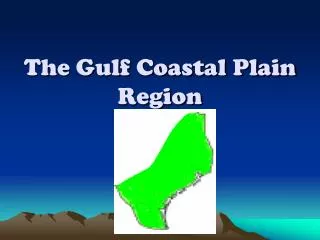
location of wells P-2 OT-13 OT-10
Well dataelevation of unit tops P-2 Miocene +95 l U Cretaceous +65 Lower Cretaceous +15 basement -55 OT-13 Miocene +16 Upper Eocene -146 Paleocene -466 u U Cretaceous -494 m U Cretaceous -604 l U Cretaceous -964 Lower Cretaceous -1414 basement -1964 OT-10 Hatteras Well Plio-Pleistocene +9 Miocene -160 Oligocene -1360 Upper Eocene -1715 Lower Eocene -2360 Paleocene -2690 u U Cretaceous -2845 m U Cretaceous -3015 l U Cretaceous -4035 Lower Cretaceous -4975 Jurassic -9145 basement -9853 All are time-rock units
P-2 OT-13 OT-10 Cross section Y-axis = elevation Plot the wells and correlate unconformities comformable contacts
Correlation diagram Vertical axis = time Must be consistent with cross-section
The visualization part Compare the differences with 2 different vertical axes
The visualization thing: Recognition of sequences and unconformities on the geologic map