Download
1 / 13
130 likes | 246 Vues
Emission of a Macroscopic Plasma Display Panel Cell (Xe-Ne Mixtures), and Role of Photoemission. R. Ganter , J. Ouyang, Th. Callegari, Ph. Guillot, J. Galy, and J.P. Boeuf. Centre de Physique des Plasmas et Applications de Toulouse , CNRS

E N D
Emission of a Macroscopic Plasma Display Panel Cell (Xe-Ne Mixtures), and Role of Photoemission R. Ganter, J. Ouyang, Th. Callegari, Ph. Guillot, J. Galy, and J.P. Boeuf Centre de Physique des Plasmas et Applications de Toulouse, CNRS Université P. Sabatier, 118 Route de Narbonne, 31062 Toulouse France http://cpat.ups-tlse.fr
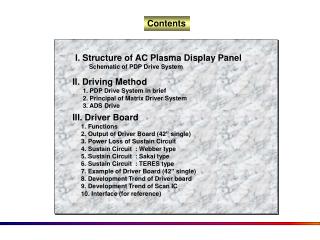
Principle of plasma display panel • One pixel of the Plasma display panel has three subpixels: Red, Green and Blue (R.G.B). • Each subpixel include an address electrode on one substrate and two sustain electrodes on an opposed substrate. • Electrodes are covered by dielectric layers (pulsed discharge). • The purpose of the discharge (Xe-Ne) is to produce U.V. photons which will be convert into visible light by the phosphors (R,G,B). Adress el. Ne-Xe(2-10%), Gap 100µm, 300-500torr, 200V AC, 100kHz X Y Barrier Viewer ZOOM Dielectric layers Electrode X Electrode Y Visible Visible MgO Glass Dalle de verre U.V. Gas Luminophores Address electrode Glass Discharge
Adress and sustain discharge in a cell Address pulse X Y • A voltage pulse is applied to the address electrode which creates a discharge between a sustain electrode (X or Y) and the address electrode. • This first address discharge induce a wall voltage at the coplanar sustain electrode. • The sustain signal (square wave voltage) applied to both coplanar electrodes (X, Y) creates a « ping pong » action of the wall charge states. Address Discharge Address electrode X Sustain Discharge Y
Ne Ne - - Xe Xe Macro-cell and UV source Use of scaling laws: dimensions x 62.5, pressure /62.5 with respect to real PDP cell ICCD ICCD quartz quartz Xe-Ne mixtures P~5.6torr viewport viewport Discharge gap 12 cm 12 cm electrodes 20 cm 20 cm 2cm quartz viewport 20 cm 20 cm 20 cm 20 cm Glass + MgO 22 cm Stainless Stainless steel steel chamber chamber MgF2 window
CCD Imaging of the Macro-Cell discharge With a CCD camera we made movies of the discharge in the gas gap (side view) and also trough transparent electrodes (front view). Conditions in Macrocell: Ne-Xe:10%, 5.6torr , dielectric barrier of 1mm, =4 covered with 500 nm of MgO Front viewport Side viewport Macrocell (microcell) 1 cm Ceramic Glass 0.5 cm 9 cm 2 cm ICCD on the side view Sustain Electrodes CCD : >25ns gated, integrated on ~3000 period of the sustain voltage of the cell Address Electrodes 1 mm Side view front view
Spatio-temporal evolution of a discharge through a filter : 815-825nm (Xenon emission) Front view Side view Ne-Xe:10%, 5.6torr, coplanar gap 0.5cm, 190V, 100Hz, CCD: 200ns gated on 3000 cycles
Spatio-temporal evolution of a discharge through a filter : 635-645nm (Neon emission) Front view Side view Ne-Xe:10%, 5.6torr, coplanar gap 0.5cm, 190V, 100Hz, CCD: 200ns gated on 3000 cycles
Time evolution of discharge emission along an axis There are no emission of neon above the anode, the anode field is more efficient for xenon excitation! Anode striations 12km/s Ne Emission 635-645 nm Xe Emission 815-825 nm Ne-Xe:10%, 5.6torr, 0.5cm coplanar gap, 190V, 100Hz, CCD: 200ns gated on 3000 cycles
Photoemission and scaling laws Discharge of plasma display panel cell and macrocell discharge are similar (same dimension multiplied by pressure)! However, there are processes which do not follow the scaling law, for example the photoémission by resonant photons at 147nm from xenon on the cathode surface: Apparent lifetime of resonant photons (Holstein’s theory): app. proportional to d1/2(d dimension of the cell) Time for ions to reach the cathode: ions proportional to d(for similar discharges) (vions= p.d / p.t) In microcell: 147nm~330ns and current rise time ~ 50ns In macrocell: 147nm~2.6µs and current rise time ~ 3µs (scaling factor 62.5) Photoemission is less probable in real plasma display panel cell!
Comparisons with models: current Displacement current peak: 2D Model with photoemission Macrocell 2D Model without photoemission Charge current peak Apparition of a displacement current peak in the macrocell, because plasma expansion is very fast with photoemission! Ne-Xe:10%, 5.6torr, 0.5cm coplanar gap, 240V, 100Hz
Comparisons with models: negative glow Macrocell Model 2D with photoemission Model 2D without photoemission Photoelectrons are produce over all the cathode surface (in contrary of ions they don’t follow the electric field), that’s why negative glow is more larger with photoemission. Ne-Xe:10%, 5.6torr, 0.5cm coplanar gap, 190V, 100Hz
Comparisons with models: plasma expansion velocity Time evolution of the positions of the maximum infrared xenon emission above intensity above cathode and anode from the measurements and the simulations (with and without photoemission included in the model) ~12km/s ~15km/s ~2km/s Photons at 147nm increase the plasma expansion velocity (sheath contraction)! Ne-Xe:10%, 5.6torr, 0.5cm coplanar gap, 190V, 100Hz (model and experiment)
Conclusion One problem for Plasma Display Panel is the low efficiency of the discharge in producing VUV photons (less than 10% of the electrical power is converted in VUV) ICCD imaging shows that the anode region is more efficient than the cathode region for Xe excitation (electron energy too large in the cathode sheath -> neon excitation) • Look for conditions (geometry, discharge excitation) where electrons spreading over the anode can be increased and optimized The macrocell reproduce well qualitatively the discharge of real cell (striations, no neon emission above anode, …) however there are some differences (two current peaks, high plasma expansion velocity, …) Comparisons with a 2D model help us to understand these differences: The faster plasma expansion in the macrocell is due to photoemission of resonant photons at 147nm of xenon on MgO surface. The photoemission effect is less important in real PDP cell because resonant photon transport does not follow the similarity laws.