Dimensions of Evaluation
Dimensions of Evaluation. Robert M. Hayes 2006. Introduction.

Dimensions of Evaluation
E N D
Presentation Transcript
Dimensions of Evaluation Robert M. Hayes 2006
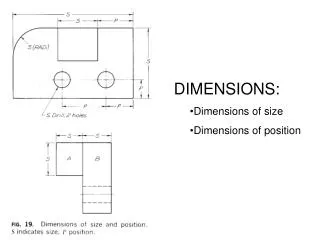
Introduction • I ask you to recall the earlier discussion of “Utilities” and “Social Choice” and, in particular, my comments on the issue of “transitivity” in evaluations of utility. In doing so, I identified the role of what I called “dimensions” in such evaluations with specific focus on their effects on transitivity. • In this presentation, I want to examine more thoroughly that role and illustrate it in a rather broad array of contexts, extending beyond libraries but including them. In doing so, my objective is not to force you to deal with those broader contexts (unless, of course, you wish to do so in your own curiosity) but so that you can see that the issues in evaluation of libraries are generic ones. • Among the dimensions are those that we tend to view as related to “benefits” or, in some contexts, “effectiveness”. • In sharp contrast are the dimensions that we tend to identify as related to “costs”. • In many contexts of evaluation, these two sets of dimensions are combined into a measure called “cost/benefit” or “cost/effectiveness”.
The Contexts • The contexts that I will briefly discuss in this presentation are: • Strategic Management using the Balanced Scorecard Approach • In Business, • In Non-Profit Organizations, • In Government, and • In Libraries • Political Decision-Making • Key Indicators • Contingent Valuation • Data Envelopment Analysis • Cost and Effective Factors • Implied Weights for Maximization • Resulting Comparative Rankings
The Balanced Scorecard Approach • The Balanced Scorecard (BSC) is an approach to evaluation in management and especially in strategic management for organizations of every kind, including libraries. • The name refers to the need to balance the purely financial emphasis that most businesses use in their decision-making with a variety of other perspectives, typically arriving at the following: • The Financial Perspective • The Customer Perspective • The Internal Process Perspective • The Employee Perspective • The Learning and Growth Perspective • In specific applications, some of those might be combined or others might be added.
For each perspective, the Balanced Scorecard Approach entails a sequence of four steps: • Identify objectives for the perspective • Establish one of more measures for each objective • Set targets for level of performance or improvement for each measure • Determine initiatives or key actions needed to achieve the targets • The management of this process then becomes a means for focusing the attention and efforts of the management of an organization on both the process and the objectives of the process.
On the surface of it, this all makes eminent sense, to the point that one might wonder, “So what? Isn’t that all self-evident?” • And, indeed it does make sense and is self-evident. • But the approach has had significant effects and is repeatedly referred to, in many quite different contexts, as a necessary approach to evaluation in management and, especially, in strategic management. • Perhaps the most important point that it makes is that, even for profit-oriented businesses, the financial “bottom-line” is not and should not be the only criterion for management decision-making, at all levels, whether operational, tactical, or strategic.
Is BSC applicable to Libraries? • In some respects, libraries already embody the major rationale for the BSC since they have always included perspectives beyond the mere financial one in their process of evaluation. Libraries are highly oriented to the needs of their users. They are highly efficient in their internal operations. They are very aware of the needs of their employees. They are very oriented to learning and growth. • Having said that, though, a primary focus of the BSC is that on establishing measures for the objectives of the organization. That represents a significant addition to the approach typically taken by library managers. • It is for this reason that I bring it to your attention in the context of evaluation.
In this presentation, I am not going to say more about the Balanced Scorecard Approach (BSC), since I want to summarize some other approaches in evaluation. However, later there will be a series of presentations that will, first, provide more details about BSC and, second, show the range of organizations in which it has been applied: • Overview of the BSC Development Process • BSC Business Applications • BSC in Public and Non-Profit Organizations • BSC University Applications • BSC in Federal Government Applications • BSC in Government Contractor Application (specifically as represented by the Malcolm Baldrige Awards)
Political Decision-Making • The role of evaluation in political decision-making is far more complex than it is in contexts that are not overtly political. (I phrase it that way because virtually any decision-making context, at one time or another, is likely to become political.) • The complications arise in many ways but especially in identifying what is to be evaluated. All too frequently the choice of what is evaluated pre-determines what the result of the political process will be. • In the discussion of means for arriving at “social choice”, the several problems with means for voting were identified. And the several possible measures of utility, each with its own impact on society, were identified. • The objective in doing so was to highlight the difficulties involved in evaluating even when there is agreement on what is to be evaluated. • But getting agreement on WHAT is to be evaluated is even more fraught with difficulties!
Key Indicators • One approach to resolution of the choice of what is to be evaluated is the identification of what are called “key indicators”, that is a set of things to be evaluated that have been identified a priori as necessary in political decision-making or, more generally, in any context of decision-making. Beyond being identified a priori it is also important that they be identified by an essentially non-political process. • I am not in this presentation going to go into details about how key indicators have been and may in the future be developed. But, in a later presentation, I will describe the Report of the GAO (General Accounting Office) of the federal government and recommendations it makes in this respect.
Contingent Valuation • Another approach to evaluation, called contingent valuation, tries to supplement key indicators with results from surveys. It tends to place special emphasis on factors in evaluation for which objective quantitative measures are difficult or even impossible to obtain. In such cases, the views of persons may become important. • It is important to recognize ALL of the problems I have identified in attempting to combine individual assessments into a social assessment. But, the use of survey at least provides additional input into the process. • Again, I am not going to say more in this presentation about contingent evaluation, but there will be a later one in which I will do so.
Data Envelopment Analysis • The final approach to evaluation that I want briefly to describe is called Data Envelopment Analysis (DEA). It was developed by Abraham Charnes, an internationally renowned authority in developing new and advanced mathematical methods used for management problem solving in government, industry, engineering, and medicine. • The problem with which DEA is concerned is that utility functions, as the basis for evaluation by different individuals or organizations, may bear no relationship to each other and it is therefore difficult to make comparisons from one decision context to another. Indeed, not only may it not be possible to compare two different decision-makers but it may not be possible to compare the utility functions of a single decision-maker from one context to another.
A traditional way to combine variables in a utility function is to use a cost/effectiveness ratio, called an "efficiency" measure. It measures utility by the "cost per unit produced". On the surface, that would appear to make comparison between two contexts possible by comparing the two cost/effectiveness ratios. The problem, though, is that two different decision-makers may place different emphases on the two variables. • It also must be recognized that effectiveness will usually entail consideration of a number of products and services and costs a number of sources of costs. Cost/effectiveness measurement requires combining the sources of cost into a single measure of cost and the products and services into a single measure of effectiveness. • Again, the problem of different emphases of importance must be recognized. This is especially the case for the several measures of effectiveness. But it may also be the case with the several measures of costs, since some costs may be regarded as more important than others even though they may all be measured in dollars. When some costs cannot be measured in dollars, the problem is compounded.
This issue can be illustrated by evaluating library performance. Effectiveness here is the extent to which library services meet the expectations or goals set by the organization served. It is likely to be measured by several services which are the outputs of library operations—making a collection available for use, circulation or other uses of materials, answering of information questions, instructing and consulting. • Inputs are represented by acquisitions, staff, and space, to which evident costs can be assigned, but they are also represented by measures of the populations served. • Efficiency measures the library’s ability to transform its inputs (resources and demands) into production of outputs (services). The objective in doing so is to optimize the balance between the level of outputs and the level of inputs. The success of the library, like that of other organizations, depends on its ability to behave both effectively and efficiently. • The issue at hand, then is how to combine the several measures of input and output into a single measure of efficiency.
Data Envelopment Analysis • Data Envelopment Analysis (DEA) measures the relative efficiencies of organizations with multiple inputs and multiple outputs. The organizations are called the decision-making units, or DMUs. • DEA assigns weights to the inputs and outputs of a DMU that give it the best possible efficiency. It thus arrives at a weighting of the relative importance of the input and output variables that reflects the emphasis that appears to have been placed on them for that particular DMU. • At the same time, though, DEA then gives all the other DMUs the same weights and compares the resulting efficiencies with that for the DMU of focus.
Data Envelopment Analysis • Data Envelopment Analysis (DEA) measures the relative efficiencies of organizations with multiple inputs and multiple outputs. The organizations are called the decision-making units, or DMUs. • DEA assigns weights to the inputs and outputs of a DMU that give it the best possible efficiency. It thus arrives at a weighting of the relative importance of the input and output variables that reflects the emphasis that appears to have been placed on them for that particular DMU. • At the same time, though, DEA then gives all the other DMUs the same weights and compares the resulting efficiencies with that for the DMU of focus.
If the focus DMU looks at least as good as any other DMU, it receives a maximum efficiency score. But if some other DMU looks better than the focus DMU, the weights having been calculated to be most favorable to the focus DMU, then it will receive an efficiency score less than maximum. • The result is a means for comparing DMUs (e.g., libraries) based on what they actually do with their resources. • I am not going to go further in this presentation in describing DEA or it applications to libraries, leaving that for another presentation: • Data Envelopment Analysis