Download
1 / 13
130 likes | 256 Vues
Potential for soil carbon sink enhancement in 3 northern Great Plains states. Karen Updegraff Patrick R. Zimmerman Donna Kliche Rick Clawges William J. Capehart Patrick Kozak Maribeth Price. Big Sky Regional Partnership: MT, SD, ID. Phase I assessment of terrestrial potential

E N D
Potential for soil carbon sink enhancement in 3 northern Great Plains states. Karen Updegraff Patrick R. Zimmerman Donna Kliche Rick Clawges William J. Capehart Patrick Kozak Maribeth Price
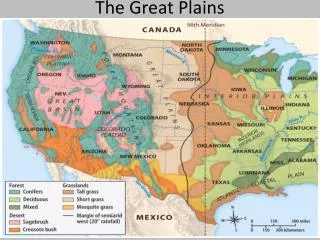
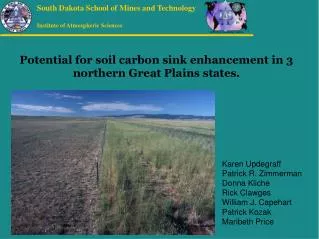
Big Sky Regional Partnership: MT, SD, ID • Phase I assessment of terrestrial potential • Modeled using CENTURY, GIS • Agriculture is currently a net C sink • MT has greatest land base but SD has most cropland • No-till in SD offers most potential Current:
Climate data • National Climatic Data Center (NCDC) monthly average precip, min/max temperature since 1895 by station and climate division.
Generation of soil texture grids • SSURGO/STATSGO map unit data extracted into sand/silt/clay % grids. Bulk density from texture • ENVI processing to generate soil classes • Distributed soil classes within counties
Historical and current agricultural management: I • Historical data from extension survey (SD), NASS crop databases, Census of Agriculture, anecdotal sources (types of crops, fertilizer use, irrigation) • Conservation tillage and CRP data for 2002 from CTIC. No-till = ZERO tillage • For point simulations, represent spatial proportions of crops as temporal series • 6 timeblocks: 1900-35, 1936-45, 1946-65, 1966-82, 1983-89, 1990- • Assume grassland for baseline period
Historical and current agricultural management: II • Assume no fertilizer before 1965 • Assume no irrigation unless >50% of crop was irrigated • Scenarios • ct2ct: continuous conventional tillage since 1900 • ct2nt: conventional, change to no-till in 1990 • ct2crp: conventional, change to CRP in 1990 • grz2grz: continuous grazing since 1990 • grz2crp: removal of grazing in 1990
Historical and current agricultural management III • No public lands in simulation • Runs to 2030 (stochastic weather after 2003) • For each state: • 8-10 climate divisions • 17-19 soil classes • 5 scenarios = up to 900 separate simulations • Distribute results over county/soil class cells, sum for county-level output m2 applicable per county
Results: Land use distribution km2 in each land use: Grazing/Pasture Grazing/Pasture Cropland - CT
C, Mg ha-1 yr-1 Carbon stock changes since 1990 Variability in annual C, Montana
State-level C stock trends +25% NT Default
Cheyenne River Sioux Reservation Pilot Trade ≥ 62,000 MTCE/5yrs
Support provided by: DOE Regional Carbon Sequestration Partnerships