Download
1 / 35
350 likes | 553 Vues
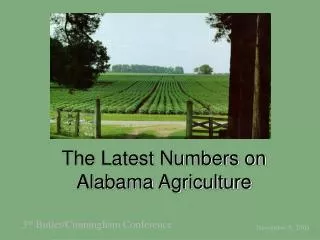
Scottish Agriculture in Numbers. Quiz Results. Andrew Walker. Question 1. Approximately how much of Scottish land belongs to agricultural holdings?. Results of the June Agricultural Census. 73%. Scotland’s land area. Agricultural area. 8% of holdings are over 200 hectares in size .

E N D
Scottish Agriculture in Numbers Quiz Results Andrew Walker
Question 1 Approximately how much of Scottish land belongs to agricultural holdings? Results of the June Agricultural Census
73% Scotland’s land area Agricultural area
8% of holdings are over 200 hectares in size and account for 73% of the agricultural area of Scotland. 52% of holdings are under 10 hectares in size and account for 2% of the agricultural area of Scotland. Percentage of Holdings Percentage of Area
Grass Scotland’s land area Agricultural area Rough grazing Crops and fallow Woodland Non-cultivated land
Agricultural area on main and minor holdings by country, June 2012
Question 2 How many tonnes of cereals were produced in Scotland in 2012? Estimates of the Scottish Cereal Harvest Economic Report on Scottish Agriculture
Change in cereal production (2003 to 2012) – relationship between area and yield –
Prod Value Raspberries Strawberries Other Fruit Prod Value Barley -8% +8% Wheat -30% -16% Oats -11% +16% OSR Potatoes Carrots Turnips and Swedes Brussel Sprouts Peas Other Vegetables 2.5 million tonnes (down 15% on 2011)
Photos used under Creative Commons licence from Flickr.com Whiskey by Paul Joseph Bread loaf by Jeff Keacher Porridge with maple syrup by LondonBrad AgStats Fun Stuff
Question 3 Roughly how many sheep are there for every 100 people in Scotland? Results of the June Agricultural Census
Sheep numbers peaked in 1930s, 60s and 90s , but now at lowest since 1947. 6.7 million in 2012. Cattle numbers were static until the 1930s, then rose to a peak of 2.7 million in 1974, and have since fallen back. 1.8 million in 2012.
Poultry: Numbers, which are only available since 1946, increased in the 1970s, and have fluctuated since then, generally between 12 million and 15 million. 14.7 million in 2012. Pigs: Numbers increased sharply in the 1950s, peaking in the early 70s and late 90s, but have now fallen back to its lowest since 1951. 363,000 in 2012.
People 5.3m Farm workers 68,000 Poultry 14.7m Scotland’s Population Sheep 6.7m Cattle 1.8m Pigs 363,000
People 5.3m Farm workers 68,000 Poultry 14.7m Scotland’s Population Sheep 6.7m Cattle 1.8m Pigs 363,000
People 5.3m Farm workers 68,000 Poultry 14.7m 128 sheep for every 100 people in Scotland. Scotland’s Population Per farm worker Sheep 6.7m 5 pigs 26 cows 98 sheep 215 poultry Cattle 1.8m Pigs 363,000
Output value of livestock Ten-year trend volume price beef sheep poultry pig
Per Person Production 10 chickens of a cow of a pig a sheep 200 eggs Four woolly jumpers Photos used under Creative Commons licence from Flickr.com Chickens by April Younglove Cow and pig by Peter Pearson Sheep (Ovisaries) by Peter aka anemoneprojectors Eggs by George M. Groutas Milkbottlesby gwire The Lopapeysu Gang by GuðmundurBjarniÓlafsson 430 pints of milk
Question 4 What was the Total Income From Farming in Scotland in 2012? Farm Income Estimates
Total Income From Farming (TIFF) -2012 Output = £3.3 bn Less subsidies = £2.8 bn Input = £2.7 bn TIFF = £635m Change over the year: Output Input TIFF -£65m +£46m -£111m
Total Income From Farming (TIFF) -2012 Average: £643m Average: £571m Period of high inflation 1, 2, 3 1995 to 1998: 1 strong pound 2 weak world commodity prices 3 impact of BSE
Question 5 In 2012, what was the average income of Scottish Farm Businesses? Farm Income Estimates
-2% -6% Farm Business Income (FBI) - 2012 Average FBI: Over five years £45k On last year Average FBI of top 25%: £117k FBI of bottom 25%: -£5k
Farm Business Income (FBI) - 2012 • One full year = 1900 hours • FBI/FTE = £31,000 • On average, £16.13 per hour • This is roughly two and a half times the minimum agricultural wage in Scotland
Farm Business Income (FBI) - 2012 Income available to remunerate unpaid labour of those with an entrepreneurial interest in the business, relative to MAW. One in four farm businesses don’t generate enough to pay invested labour the minimum agricultural wage. One in ten make a loss.
Question 6 Which type of farm generates the greatest average farm business income? Farm Income Estimates
Farm Business Income (FBI) - 2012 Dairy Farms average FBI = £80k Average FBI in 2011-12: £80k £50k £50k £48k £45k £37k £30k £25k General Cropping Cereal Cattle & Sheep (LFA) Dairy Mixed Beef (LFA) Sheep (LFA) Lowland Cattle & Sheep Change in last year: +6% -32% -8% -3% +3% +7% -1% -23%
Net Farm Income (NFI) - 2012 Ban on beef exports (BSE)
In 1912, how many hectares of turnips and swedes were grown in Scotland? 177.9
Summary (1) • 73% of Scotland’s land area is agricultural – mostly severely disadvantaged – mostly rough grazing with proportionally less grass than rest of UK. • 2.5 million tonnes of cereals in 2012 – down 15% on previous year due to fall in yields, but still potential for making lots of whiskey • General decline in livestock numbers in last decade, except poultry – while output value of cattle continues to increase other livestock output has seen a fall in the last year.
Summary (2) • Estimated TIFF for 2012 = £635 million – 2% fall in outputs and 2% rise in inputs (esp. fertiliser and fuel) – improvement in 10 year average • Average FBI £45,000 (£117k for high performers, -£5k for low) – without subsidies, average farm makes a loss – one in four farm businesses don’t generate enough to pay invested labour the minimum agricultural wage • Dairy farms have the highest average income (£80,000) – Dairy, Mixed and LFA Cattle and Sheep average incomes at highest levels in 20 years (accounting for inflation) – Overall, average income has returned to level of mid-1990s