Download
1 / 65
660 likes | 690 Vues
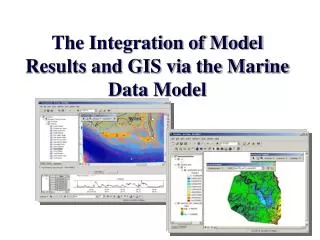
Explore marine data modeling process, tools, and case studies for creating a geodatabase. Learn about schema, templates, multidimensional modeling, relationships, and more. Presentation of marine geodatabase thematic content and feature datasets.

E N D
ArcGIS Data Models: Marine Data Model Dawn Wright - Oregon State University Pat Halpin - Duke University Michael Blongewicz - DHI Joe Breman - ESRI
Polling Questions • What is your name, organization, and email? • (Add yourself to a data models user group list, and you will be sent notifications about webcasts, design studios, etc.) • Which of the following ESRI data types do you most commonly use? • a) Coverage • b) Shapefile • c) Geodatabase feature class • Are you interested in seeing a data model webcast, participating in a design studio, and for which data model? • Where on the web do you get data?
Agenda • Marine data model overview and tools • The use of schema and templates • Tools designed and tested with marine data model case studies. • Multidimensional modeling. • Model elements • Feature Datasets • Object classes • Relationships • Historical Iterations • Subclasses versus Subtypes • Current Status • Ready to be used • Book coming next year • Presentation of tools and uses of a Marine Geodatabase
Thematic Content - layer stackThematic groupings of marine and oceanographic data sets
The Data Modeling CycleConceptual, logical, and physical models Real World Objects and Relationships Conceptual Model Sketches, Flow Diagrams, etc. Logical Model Diagram in CASE Tool ArcCatalog Tools Physical Model Database Schema Business Rules
Geodatabase Point Feature ObjectID Geometry Measurement Computation LandObject SurveyBoundary Coordinate * SurveyPoint LandObjectID TransactionID SystemStartDate OfficialStartDate OfficialEndDate * * Project * What is a Data Model? • A practical working template • A starting point for creating a geodatabase • An aid to simplify the integration of similar datasets • A way to facilitate the exchange of data • A support to existing standards
What’s in a Data Model Template? • A pre-designed schema of Objects • Feature classes • Tables • Relationships • Domains • Subtypes
Using a Design TemplateSchema Wizard reads repository or template to create a geodatabase
Over 25 industry-specific data models Conceptual and logical diagrams Case studies, Tips and Tricks documents ArcGIS Data Models Web sitehttp://support.esri.com/datamodels
Path forward for multiD modeling • Extend existing functionality to support time and other variables of multidimensional data. • Animation manager used to control variables such as time to set the animation sequence. • Improve quality and interaction of charting and include as an animation object. • Added support for the NetCDF data format building on existing layer capabilities. • 3D interpolation
NetCDF in ArcGIS Can be accessed as: • Raster • Feature • Table Direct read and write GIS data to netCDF
Using NetCDF as a feature, raster or table in the GIS(network common data format) • Behaves the same as any layer or table in: • Display Same display tools for raster and feature layers will work on netCDF raster and netCDF feature layers. • Charting Driven by the table just like any other chart. • Animation Multidimensional data can be animated through a variable (e.g. time, pressure, elevation) • Geoprocessing Tool A netCDF raster layer will work just like any other raster layer, same for feature layers and tables.
Extract_east Extract by Rectangle Output Extent Output Extent Raster in WGS84 Mosaic Output grid name Extract by Rectangle (3) Raster in WGS84 extract_west Extract by Rectangle (2) Shifted_west Shift Output Extent Output Extent Geoprocessing ModelsModel Builder diagrams for workflow
3D Interpolation toolSample resulting from collaboration between data models and ESRI developer Network (EDN) New tools based on data model prototypes and case study testing.
Marine Data Model • Overview -Model elements • Feature Datasets and feature classes • Object classes • Relationships • Historical Iterations • Subclasses versus Subtypes • Current Status • Ready to be used • Book coming next year • Presentation of tools and uses of a Marine Geodatabase
Feature Data Sets and Feature Classes The Feature data set Stores the spatial reference for all feature classes it contains, including the extents of their m and z values • Feature Classes • Marine Features • TimeSeries Points • InstantaneousPoints • Instant, Survey, Sounding,LocationSeries • ProfileLine • Shoreline • Track • TimeDurationArea • Mesh Features • MeshPoints • GridPoint, NodePoint • MeshElements • indicates classes covered in detail
Object Classes (Tables) • Object Classes • SurveyInfo - stores parameters of a survey • Series - stores the parameters of a series of locations • MeasuringDevice - stores the parameters of a measuring device • Vehicle - stores information about the vehicle being used • Cruise - stores information associated to a cruise • Parameter - stores the properties of a given parameters • ScalarQuantity - stores magnitude data values • VectorQuantity - stores directional data values • Measurement - storing depths related to a specific Measurements • MeasuredData - storing data values associated to locations • indicates classes covered in detail
Relationships in the model(You may only need to use one or two of these for your individual project) • Relationships • One Survey can have many Points • One ProfileLine can have many Surveys • One Cruise can have many Tracks • One MeshPoint can have many VectorQuantities • One MeshPoint can have many ScalarQuantities • Many VectorQuantities can have one Parameter • Many ScalarQuantities can have one Parameter • indicates classes covered in detail
Classification Historical Iterations • Subclasses versus Subtypes
Presentation of tools and uses of the data model • Varying uses and means of adapting the data model
Instantaneous Points X • a subclass of MeasurementPoint for representing features that are a single observation in time and space • the X, Y coordinates plus a time-stamp create the unique point feature • can have multiple Z locations • an InstantaneousPoint has 4 Subtypes • Instant - default value • Sounding • Survey • LocationSeries • Example: Bathymetric Survey, CTD Drops, 23.06.05 18:00:00 Y Z
InstantaneousPoints.Survey X • SurveyID - • foreignkey relating to SurveyInfo • SurveyInfo - • stores properties about the survey • StartDate • EndDate • Description • DeviceID • TrackID 23.06.05 18:00:00 Z Y
ProfileLine • a feature class designated for deriving additional along a line. • Properties HasM and HasZ are set to TRUE • has a many-to-many relationship with SurveyInfo via SurveyKey • one ProfileLine can be associated to many Surveys • many Survey can be associated to many ProfileLines • Example: Transects, Coastline Evolution
The Design and Intent of ProfileLine Inheritance
TimeSeriesPoint • a subclass of MeasurementPoint • fixed in space (X,Y) • multiple Z Values via Measurement Table • Example: Moored Buoy, ADCP
Design and Intent of Mesh Features • includes feature classes: • MeshElement (polygon) • MeshPoint (points) • includes object classes: • Mesh - identifies the features making up a Mesh • VectorQuantity - vector values for each point for each time step • ScalarQuantity - scalar values for each point for each time step • Parameter - information about a given parameter • Example: 2D Model results
Geodatabase DiagrammerCreate graphical representation of geodatabase once complete
Framework and Publication of:ArcMarineMarine data model book
ArcMarine Purpose • Your Geodatabase Template • Data collection at sea/shore … to final geoprocessing, analysis • Control of required data fields, common data structure • Simplify enterprise GIS project implementation • E.g., cruises, MPA networks, habitat mapping • Program Coding/Application Development • Common/shared tool development • Rapid prototyping • Linkage to processing models • Data Sharing/Networking • “Schooling” in the Gdb
ArcMarine Design Strategy Image modified from original by P. Halpin, Duke
Implementation Process Design Engineering Database Engineering Deployment/Rollout • Since Oct 2001: 3 workshops, 3 ESRI UC sessions • ArcMarine Interest List: over 350 people, 32 countries • Approaching final UML: feature classes, attributes, rules/behaviors • Case studies/tool development in 2005 • ESRI Press Book in 2006 • More info at dusk.geo.orst.edu/djl/arcgis/about.html
ArcMarine: A Geospatial Framework for Ocean and Coastal Analysis • ESRI Press, 2006 • By Wright, Blongewicz, Halpin, Breman • Full background documentation with ~10 case studies • Chapter 1 - Introduction (Why ArcMarine?) • Chapter 2 - Conceptual Framework and Common Marine Data Types
ArcMarine … Chapters 3-6 Marine Marine Marine
Ch. 3 - Marine Surveyse.g., Inst. Points, Time Duration Line, Survey & Cruise object tables Essex MG&G SurveyBrian Andrews, USGS-Woods Hole, MA Louisiana SubsidenceHeather Mounts, PhotoScience, FL
Ch. 4 - Marine Animal Trackinge.g., Location Series Points, Time Duration Lines and Areas, object tables and rasters OBIS, Pat Halpin et al., Duke U. Sea Turtle Tracks (Caretta caretta) Sea Surface Temperature (WCR) Source: http://www.po.gso.uri.edu/SST/ Source: http://obis.env.duke.edu/datasets/ (Read & McClellan2004)