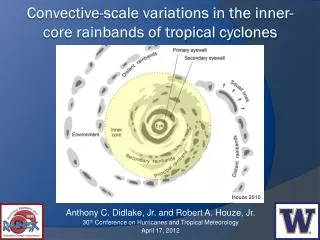
Convective-scale diagnostics
Explore diagnostic techniques for improving rapid intensity change forecasts in tropical cyclones, focusing on convective and vortex-scale processes. Understand the multiscale dynamics impacting cyclone intensity. Enhance physical understanding and model evaluation.

Convective-scale diagnostics
E N D
Presentation Transcript
Convective-scale diagnostics Rob Rogers NOAA/AOML Hurricane Research Division
Motivation • Advances in forecasts of tropical cyclone (TC) intensity, and rapid intensity change (RI) in particular, lag advances in TC track forecasts • Multiscale nature of these processes major reason for this • environmental - O(1000 km) - troughs, shear • vortex - O(1-100 km) - symmetric/asymmetric dynamics, VRWs • convective – O(1 km) – convective bursts, vortical hot towers • turbulent – O(1-100 m) - surface fluxes, entrainment/detrainment • microscale – O(1mm) -- hydrometeor production, latent heat release • Large-scale fields generally explain about 35% of skill in RI forecasts (e.g., RI index). How much can smaller-scale processes explain? • Numerical model forecasts of rapid intensity change (RI) should improve as resolution increases • For some cases it does, in others it does not – why? • Robust diagnostic techniques for isolating impacts of physical processes of various scales on RI important for improved physical understanding, model evaluation and improvement
Motivation 35% of skill explained by Rapid Intensification Index (RII) Kaplan et al. 2009
Summary of diagnostics • Vortex-scale diagnostics • test of initial vortex structure, environment-vortex-convective interactions, resolution • symmetric structure of tangential, radial, vertical wind • radial distribution • vertical structure • time evolution • Convective-scale diagnostics • test of physical parameterizations (microphysical, convective), resolution • statistics of vertical motion, mass flux • time-height vertical profiles • vertical structure of distributions • time evolution of distributions • masking with 0.1 g/kg hydrometeor concentration used to approximate Doppler sensitivity and facilitate comparison with observations
Example • Hurricane Katrina (2005) • Underwent RI from Cat 3 to Cat 5 as it traversed Gulf of Mexico • Both resolutions produced RI, but both delayed • Good observational coverage (multiple P-3 flights with Doppler) 160 RI 9:3 km RI BT RI 27:9 km 140 120 Peak wind (kt) 100 80 60 40 8/27 00Z 8/27 06Z 8/27 12Z 8/27 18Z 8/29 00Z 8/29 06Z 8/29 12Z 8/28 00Z 8/28 06Z 8/28 12Z 8/28 18Z
Vortex-scale diagnostics: Wind field size & structure Time-radius Hovmoller of axisymmetric 10-m wind from H*Wind and HWRF-x H*Wind 55 55 55 50 50 50 12Z Aug 29 45 45 45 40 40 40 00Z Aug 29 35 35 35 30 30 30 25 25 25 12Z Aug 28 20 20 20 15 15 15 10 10 10 RI 00Z Aug 28 5 5 5 0 0 0 12Z Aug 27 00Z Aug 27 50 100 150 200 radius (km) HWRF-x 27:9 km HWRF-x 9:3 km 12Z Aug 29 12Z Aug 29 00Z Aug 29 00Z Aug 29 RI 12Z Aug 28 12Z Aug 28 RI 00Z Aug 28 00Z Aug 28 12Z Aug 27 12Z Aug 27 00Z Aug 27 00Z Aug 27 50 100 150 200 50 100 150 200 radius (km) radius (km)
Vortex-scale diagnostics: Wind field size & structure Time series of integrated kinetic energy (IKE) for 10-m winds thresholded by tropical storm and hurricane force winds from H*Wind and HWRF-x IKE IKE thresholded by tropical storm-force winds IKE thresholded by hurricane-force winds 140 250 27:9 km 9:3 km 27:9 km 9:3 km obs obs 120 200 100 IKE (TJ) IKE (TJ) 150 80 60 100 40 50 20 0 0 8/27 00Z 8/27 06Z 8/27 12Z 8/27 18Z 8/29 00Z 8/29 06Z 8/29 12Z 8/27 00Z 8/27 06Z 8/27 12Z 8/27 18Z 8/29 00Z 8/29 06Z 8/29 12Z 8/28 00Z 8/28 06Z 8/28 12Z 8/28 18Z 8/28 00Z 8/28 06Z 8/28 12Z 8/28 18Z
Vortex-scale diagnostics: Vertical structure of axisymmetric vortex Axisymmetric tangential (shaded, m s-1) and radial wind (contour, m s-1) for Doppler and HWRF-x 16 16 16 Doppler 27:9 km 9:3 km 00Z 8/28 00Z 8/28 20:08Z 8/27 14 14 14 12 12 12 10 10 10 height (km) 8 8 8 6 6 6 4 4 4 2 2 2 25 50 75 100 25 50 75 100 25 50 75 100 radius (km) radius (km) radius (km) 16 16 16 Doppler 27:9 km 9:3 km 19:23Z 8/28 03Z 8/29 03Z 8/29 14 14 14 12 12 12 10 10 10 height (km) 8 8 8 6 6 6 4 4 4 2 2 2 100 25 50 75 25 50 75 100 25 50 75 100 radius (km) radius (km) radius (km)
Vortex-scale diagnostics: Time evolution of vortex size Time series of radius of peak axisymmetric tangential wind at 2 km altitude (km) from Doppler and HWRF-x 110 100 90 9:3 km 27:9 km obs 80 70 radius (km) 60 50 40 30 20 8/27 00Z 8/27 06Z 8/27 12Z 8/27 18Z 8/29 00Z 8/29 06Z 8/29 12Z 8/28 00Z 8/28 06Z 8/28 12Z 8/28 18Z
Vortex-scale diagnostics: Time evolution of axisymmetric vortex size Time-radius Hovmoller of axisymmetric tangential wind and vertical velocity at 5.1 km altitude 12Z Aug 29 12Z Aug 29 w ut 27:9 km 27:9 km 00Z Aug 29 00Z Aug 29 RI RI 12Z Aug 28 12Z Aug 28 00Z Aug 28 00Z Aug 28 12Z Aug 27 12Z Aug 27 00Z Aug 27 00Z Aug 27 50 50 25 25 100 150 200 100 150 200 75 125 175 75 125 175 radius (km) radius (km) 12Z Aug 29 12Z Aug 29 w ut 9:3 km 9:3 km 00Z Aug 29 00Z Aug 29 12Z Aug 28 12Z Aug 28 RI RI 00Z Aug 28 00Z Aug 28 12Z Aug 27 12Z Aug 27 00Z Aug 27 00Z Aug 27 50 50 25 25 100 150 200 100 150 200 75 125 175 75 125 175 radius (km) radius (km)
Vortex-scale diagnostics: Vertical structure of axisymmetric vortex Axisymmetric tangential wind (shaded, m s-1) and vertical velocity (contour, m s-1) 18 18 27:9 km 9:3 km 00Z 8/28 00Z 8/28 16 16 14 14 12 12 10 10 height (km) height (km) 8 8 6 6 4 4 2 2 50 50 25 25 100 150 200 100 150 200 75 125 175 75 125 175 radius (km) radius (km) 18 18 27:9 km 9:3 km 03Z 8/29 03Z 8/29 16 16 14 14 12 12 10 10 height (km) height (km) 8 8 6 6 4 4 2 2 50 50 25 25 100 150 200 100 150 200 75 125 175 75 125 175 radius (km) radius (km)
Vortex-scale diagnostics: Time evolution of vortex vertical structure Time series of 2-8 km altitude eyewall slope (km km-1) from Doppler and HWRF-x 6 5 4 9:3 km 27:9 km obs 3 Eyewall slope (km/km) Outward slope with height 2 1 0 -1 Inward slope with height -2 -3 8/27 00Z 8/27 06Z 8/27 12Z 8/27 18Z 8/29 00Z 8/29 06Z 8/29 12Z 8/28 00Z 8/28 06Z 8/28 12Z 8/28 18Z
Vortex- and convective-scale diagnostics: Wind speed, vertical motion, and vorticity 9:3 km HWRF-x Doppler 27:9 km HWRF-x 70 150 150 150 150 150 65 60 Wind speed (m/s) at 2-km altitude 55 50 50 100 100 100 100 100 distance (km) distance (km) distance (km) 45 40 35 50 50 50 50 50 30 100 100 100 100 100 0 0 0 0 0 0 50 50 50 50 50 50 150 150 150 150 150 0 0 0 0 0 0 distance (km) distance (km) distance (km) 7 6 5 4 Vorticity (shaded, x 10-3 s-1) and w (contour, m/s) at 4-km altitude 3 distance (km) 2 distance (km) distance (km) 1 0 -1 -2 distance (km) distance (km) distance (km) 2038-2231 UTC 8/28 0000 UTC 8/29 0000 UTC 8/29
Convective-scale diagnostics: Time evolution of vertical profiles Time series of mean updraft/downdraft velocity (m s-1) profiles in 4° box with masking RI RI Updraft 27:9 km Updraft 9:3 km 14 14 12 12 10 10 8 8 height (km) height (km) 6 6 4 4 2 2 8/28 00Z 8/27 12Z 8/27 18Z 8/28 06Z 8/28 12Z 8/28 18Z 8/29 00Z 8/28 00Z 8/27 12Z 8/27 18Z 8/29 06Z 8/29 12Z 8/28 06Z 8/28 12Z 8/28 18Z 8/29 00Z 8/29 06Z 8/29 12Z RI Downdraft 27:9 km 14 RI Downdraft 9:3 km 14 12 12 10 10 8 8 height (km) height (km) 6 6 4 4 2 2 8/28 00Z 8/28 00Z 8/27 12Z 8/27 18Z 8/27 12Z 8/27 18Z 8/28 06Z 8/28 12Z 8/28 18Z 8/28 06Z 8/28 12Z 8/28 18Z 8/29 00Z 8/29 00Z 8/29 06Z 8/29 12Z 8/29 06Z 8/29 12Z
Convective-scale diagnostics: Time evolution of vertical profiles Time series of aggregate updraft/downdraft vertical mass flux (x 1010 kg s-1) profiles in 4° box with masking RI RI Updraft 27:9 km Updraft 9:3 km 14 14 12 12 10 10 8 8 height (km) height (km) 6 6 4 4 2 2 8/28 00Z 8/27 12Z 8/27 18Z 8/28 06Z 8/28 12Z 8/28 18Z 8/29 00Z 8/28 00Z 8/27 12Z 8/27 18Z 8/29 06Z 8/29 12Z 8/28 06Z 8/28 12Z 8/28 18Z 8/29 00Z 8/29 06Z 8/29 12Z RI RI Downdraft 27:9 km Downdraft 9:3 km 14 14 12 12 10 10 8 8 height (km) height (km) 6 6 4 4 2 2 8/28 00Z 8/27 12Z 8/27 18Z 8/28 06Z 8/28 12Z 8/28 18Z 8/29 00Z 8/28 00Z 8/27 12Z 8/27 18Z 8/29 06Z 8/29 12Z 8/28 06Z 8/28 12Z 8/28 18Z 8/29 00Z 8/29 06Z 8/29 12Z
Convective-scale diagnostics: Contoured frequency by altitude diagram (CFAD) 40 14 km 35 30 25 vertical velocity 20 percentage 18 15 16 10 14 5 12 0 1 4 -2 6 -1 0 2 3 5 vertical velocity (m/s) 10 height (km) 100 1 km 8 90 6 80 70 4 60 2 percentage 50 40 -4 -6 -2 2 8 12 0 4 6 10 vertical velocity (m/s) 30 20 10 0 1 4 -2 6 -1 0 2 3 5 vertical velocity (m/s)
Convective-scale diagnostics: Contoured frequency by altitude diagram (CFAD) Vertical velocity CFADs for Doppler radar and HWRF-x with masking 18 18 18 20:08Z 8/27 Doppler 12Z 8/27 27:9 km 12Z 8/27 9:3 km 16 16 16 14 14 14 12 12 12 10 10 10 height (km) 8 8 8 6 6 6 4 4 4 2 2 2 -4 -6 12 -2 2 8 12 -4 0 4 6 10 -6 -4 -2 2 8 -6 0 4 6 10 -2 2 8 12 0 4 6 10 vertical velocity (m/s) vertical velocity (m/s) vertical velocity (m/s) 18 18 18 Doppler 27:9 km 9:3 km 22:31Z 8/28 12Z 8/28 12Z 8/28 16 16 16 14 14 14 12 12 12 10 10 10 height (km) 8 8 8 6 6 6 4 4 4 2 2 2 -6 -2 2 8 12 -4 -4 0 4 6 10 -6 -2 2 8 12 0 4 6 10 -4 -6 -2 2 8 12 0 4 6 10 vertical velocity (m/s) vertical velocity (m/s) vertical velocity (m/s)
Convective-scale diagnostics: Time evolution of distributions Time series of vertical velocity distribution (%) at 5- and 14-km altitudes with masking 00Z Aug 30 00Z Aug 30 14 km alt 27:9 km 14 km alt 9:3 km 12Z Aug 29 12Z Aug 29 00Z Aug 29 00Z Aug 29 RI 12Z Aug 28 12Z Aug 28 RI 00Z Aug 28 00Z Aug 28 12Z Aug 27 12Z Aug 27 00Z Aug 27 00Z Aug 27 -4 -4 -6 -6 -2 2 8 12 -2 2 8 12 0 4 6 10 0 4 6 10 vertical velocity (m/s) vertical velocity (m/s) 00Z Aug 30 00Z Aug 30 5 km alt 27:9 km 5 km alt 9:3 km 12Z Aug 29 12Z Aug 29 00Z Aug 29 00Z Aug 29 RI 12Z Aug 28 12Z Aug 28 RI 00Z Aug 28 00Z Aug 28 12Z Aug 27 12Z Aug 27 00Z Aug 27 00Z Aug 27 -4 -4 -6 -6 -2 2 8 12 -2 2 8 12 0 4 6 10 0 4 6 10 vertical velocity (m/s) vertical velocity (m/s)
Convective-scale diagnostics: Time evolution of convective coverage Time series of areal coverage (x 104 km2) of threshold values of 3-7 km vertical velocity in 4x4 deg box with masking 4 4 27:9 km 9:3 km 1 m s-1 2 m s-1 3 m s-1 1 m s-1 2 m s-1 3 m s-1 3.5 3.5 RI RI 3 3 2.5 2.5 area (x 104 km2) area (x 104 km2) 2 2 1.5 1.5 1 1 0.5 0.5 0 0 8/28 06Z 8/28 06Z 8/28 00Z 8/28 00Z 8/27 12Z 8/27 18Z 8/29 00Z 8/29 06Z 8/29 12Z 8/27 12Z 8/27 18Z 8/29 00Z 8/29 06Z 8/29 12Z 8/28 12Z 8/28 18Z 8/28 12Z 8/28 18Z
Summary • convective- and vortex-scale diagnostics can reveal much about inner-core structure and evolution from model and observations • RMW, size of wind field at various thresholds, integrated kinetic energy • secondary eyewall, outer rainband evolution, eyewall slope • vertical velocity and mass flux profiles • vertical structure of vertical velocity distributions • time evolution of vertical velocity distributions • differences between HWRF-x and observations for Katrina case • both resolutions produced RI, but both were delayed. 9:3 km was sooner, stronger than 27:9 km • vortex-scale • RMW broader, outer wind field smaller in model compared to observations • both resolutions produced outer updraft maxima, 9:3 km produced hint of contracting secondary eyewall • eyewall slope generally less for 9:3 km than 27:9 km, more time evolution • convective-scale • mean updraft profiles peaked at higher altitude, downdrafts stronger in 9:3 km • stronger updraft and downdraft mass flux in 9:3 km • stronger updraft/downdraft, vorticity cores in 9:3 km • all these quantities readily calculated from HWRF-x, airborne Doppler, and H*Wind analyses
Future work • include azimuthal asymmetries • partition into precipitation structure regimes (eyewall/rainband/stratiform) • finer-scale diagnostics (turbulent, microphysical) from model and observations • broaden to multi-case diagnostics – normalization issues? • ensemble-based diagnostics