Download
1 / 54
540 likes | 657 Vues
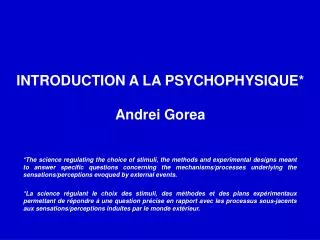
INTRODUCTION A LA PSYCHOPHYSIQUE* Andrei Gorea. *The science regulating the choice of stimuli, the methods and experimental designs meant to answer specific questions concerning the mechanisms/processes underlying the sensations/perceptions evoqued by external events.

E N D
INTRODUCTION A LA PSYCHOPHYSIQUE* Andrei Gorea *The science regulating the choice of stimuli, the methods and experimental designs meant to answer specific questions concerning the mechanisms/processes underlying the sensations/perceptions evoqued by external events. *La science régulant le choix des stimuli, des méthodes et des plans expérimentaux permettant de répondre à une question précise en rapport avec les processus sous-jacents aux sensations/perceptions induites par le monde extérieur.
PLAN DU COURS • (I. Histoire) • II. Stimuli & Méthodes • Stimuli élémentaires et leurs paramètres • Visibilité, enveloppe spatio-temporelle de la visibilité • Autre stimuli, autres problématiques • Seuil, Bruit, Fonction Psychométrique et Transduction • III. Méthode de mesure de seuils • Classification des méthodes et des tâches • Fonction psychométrique • Paradigmes oui/non et choix forcé • Méthodes de mesure de seuil • Méthodes des limites • Ajustement • Stimuli constants • Fonction psychométrique • Méthodes adaptative • ‘Scaling’ et ‘magnitude estimation’ • Plans expérimentaux • Quelques paradigmes classiques IV. Un peu de pratique V. Théorie de la Détection du Signal
II. STIMULI « ELEMENTAIRES » En Psychophysique, le Stimuli doivent être précisément définis… …leur forme, leur taille, leurcouleur, leur orientation, leur contraste (intensité)… …leur fréquence temporelle/spatiale, leur disparité binoculaire, leur vitesse…
T/2 T T/2 Visual Angle Rule of the thumb: q = 57.3/d
DL CWEBER = L0 Dots and Bars Weber’s Contrast L0+DL L0-DL L0
L L0+DL DL DL CWEBER = LO L0 x Gaussian blobs Weber’s Contrast G [m, s]
dB dB = 20log10 (DI / I) DI = I10dB/20 1dB DI/I = 1.122
Dx Vernier Acuity Pierre Vernier (1580-1637) mathématicien français DxSeuil = 5’’
Minimum separabile DxSeuil ≈ 36’’ Dx
SF [cycles/degree] LMAX Amplitude L0 Lmin A LMAX - Lmin CMichelson = = L0 LMAX + Lmin Spatial Frequency (Gratings) Michelson Contrast L(x,t) = L0[1 + mcos(2pfx 2pwt)]
2A fy 2A 0 fx Elements of Fourier Analysis
fy 0 fx 1f, A fy 3f, A/3 0 fx S
fy fy 0 0 fx fx 1f, 2A 3f, 2A/3 5f, 2A/5
Low-pass Low-pass Band-pass Band-pass Dans un système linéaire, mesurer l’amplitude du signal de sortie du système pour une amplitude d’entrée constante (l’approche de l’ingénieur) équivaut à mesurer l’amplitude entrante requise afin d’obtenir un signal de sortie constant (le seuil; l’approche du psychophysicien). Variable Output amplitude Output amplitude Fonction de transfert d’une lentille Constant Input amplitude Frequency (c/deg)
The Human Contrast Transfer Function (CSF) INHIBITION Classical acuity minimum separabile ( 50 c/deg) S (= 1/Cq) C ≈ 36’’ ? SF
Space [deg] TF [cycles/s] Speed[deg/s] = = Time [s] SF [cycles/deg] Gratings move… Direction, speed, velocity Speed deg/s Direction deg Velocity = Speed + Direction
6 Hz 4 c/° 1 Hz 16 Hz Robson, 1966 0.5 c/° 16 c/° 22 Hz 22 c/° Kelly, 1978 THJRESHOLD & SENSITIVITY Sensitivity = 1/Threshold Temporal Frequency cycles/s Hz
Equiluminant gratings Examples of gratings with S-cone positive (left) and S-cone negative (right) contrast.
Contrast sensitivity as a function of spatial frequency for the blue-yellow grating (□; 470, 577 nm) and a yellow monochromatic grating (○; 577 nm). Contrast sensitivities as a function of spatial frequency for a blue-yellow grating (◊; 470, 577 nm) and a red-green grating (□; 602, 526 nm). Chromatic grating & sensitivity Contrast sensitivity as a function of spatial frequency for the red-green grating (□; 526, 602 nm) and a green monochromatic grating (○; 526 nm). Mullen, K.T. (1985) J. Physiol. 359, 381-400
Color vision tests Isihara plates
FILTRAGE MULTIECHELLE Face SF Face SF + Ori
Brightness Mach bands Luminance x
An illusion by Vasarely, left, and a bandpass filtered version, right.
(a) Image 1-D luminance profile (b) Fourier transform of the image (1-D Fourier spectrum) (c) Human SF sensitivity (d) Dot product of (b) & (c) (e) ‘Reconstructed image 1-D luminance profile (inverse Fourier transform)
PHYSICAL SPACE RECEPTIVE FIELD Incoming light Photoreceptors Axons RETINOTOPICAL SPACE RETINOTOPICAL SPACE Neurons Recording site La représentation d’un ensemble de points (image) PHYSICAL SPACE par un seul neurone Incoming light Photoreceptors est strictement identique à la représentation d’unpoint dans l’espacephysique Axons Neurons par l’ensemble des neurones qui le traitent. Recording site IMPULSE RESPONSE The RF is equivalent to the system’s Impulse Response Dans un système linéairerétinotopique,
1 1 1 1 1 1 1 1 2 34 2 34 5 5 5 5 5 5 5 5 -1 -1 3 3 -1 -1 Champ récepteur Réponse impulsionnelle 3 -1 -1 3 -1 1 1 1 1 0 0 2 2 3 3 4 4 6 6 5 5 5 5 -1 3 -1 3 -1 -1 -2 6 -2 -3 9 -3 -5 -5 15 15 -4 12 -4 -5 15 -5 -5 15 -5 CONVOLUTION -5 E(X) = Entrée (fct. de X) S(X) = Sortie (fct. de X) CR = h(x) = Réponse Implle (fct. de x)
Gabors: cos(x) Gauss(x) L(x,t) = L0[1 + mcos(2pfx 2pwt)] Carrier (porteuse) c/deg, phase contrast Envelope m, s deg Spatial Frequency (c/deg) s (deg) Orientation
fy fy fy fy fy 0 0 fx fx 0 0 fx fx fy fy 0 fx + + 0 fx 0 fx Plaids (tartans)
Space [deg] TF [cycles/s] Speed[deg/s] = = Time [s] SF [cycles/deg] Plaids in motion
White noise Pink noise S(f) 1 / f 1 S(f) 1 / f 0 = k Amplitude (dB) Frequency (Hz or c/deg) 1 1 10 10 100 100 Appearance 1-D Fourier spectrum Pink noise or 1/f noise is a signal or process with a frequency spectrum such that the power spectral density is proportional to the reciprocal of the frequency. For pink noise, each octave carries an equal amount of noise power. The name arises from being intermediate between white noise (1/f0) and red noise (1/f2, more commonly known as Brownian noise)
Appearance 2-D Fourier spectrum 1-D Fourier spectrum White Filtered with a 0.5 octave* isotropic filter Filtered noise * Octave: Frequency doubling
Figure 4. Illustration of spatial whitening. (a) A natural image whose amplitude spectrum, plotted in (c), falls approximately as “1/F” on log–log axes with a slope of j1.4. Whitening the amplitude spectrum produces an image (b) that appears sharpened, but otherwise structurally quite similar. (d) The amplitude spectrum of the whitened image has approximately the same amplitude at all spatial frequencies and a resultant spectral slope close to 0. The rms contrasts of the source and whitened images have been fixed at 0.25. Bex, Solomon & Dakin, (2009). Journal of Vision, 9(10):1, 1–19.
White noise Natural Image Root mean square Contrast
rms Contrast (root mean square)
Élévation du Seuil Contraste au Seuil Seuil « absolu » Equivalent Noise Noise rms Contrast SF gratings in Noise Assessing the internal noise
A visual assessment chart consisting of letters in noise that is designed to test for some neural deficits while being unaffected by optical deficits. Denis Pelli (NYU, USA) & John Hoepner (Depart. of Opthalmology, Health Science Center, Syracuse, NY, USA.) http://viperlib.york.ac.uk/scripts/PortWeb.dll?field=keywords&op=contains&value1=noise&template=thumbs_details&join=or&field2=imageDescription&op=contains&value2=noise&sorton=Filename&catalog=proto1&submit2.x=0&submit2.y=0&submit2=Search
I. Create a random dot image. II. Copy image side by side. III. Select a region of one image. The Random Dot Stereogram is ready. IV. Shift (horizontally) this region and fill in the blank space left behind with the random dots to be replaced ahead. Random Dots Stereograms (RDS – Julesz, 1961) To “reveal” the “hidden” square the brain presumably computes the cross-correlation between the 2 images.
P p p’ x’ x Binocular disparity Binocular disparity x – x’ [deg] Figure 1.The binocular fusion problem: in the simple case of the diagram shown on the left, there is no ambiguity and stereo reconstruction is a simple matter. In the more usual case shown on the right, any of the four points in the left picture may, a priori, match any of the four points in the right one. Only four of these correspondences are correct, the other ones yielding the incorrect reconstructions shown as small grey discs
CMAX - Cmin CCMichelson = CMAX + Cmin CMAX Cmin Amplitude x Amplitude Modulation (AM) Contrast-Contrast (2nd order modulations) http://viperlib.york.ac.uk/scripts/PortWeb.dll?field=keywords&op=contains&value1=second+order+motion&template=thumbs_details&join=or&field2=imageDescription&op=contains&value2=second+order+motion&sorton=Filename&catalog=proto1&submit2.x=41&submit2.y=12&submit2=Search http://www.michaelbach.de/ot/lum_contrast-contrast/index.html
Figure-Fond Rubin, 1915
Necker cube Luis Albert Necker, 1832
Sort commun, Mouvement et Forme 2D HIDDEN IMAGE