Download
1 / 16
160 likes | 301 Vues
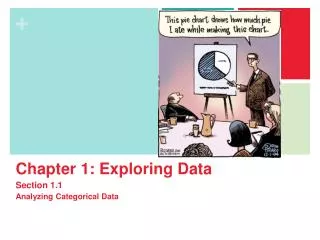
Ch 1.1 – Analyzing Categorical Data. Categorical Data. Good graphs to use: Pie charts Bar graphs Pie charts: you must have all categories involved in the whole variable! (total) Bar graphs: don’t forget labels!!!!! bars are evenly spaced and do not touch. What makes a deceptive graph?.

E N D
Categorical Data • Good graphs to use: • Pie charts • Bar graphs • Pie charts: you must have all categories involved in the whole variable! (total) • Bar graphs: don’t forget labels!!!!! • bars are evenly spaced and do not touch
What makes a deceptive graph? • Uneven widths of bars • Pictures instead of bars • Uneven scale • Don’t have exact angle measure/percents with pie charts – estimation is used too much
Marginal Distribution • the totals of each categorical variable. Usually given as a percent, but not always. • Counts: a number total • Percents: (counts of the variable) / (total number of data)
Attitude toward recycled coffee filters: are recycled products of better quality, the same quality, or worse quality than normal products? The data below reflects the opinion of people who use recycled products versus the opinion of people who don’t use recycled products.
1. How many people does this table describe? How many of these were buyers of coffee filters made from recycled paper? • 2. Give the marginal distribution of opinion about the quality of recycled filters. What percent think the quality of recycled filters is the same or higher than the quality of other filters?
Conditional Distribution • a particular variable is not compared to the total number in the entire data set, but rather to a total of a particular criteria. • i.e. comparing the females who work more than 10 hours a week in this class, to the total number of females in the class - not the total number in the class.
Recycled Filters Data • If we want to know whether or not if someone is a buyer influences their opinion about the quality of recycled filters, what conditional distributions would we compare? • Draw a conclusion from your findings.
4 Step Process • Step 1: State • Step 2: Plan • Step 3: Do • Step 4: Conclude
Yellowstone National Park surveyed a random sample of 1526 winter visitors to the park. They asked each person whither they owned, rented, or had never used a snowmobile. Respondents were also asked whether they belonged to an environmental organization. The two-way table summarizes the survey responses. • ENVIRONMENTAL CLUBS
Do these data provide convincing evidence of an association between environmental club membership and snowmobile use for the population of visitors to Yellowstone National Park? • We will use the 4 Step • process! • State-Plan-Do-Conclude
Step 1 - State • What is the question we’re trying to answer? What is the relationship between belonging to an environmental organization and using a snowmobile at Yellowstone?
Step 2 - Plan • How will we answer our question? • What statistical techniques will we need to use? I suspect belonging to an environmental organization will reduce the chances of using a snowmobile. I will compare the conditional distributions of snowmobile use for those who do and do not belong to an environmental organization.
Step 3 - Do • Make graphs and do calculations Conditional Distributions: Never/Belong - 69.5% Rent/Belong - 25.2% Own/Belong - 5.2% Never/Don’t Belong - 36.4% Rent/Don’t Belong - 40.7% Own/Don’t Belong - 22.9% Now construct a side-by-side bar graph
Step 4 - Conclude • Give your conclusion IN THE SETTING OF THE REAL-WORLD PROBLEM!!!!!! People who are members of an environmental organization are much more likely to have never used a snowmobile, about 69.5% of this group will have never used one, whereas only 36.4% of non-members of an environmental group have never used one. Those in an environmental organization are less likely to have rented or owned a snowmobile than those not in an environmental group.