Download
1 / 26
260 likes | 346 Vues
Impact of ACGME Duty Hour Rules on Prolonged Length of Stay Among Medicare and VA Patients. Jeffrey H. Silber, MD, PhD Professor of Pediatrics, Anesthesiology and Critical Care, and Health Care Systems The University of Pennsylvania School of Medicine The Children’s Hospital of Philadelphia

E N D
Impact of ACGME Duty Hour Rules on Prolonged Length of StayAmong Medicare and VA Patients Jeffrey H. Silber, MD, PhD Professor of Pediatrics, Anesthesiology and Critical Care, and Health Care Systems The University of Pennsylvania School of Medicine The Children’s Hospital of Philadelphia The Wharton School
Acknowledgments Kevin G. Volpp, MD, PhD Paul R. Rosenbaum, PhD Amy K. Rosen, PhD Patrick S. Romano, MD Kamal M.F. Itani, MD Liyi Cen, MS Lanyu Mi, MS Michael J. Halenar, BA Orit Even-Shoshan, MS Jeffrey H. Silber, M.D., PhD The University of Pennsylvania School of Medicine; The Wharton School, The Children’s Hospital of Philadelphia, The University of California, Davis, and Boston University; The U.S.Veterans Administration Hospitals in Philadelphia and Boston. Funding: NHLBI (R01 HL082637) and VA (IIR 04-202)
Motivation • In 2003 the rules governing work hours for residents were changed on a national level • In Previous work [JAMA 2007] we have reported on the influence of duty hour reform on mortality—finding little effect--no clear evidence of harm • We now report on Prolonged Length of Stay (PLOS), a non-lethal outcome that may be associated with the change in resident work hour regulations
Overview • We wished to utilize a measure that would reflect subtle problems that may occur from the change in resident work hour rules. • Prolonged LOS (PLOS) may reflect subtle complications and inefficiencies in care that prolong stay • These problems could potentially be a reflection of the change in resident duty hour regulations because: • Increased handoffs may increase errors in care leading to complications • Increased handoffs may increase inefficiencies in the early discharge of uncomplicated patients • More rested residents may increase efficiency and prevent errors that may lead to prolonged stays
Defining Prolonged LOS (PLOS) • PLOS was first introduced by Silber and Rosenbaum et al. in HSR 1999 • PLOS is based on the concept that for most admissions (conditions and procedures) there is a point in the hospitalization when “the longer you have stayed, the longer you will stay” signifying that some problem has occurred
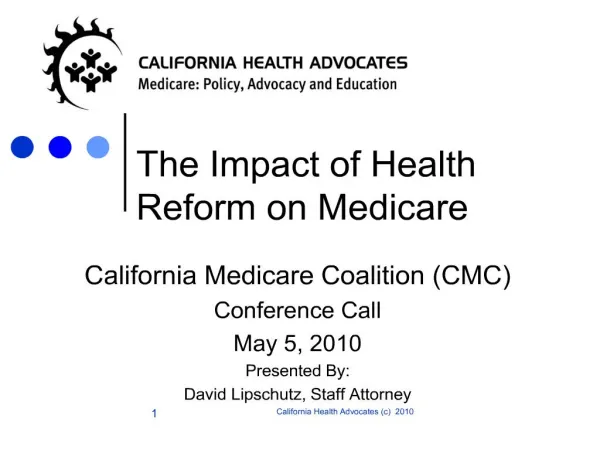
Prolongation Point Declining discharge rate: Less likely to go home as the patient stays longer Daily Rate of Discharge Increasing discharge rate: More likely to go home as the patient stays longer Length of Stay (Days) Prolongation Point • We can divide a hospital stay into two parts:
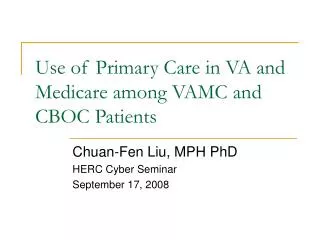
0.28 0.24 0.20 0.16 0.12 0.08 0.04 0.00 0 5 10 15 20 Days Rate of Discharge
Prolongation Points and Percentage of Patients with Prolonged Hospital Stays by Conditions and Procedures (July 2002-June 2003) Prolongation Point Percent (Hosp. Day No.) Prolonged Conditions & Procedures Medicare VA Medicare VA Medical AMI 3 3 79.7 75.4 Stroke 3 3 78.9 76.4 GI Bleed 3 3 56.1 53.1 CHF 3 3 66.0 62.6 Surgical Lap Chole 2 2 66.6 57.5 R Hemicol. 6 6 65.7 71.9 Sigmoidectomy 6 6 72.5 74.0 O Chole 5 5 66.3 66.7 Total Knee 4 5 44.1 38.6 O Red Femur Fx w/ Int Fix 4 7 76.3 62.6 Total Hip 4 5 48.2 47.7 Exc Interverteb Disc 2 2 38.6 42.6 Res AAA 6 6 70.2 71.5 End Graft AA 2 3 44.8 55.7 AKA 5 14 81.6 44.6 Femoral-Pop Bypass 6 6 65.4 67.4 Toe Amp 6 7 56.9 61.1
Types of PLOS Measures • PLOScost: Use LOS for death as it occurred • PLOSoutcomes: Use LOS for death as prolonged • We used PLOSoutcomes for this study, but results were stable using either definition
A Difference-in-Differences Study of PLOS ACGME Reform
Measuring Teaching Intensity • We utilized the Resident-to-Bed Ratio as our measure of teaching intensity • The RB ratio is defined as the total number of residents at a hospital divided by the hospital’s average daily census (ADC), as reported to Medicare using Medicare Cost Reports • Typically, RB ratios are classified as follows: • RB = 0 (non-teaching) • 0<RB<0.05 (very minor teaching) • .05<RB<0.25 (minor teaching) • 0.25<RB<0.6 (major teaching hospitals) • RB > 0.6 (very major teaching hospitals).
Risk Adjustment Methodology • We performed Conditional Logistic Regression clustering on the individual hospital • Risk adjustment was based on Elixhauser comorbidities, transfer-in status, age and sex, and principal procedure or condition • We utilized a 6-month look-back to improve the sensitivity of the Elixhauser comorbidities
Patient Populations • Medicare: MEDPAR data on all patients between ages 65 and 90 for Medical Conditions (AMI, CHF, Stroke, and GI bleeding) and Surgical Procedures (General Surgery, Orthopedics, and Vascular Surgery) for 2001-2005. • VA data: Same years, ages, conditions, and procedures
Patient Characteristics by Diagnosis and Procedure (Medical) Age Mean No. of No. of Patients (mean) % Male Comorbidities Medicare VA Medicare VA Medicare VA Medicare VA AMI 970,184 32,170 77.3 66.9 52 99 1.9 2.0 Stroke 933,225 25,385 78.4 68.1 42 98 2.1 1.9 GI Bleed 763,765 36,035 78.5 66.9 44 98 2.6 2.3 CHF 1,196,294 50,266 78.6 69.7 44 98 2.6 2.5
Patient Characteristics by Diagnosis and Procedure (Surgical) Age Mean No. of No. of Patients (mean) % Male Comorbidities Medicare VA Medicare VA Medicare VA Medicare VA Gen Surg Lap Chole 298,108 7,174 75.8 60.4 39 91 1.8 1.4 R Hemicol 166,283 6,500 77.0 68.9 43 98 2.2 2.0 Sigmoid 103,952 4,232 75.9 64.8 40 98 2.0 1.6 Chole 83,172 4,576 76.4 64.4 51 96 1.9 1.6 Ortho Surg Total Knee 651,708 13,658 74.5 65.2 35 96 1.5 1.1 O Red I/F Fem 300,713 3,850 81.2 72.7 25 97 2.3 2.1 Total Hip 317,561 8,158 75.5 63.1 36 96 1.5 1.1 Intervert Disc 94,577 7,053 73.4 52.7 49 95 1.4 0.8 Vascular Surg Resection AAA 63,995 2,524 75.3 69.8 75 99 2.0 1.9 Graft Abd Aorta 43,856 1,927 76.3 71.3 83 100 2.1 1.9 AKA 31,890 1,689 79.3 71.3 46 99 3.9 3.1 Fem Pop Bypass 25,354 2,907 73.5 61.5 60 99 2.4 1.9 Toe Amp 14,378 2,172 79.3 65.6 58 99 3.5 2.6
Prolongation Points and Percentage of Patients with Prolonged Hospital Stays by Conditions and Procedures Prolongation Point Percent (Hosp. Day No.) Prolonged Conditions & Procedures Medicare VA Medicare VA Medical AMI 3 3 79.7 75.4 Stroke 3 3 78.9 76.4 GI Bleed 3 3 56.1 53.1 CHF 3 3 66.0 62.6 Surgical Lap Chole 2 2 66.6 57.5 R Hemicol. 6 6 65.7 71.9 Sigmoidectomy 6 6 72.5 74.0 O Chole 5 5 66.3 66.7 Total Knee 4 5 44.1 38.6 O Red Femur Fx w/ Int Fix 4 7 76.3 62.6 Total Hip 4 5 48.2 47.7 Exc Interverteb Disc 2 2 38.6 42.6 Res AAA 6 6 70.2 71.5 End Graft AA 2 3 44.8 55.7 AKA 5 14 81.6 44.6 Femoral-Pop Bypass 6 6 65.4 67.4 Toe Amp 6 7 56.9 61.1
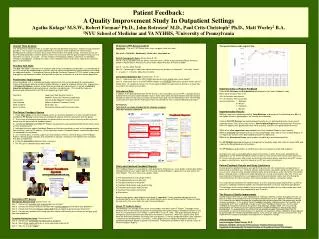
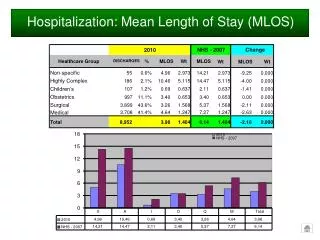
Non-teaching (0) Very Minor/Minor (>0 & <.25) Major (>0.25& <0.6) Very Major (>0.6) Unadjusted Results (Medical)
Non-teaching (0) Very Minor/Minor (>0 & <.25) Major (>0.25& <0.6) Very Major (>0.6) Unadjusted Results (Surgical)
Odds of Prolonged Stay Post Duty Hour Reform in More vs. Less Teaching Intensive Hospitals Using Conditional Logistic Regression Controlling for Each Hospital RB ratio x post-reform year 1 Patient categories OR (95% CI) (Number of Cases Medicare/VA) Medicare VA Medical Conditions Stroke 1.01 (0.92, 1.10) 0.92 (0.66, 1.27) AMI 1.01 (0.93, 1.10) 0.96 (0.72, 1.29) GI Bleed 1.06 (0.97, 1.16) 1.26 (1.00, 1.58) a CHF 0.99 (0.92, 1.06) 1.11 (0.92, 1.35) Combined Medical 1.01 (0.97, 1.05) 1.07 (0.94, 1.20) Surgical Conditions General Surgery 1.09 (0.99, 1.21) 1.07 (0.79, 1.43) Orthopedic Surgery 1.03 (0.96, 1.10) 0.82 (0.61, 1.12) Vascular Surgery 1.16 (1.00, 1.34) 1.08 (0.66, 1.77) Combined Surgery 1.04 (0.98, 1.09) 0.94 (0.78, 1.14) ap<0.05
Odds of Prolonged Stay Post Duty Hour Reform in More vs. Less Teaching Intensive Hospitals Using Conditional Logistic Regression Controlling for Each Hospital RB ratio x post-reform year 2 Patient categories OR (95% CI) (Number of Cases Medicare/VA) Medicare VA Medical Conditions Stroke 1.01 (0.92, 1.10) 0.95 (0.69, 1.31) AMI 1.06 (0.97, 1.15) 0.96 (0.72, 1.28) GI Bleed 1.09 (1.00, 1.20) 1.08 (0.86, 1.36) CHF 1.02 (0.95, 1.10) 1.18 (0.97, 1.43) Combined Medical 1.04 (0.99, 1.08) 1.05 (0.93, 1.19) Surgical Conditions General Surgery 0.94 (0.85, 1.05) 1.02 (0.76, 1.36) Orthopedic Surgery 0.94 (0.88, 1.01) 1.04 (0.77, 1.41) Vascular Surgery 1.21 (1.04, 1.40) a 1.16 (0.71, 1.91) Combined Surgery 0.96 (0.91, 1.01) 1.00 (0.83, 1.21) ap<0.05
Conclusions • The change in duty hour rules did not have an overall effect on the probability of experiencing a prolonged stay • In Medicare and VA systems, hospitals generally found ways to cope with any worsening of continuity of care associated with duty hour reform and by-and-large succeeded in avoiding the confusion and adverse consequences predicted by those opposed to the new regulations.