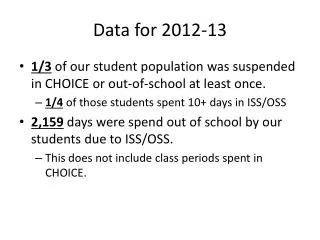
Download
1 / 66
680 likes | 922 Vues
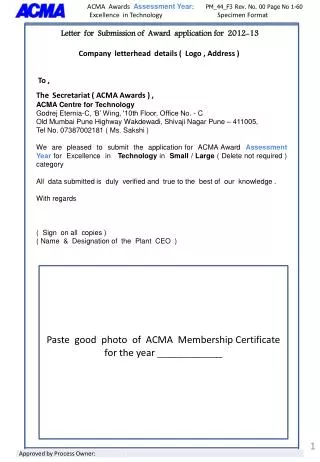
Letter for Submission of Award application for 2012-13. Company letterhead details ( Logo , Address ). To , The Secretariat ( ACMA Awards ) , ACMA Centre for Technology Godrej Eternia-C, ‘B’ Wing, '10th Floor, Office No. - C

E N D
Letter for Submission of Award application for 2012-13 Company letterhead details ( Logo , Address ) To , The Secretariat ( ACMA Awards ) , ACMA Centre for Technology Godrej Eternia-C, ‘B’ Wing, '10th Floor, Office No. - C Old Mumbai Pune Highway Wakdewadi, Shivaji Nagar Pune – 411005, Tel No. 07387002181 ( Ms. Sakshi ) We are pleased to submit the application for ACMA Award 2012-13 for Excellence in Manufacturing. All data submitted is duly verified and true to the best of our knowledge . With regards ( Sign on all copies ) ( Name & Designation of the Plant CEO ) Paste good photo of ACMA Membership Certificate for the year 2013-14
Company’s Details • Name of the corporate group (if company is part of a corporate group): - • ( Underline the plant for which application is sent ) • Plant 1 • Plant 2 • Plant 3 • Plant Address for which application is sent : • 2. Name of the Chief executive of the corporate group- • Chief Executive (Applicant Plant) details : • Name : Designation : • Mobile : E-mail : • Land line with extension : Fax No. • 4. Plant Head ( Next to Chief Executive (Site)) details : • Name : Designation : • Mobile : E-mail : • Land line with extension : Fax No. • ( If Sr. No. 3 & 4 are same , then provide next level person details at Sr. No. 4 )
Company’s Details • Company turnover ( in Rs. Crore ) for Year 2012-13 : • Plant turnover ( in Rs, Crore ) for Year 2012-13 : • Year of Establishment : Company _______ , Plant ___________ • Total Employees : Company ___________ , Plant _____________ • Do you have a Joint Venture : ( If Yes , Mention the partner name ) • Company’s Key products : • 11. Plant’s Key products : • Plant’s key manufacturing processes : • Key competitors : • 14. Key Suppliers : • 15. Major Certifications :
Customer Details As a part of ACMA Award process, feedback from your major customers will be obtained directly and will be provided to Jury as a part of Site Assessment Report. The same will be provided to you as a part of Site Assessment feedback report Kindly provide 2 names per Key Customers for the plant for which application is being sent.
Company / Plant Information ( page 1 of 2 ) Use slide no. 5 and 6 to brief about your company / Plant . It includes Product names / photos , Plant facility photographs ,
Company / Plant Information ( page 2 of 2 ) Use slide no. 5 and 6 to brief about your company / Plant . It includes Product names / photos , Plant facility photographs ,
Route Map to reach your plant Provide here route map to your company for site assessment ( Site assessment is carried out if your application is shortlisted by Jury ) Contact person name & Designation: Name : Designation : E-Mail : Mobile : Landline : ( STD Code ) ( Number ) : Ext. ( if any )
( For office use only ) Company performance at a glance ( Following radar chart shows the scores for each main area as per questionnaire, scores are converted to % ) RADAR Chart
( For office use only ) Section 1 Leadership Focus Total Marks = 325
Leadership Focus (1.A) Vision, Mission and Strategies Total = 15 • Please write your Statements of vision, mission strategies & dates of when these were Formed and Revised . (15) • VISION : ( Formed on / / , Revised on : / / ) MISSION : ( Formed on / / , Revised on : / / ) STRATEGIES : ( Formed on / / , Revised on : / / ) 15
Leadership Focus (1.B) Strategic Planning Total = 20 • (i)Do you have a planning process for deploying vision, mission, strategies (e.g., Policy Deployment, Management by Objective, etc.)? (10) • (ii) Please show samples of action plans of people in line and support functions for achieving a common objective. (10) 20
Leadership Focus (1.C) Communications Total = 15 (i) How often Leadership communicates to employees ? . (10) (ii) Show photographs of above communication . (5) Sr.No. 1 photo Sr.No. 2 photo Sr.No. 3 photo 15
Leadership Focus (1.D) Social Commitment Total = 15 (i) How do leadership contribute to the society ? What was the budget for last year ? (10) (ii) Share some shining examples of Social commitment , Photos ( 5 ) Photo Photo 15
Leadership Focus (1.E) Training Total = 15 • In which areas do you provide training to your employees ? List some benefits achieved by trainings in recent past. ( 5 ) • Training Areas : (ii) What is the trend of the training hours / employee over the years? (show last three year trend in bar graph) ( 5 ) Formula Total training man-hours for all employees for year Training hours/employee / year =---------------------------------------- --------------------- Total employees (iii) Benefits of Training : Tangible ( in Rs. Lacs ) & Intangible : ( 5 ) 15
Leadership Focus (1.F) Housekeeping Total = 20 (i)illustrate how concept of 5S/house keeping has been deployed in your plant?(10 ) (ii) What methods are adopted to assess 5S levels/scores? (show last one year trend in line graph). (10) Formula 5 S Score = Lowest zone / area score of that month in % 20
Leadership Focus (1.G) Teams Total = 20 • Explain how company encourages small group activities : ( 5 ) • (ii) Do small group participate in the Quality Conventions-Group/State level/National. Show certificates / trophy photographs : ( 5 ) (iii How many active groups are present in the current year? % employee involvement In QC Activity? (show last three year trend in bar graph) (10 ) 20
Leadership Focus (1.H) Motivation, creativity and innovativeness Total = 15 • What are the methods used for motivating employees at various levels ? ( 5 ) (ii) How company encourages creativity and innovativeness ?( 5 ) (iii) Show TWO breakthrough achievements as a result of Motivation ?( 5 ) 15
Leadership Focus (1.I) Employee Satisfaction Total = 15 • What are the parameters considered for measuring Employees Satisfaction ( 5 ) (ii) What is the trend of Employee Satisfaction over the years? (show last three year trend in bar graph) ( 5 ) (iii) What are the areas improved based on Employee Survey ( 5 ) 15
Leadership Focus (1.J) Manufacturing vision & strategy Total = 50 (i) What is the vision for New product Development ? ( 15 ) (ii) What Strategy is deployed to achieve Vision of New Product Development ? ( 15 ) 30
Leadership Focus (1.J) Manufacturing vision & strategy Total = 50 (iii) How company improves operational Excellence ? ( 10 ) (iv) Show shining examples of Operational Excellence ( 10 ) photo photo 20
Leadership Focus (1.K) Innovations in market service & product Total = 75 (i) What approach is used for New Product Development ? Give evidence if company is using tools like quality function deployment, concurrent or simultaneous engineering, etc. for product development (25 ) 25
Leadership Focus (1.K) Innovations in market service & product Total = 75 (ii) Give evidence of benchmarking with competitor’s products and/or services and improvements done in weak areas (25 ) 25
Leadership Focus (1.K) Innovations in market service & product Total = 75 (iii) What innovations are done to reduce cost of logistics ? (15 ) (iv) What innovations are done to improve packing / packaging ? (10 ) 25
Leadership Focus (1.L) Partnering with Customers / suppliers Total = 50 (i) How company is partnering with Customers/ Suppliers for creating higher value for the customer.(15 ) (ii) Show one shining example of partnering with Customers/ Suppliers .( 10 ) 25
Leadership Focus (1.L) Partnering with suppliers/dealers Total = 50 (iii) How company supporting its suppliers for creating higher value for suppliers (15 ) (iv) Show one shining example of Supporting Suppliers .( 10 ) 25
( For office use only ) Section 2 Manufacturing operations & processes Total Marks = 250
2. Manufacturing Operations & Processes (2.A) Just in Time Manufacturing Total = 25 (i) How JIT is practiced in your company ? ( 10 ) (ii) How Lead time is reduced ? Show one shining example ( 10 ) (iI) What are the Benefits of JIT for your company ( 5 ) 25
2. Manufacturing Operations & Processes (2. B) Waste Elimination Total = 25 (i) Which techniques are used to find wastes in your company ? (10 ) (iI) How Waste is reduced ? Show one shining example ( 10 ) (iI) What are the Benefits of Waste removal in your company ( 5 ) 25
2. Manufacturing Operations & Processes (2. C) Material Handling Total = 25 (i) What are the containers used for material handling ? (10 ) (iI) What % of containers are “ 3 C “ ? Show Shining examples with photographs ( 3C = Count Free, Contact Free, Clean Container) (15 ) 25
2. Manufacturing Operations & Processes (2. D) Total Productive Maintenance Total = 25 (i) What % of machines / Equipments are covered under TPM (10 ) (iI) What are the benefits of TPM ? Quantify . ( 10 ) (iii) How many Defects made Zero in last year ( 5 ) 25
2. Manufacturing Operations & Processes (2. E) Quick Changeovers Total = 20 (i) What is the minimum and maximum change over time of Bottleneck Process ? And what is the Total Changeover time as % of Available Time for Bottleneck process?(5 ) (ii) Is there any method to monitor changeover times ? If Yes , then show evidence ?(5 ) (iii) Show TWO Shining examples of Changeover time reduction / Elimination ( 10 ) 20
2. Manufacturing Operations & Processes (2. F) Poka-Yokes Total = 25 (i) What % of CTQs are having Poka-Yoke ? . Total how many Poka-Yoke are implemented and are working ? (5 ) (ii) Is there any method to identify need for Poka-Yoke ? (10 ) (iii) Show TWO Shining examples of Poka-Yoke ( 10 ) 25
2. Manufacturing Operations & Processes (2. G) Cellular Manufacturing Total = 25 (i) What % processes are working with cellular manufacturing ? (5 ) (iI) Is there any method to design the cell ? (5 ) (iii) Show 2 Shining examples of Cellular manufacturing , Before / After layout with Benefits (15 ) 25
2. Manufacturing Operations & Processes (2. H) CAD / CAM & Computer Integrated Manufacturing Total = 20 (i) What are the areas for the use of CAD / CAM in your company (5) (ii) What are the latest software available for Manufacturing Shop with your company ? (5 ) (iii) Show 2 Shining examples for the use of such software to improve Quality , Cost , productivity , Lead time (10 ) 20
2. Manufacturing Operations & Processes (2. I) Statistical Process Control Total = 20 (i) How many CTQ parameters are tracked with SPC ? And % of total CTQ Parameters under SPC (5) (ii) Show one latest Run chart / SPC Chart filled by operator ( 5 ) (iii) How many parameters , 100 % inspection is stopped ? (Cpk >1.67) (5 ) (iii) What are the tangible / Intangible benefits of SPC (5 ) 20
2. Manufacturing Operations & Processes (2. J) Kaizens Linked to Results Total = 20 (i) How many Kaizens done in Year 2012-13 as per following ? (10) (ii) What is the per employee Kaizen for last Year ? ( 5 ) (iii) What are the innovative Kaizens done ? ( 5 ) 20
2. Manufacturing Operations & Processes (2. K) Tools of Quality Total = 20 (i) How many basic Quality tools are used and for what purpose & what % of employees are trained for each tool ? (10) (i) How many Management Quality tools are used and for what purpose & what % of employees are trained for each tool ? (10) 20
( For office use only ) Section 3 Support Functions Total Marks = 100
3. Support Functions (3.A) Support Function Strategy Total = 25 (i) What is the policy and strategy for improvements in support functions? ( 10 ) (ii) Please describe the process for implementing this strategy covering all functions.(15) 25
3. Support Functions (3.b) Support Department : Goals Vs Actual Total = 25 (i) What is the % achievements of Support function Goals for the year 2012-13 ? ( 15 ) (ii) How Top management ensures that this achievement ratio improve year on year (10) 25
3. Support Functions (3.C) Value Adding Improvements Total = 25 (i) What is the shining Value adding improvements done by support departments ( 15 ) (ii) How top management motivates support team ? ( 10 ) 25
3. Support Functions (3.D) Use of IT Total = 25 (i) How IT Is integrated with Manufacturing ? ( 15 ) (ii) How IT integration helped to reduce cost ? ( 10 ) 25
( For office use only ) Section 4 Performance Results Total Marks = 225
4. Performance Results (4.A) Cost of poor Quality ( COPQ) Total = 25 (i) What is the trend for this data/current status? (show last 3 year data in bar graph (15 ) Cost of poor Quality ( COPQ ) as a % of Sales (iii) Show elements of Cost of poor quality and improvements for the year 2012-13 . ( 10 ) 25
4. Performance Results (4.B) Customer Complaints Total = 20 (i) Please describe method of capturing customer complaints? (10) (ii) What is the trend of the customer complaints in nos? (Show last one year data in line graph. (10) 20
4. Performance Results (4.C) Customer Returns Total = 20 (i) Show the trend of last three years of Customer Returns PPM in bar graph. ( 10 ) (ii) What efforts are taken to improve Customer returns ? (10) 20
4. Performance Results (4.D) Warranty Rejections Total =10 (i) What are the trends of the warranty ? (show last 3 year data in bar Graph) (5 ) Note : If warranty is Not applicable for your products , Mention in place of Graph (ii) Please describe the actions taken to reduce warranty rejection ( 5 ) 10
4. Performance Results (4.E) In-House Rejection Total = 10 (i) What are the trends of the Total in-house rejection in PPM ? (show last 3 year data in bar graph) (5) (ii) Please describe the actions taken to reduce the in- house rejection (5) 10
4. Performance Results (4.F) Supplier Rejection Total = 10 (i) What are the trends of the supplier rejection in PPM ? (show last 1 year data in bar Graph) (5) (ii) Please describe the efforts to reduce the supplier rejection? (5 ) 10
4. Performance Results (4.G) Absenteeism Total = 20 • What is absenteeism data ( Average) for the year 2012-13 ? ( 5 ) • Authorized = % • Unauthorized = % • Total = % (ii) What are the trends in regards to total absenteeism? (Three year trend in bar graph) (10 ) Formula Total absent man-hours for the month ( Authorized + Unauthorized ) Absenteeism =-------------------------------------------------------- -------------------------------- X 100 Total man hours for the month (iii) What efforts organization takes to reduce absenteeism? (5 ) 20