Download
1 / 26
260 likes | 385 Vues
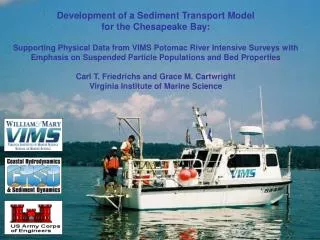
Development of a Sediment Transport Model for the Chesapeake Bay: Supporting Physical Data from VIMS Potomac River Intensive Surveys with Emphasis on Suspended Particle Populations and Bed Properties Carl T. Friedrichs and Grace M. Cartwright Virginia Institute of Marine Science.

E N D
Development of a Sediment Transport Model for the Chesapeake Bay: Supporting Physical Data from VIMS Potomac River Intensive Surveys with Emphasis on Suspended Particle Populations and Bed Properties Carl T. Friedrichs and Grace M. Cartwright Virginia Institute of Marine Science
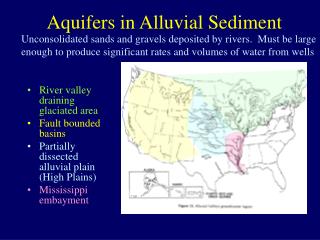
Station locations General station locations along Potomac
ADCP, Proflier ADCP LISST 2 OBS CTD ADV Pump
Bottom sampling Bed grab with 1 cm interval subsamples of top 5 cm: % water organic matter sand/silt/clay Eh profile
LISST 1 LISST: Laser In-Situ Scattering Transmissometer Parts Per Million 5 m 500 m Log10 particle size (micron)
LISST 2 LISST: Laser In-Situ Scattering Transmissometer Upper water column: Larger size particles, presumably low density, biologically influenced flocs. Parts Per Million Near the bed: Intermediate size particles, presumably higher density and suspended from bed. 5 m 500 m Log10 particle size (micron)
Transects 1 ADCP velocity transect ADCP mass conc transect LISST D50 profiles CTD salinity profiles
Transects 2 ADCP velocity transect ADCP mass conc transect ADCP shows mass conc minimum at 2-3 m depth, but LISST shows size maximum LISST D50 profiles CTD salinity profiles
TSS vs. speed TSS vs. Speed Pump TSS (mg/l) Current speed (cm/s) (o 2004, x 2005)
TSS vs. speed TSS vs. Speed Red = height above bed < 1 m Resuspension influence Pump TSS (mg/l) Biology/floc influence Current speed (cm/s) (o 2004, x 2005)
Along axis UMCES Data: D50 depends on location, elevation and TSS.
Along axis Positively correlated in z Inversely correlated in z UMCES Data: D50 depends on location, elevation and TSS. Two distinct populations indicated: (i) suspended, (ii) biology/flocs
Shell at km 35 Mud at km 90 Sand at km 20
August 2004 September 2005
August 2004 September 2005
August 2004 September 2005
August 2004 September 2005
August 2004 8 8
September 2005 70 9 8
September 2005 95 95
Conclusions: -- Two suspended populations exist: (1) inorganic, resuspended, denser with size positively correlated to mass concentration; (2) organic, advected, less dense with size negatively correlated to mass concentration and associated with stratification. -- Bed types are regionally and locally diverse, dominated by shells, sand or mud. Fraction of mud content drives other properties like water and organic content. Eh is a useful indicator of “fresh”, easily resuspended mud. -- Data is available to others and has already been passed on to other groups.