Download
1 / 22
220 likes | 347 Vues
This report details the second-day activities of the IDAPP meeting, focusing on the Cosmic Microwave Background Radiation (CMBR) and spectral distortions. It introduces the enhanced KYPRIX numerical code, developed to simulate primordial physical processes affecting thermodynamic equilibrium in CMBR. Key topics include the new IRAS map release, analysis of angular power spectrum, and the implications of foreground emissions on CMBR observations. The findings contribute to understanding reionization effects and improving cosmological models, aided by precise simulations of CMBR phenomena.

E N D
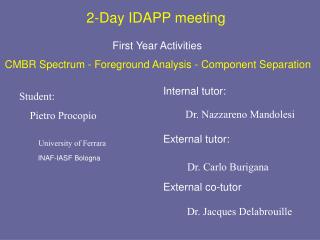
First Year Activities 2-Day IDAPP meeting CMBR Spectrum - Foreground Analysis - Component Separation Internal tutor: Student: Pietro Procopio Dr. Nazzareno Mandolesi INAF-IASF Bologna External tutor: University of Ferrara Dr. Carlo Burigana External co-tutor Dr. Jacques Delabrouille
Brief summary CMBR and spectral distortions: a precise numerical code CMBR and foregrounds A new release of the IRAS map: IRIS and angular power spectrum analysis Component Separation: the stage in Paris Conclusion and prospectives
Anisotropies Angular power spectrum Example: Polarization Scattering Thomson of radiation with quadrupole anisotropy generates linear polarization P 2 = Q 2 + U 2 Spectrum Photon distribution function Cosmic Microwave Background Radiation
CMBR Redshift T0 = 2.725 ± 0.002 °K (Mather et al. 1999) Dimensioneless frequency SPECTRUM Has the CMBR a black body spectrum?
In the primordial universe some processes can lead the matter-radiation fluid out of the thermal equilibrium (energy dissipation because of density fluctuations,Physical processes out of the equilibrium, radiative decay of particles, energy release related to the first stages of structures formation, free-free distortions) The photon distribution function isn’t a Planckian one An extremely precise fortran based code, able to simulate the effects of the primordial physical processes that can affect the thermodynamic equilibrium of the CMBR KYPRIX Spectral distortions The Kompaneets equation in cosmological contest provides the best tool to compute the evolution of the photon distribution function, but a numerical code is needed!
KYPRIX Input parameters a)cosmological par. b)integration par. MAIN PROGRAM Initialization of the solution vector U FUNCTION D03PCF For specific phys. quant. Cosmic exp Subroutine for boundary cond. in point A Subroutine PDEDEF Discretization of the Kompaneets Discretization in the x axis Increasing time y Output files (,t) Integral quan. Computation of the rates of the physical processes Subroutine for boundary cond. in point B How does it work?
KYPRIX’ update(s) ‘90 first KYPRIX release by Carlo Burigana 2004-2005 update related to the NAG libraries* sensitivity e efficiency increased** introduction of the cosmological constant** 2006 CPU platform transfer (still in progress) activity update related to the relative abundances of H and He introduction of the ionization fraction of e- * Updating a numerical code for the solution of the Kompaneets equation in cosmological context, P.Procopio and C.Burigana, INAF-IASF Bologna, Internal Report, 419; **Accuracy and performance of a numerical code for the solution of hte Kompaneets equation in cosmological context, P.Procopio and C.Burigana, INAF-IASF Bologna, Internal Report, 420;
today BIG BANG z zterm zBE z zric Superposition of black bodies Bose-Einstein like spectrum where with µ function of X Cosmological applications Primordial distortions Free-free distortions Late distortions Related (mainly) to the reionization history of the universe Cosmological application of a numerical code for the solution of the Kompaneets equation, P.Procopio and C.Burigana, INAF-IASF Bologna, Internal Report, 421;
Cosmological application Ωm = 1 Ω = 0.73 = 0 Ωm = 0.29 Ω One of the rapresentative cases Distortions dued to reionization of the universe at low redshifts
Nowday, the most precise measurements related to the parameters of the standard model (of the universe) are those realized by the NASA satellite WMAP • optical depth of the universe =0.09±0.03 (3-years WMAP data) Effects of a reionization are visible in all the properties of the CMBR: --- Temperature anisotropies suppression at high multipoles* --- gain of power in T-E cross-correlation PS and in the E and B modes mainly at low and middle multipoles --- raising of free-free and compotonization like distortions in the spectrum Given that, we need a performing tool able to simulate the stages of evolution of the reionization as better as possible not only for effects related to the anisotropies, but also for what concern the CMBR spectrum *Planck-LFI scientific goals: implications for the reionization history L.Popa, C.Burigana, N.Mandolesi,…,P.Procopio,et. al., Publ. By New Astronomy Reionization
Galactic foregrounds From radio to IR Synchrotron emission Free-free emission Dust emission + anomalus component + dark matter annihilation + diffuse emission with origin in the solar system (ZLE) + discrete components CMBR and Foregrounds 2 main classes Extragalactic foregrounds From radio to far-IR Radio sources - Flat and steep spectrum AGN Far-IR galaxies Dust emission (primordial galaxies) SZ effect
d≈nm emission at 6-60 m d≥0.1 m emission at >100 m 2 components model Typical spectrum is a modified BB: I(,Td)≈ B(,Td) ≈ +2in RJ regime Thermal emission with ≈1; FIRAS,WMAP ≈2 Diffuse morphology in our Galaxy Detection and characteristic frequency ranges H region - Survey IR and far-IR Dust emission dominates at 70 GHz, both in temperature and polarization The dust emission
The Infrared Astronomical Satellite (IRAS) Impact on many areas of modern astrophysics It revealed the ubiquity of infrared cirrus that are a spectacular manifestation of the interstellar medium complexity but also an important foreground for observational cosmology With the forthcoming Planck* satellite there is a need for all-sky complementary data sets with arcminute resolution that can bring informations on specific foreground emissions that contaminate the CMB radiation With its ~4' resolution it matches perfectly the high-frequency bands of Planck* * The Low Frequency Instrument on board the Planck satellite: characteristics and performance L.Valenziano, M.Sandri, G.Morgante,…..,P. Procopio, et. al., Publ. By New Astronomy * The Planck LFI RCA Flight Model test campaign L.Terenzi, F.Villa, A.Mennella,…,P.Procopio,et. al., Publ. By New Astronomy
The IRIS maps It is a new generation of IRAS images It benefits from a better zodiacal light subtraction, from a calibration and zero level compatible with DIRBE, and from a better destriping Main features of the IRIS data
Tests The aim of the analisys is to get a better knowledge of the statistical properties of this component of the foregrounds that affect the measurement of the cosmic signal About the first release of the IRIS maps… • Not in galactic coordinates • Covering the 98% of the sky, extended to 100% using DIRBE data set at frequencies of interest • Loss of power when rotating from equatorial coord. to galactic (not related to the map itself) • Residuals of ZLE after its subtraction (still present)
We started with computing the angular power spectrum of the map in several cases of Galactic cut Maps: in Galactic coord. Nside = 1024 resolution 4’ MJy/sr Tests Tools: IDL + HEALPix fortran & IDL facilities + anafast • Galactic cut at different |b| (with 2 different method) • “Galactic keep” at different |b| • Separeted APS for north and south emisphere, each of Them at different |b| • WMAP Galactic masks • Comparison with between the 100 m map and the Schlegel map
B cut 30 Cl of the map with cut At |b|=60° Some APS Angular power spectrum of the 100µm map with a Galactic cut equal to |b|=5° Same as above, But with a cut |b|=60°
After the tests The target is to reach a good knowledge of the statistical properties of this component of the galactic foreground. Knowing correlation function, behaviour of the angular power spectrum of different patches of the sky is useful in understanding how to model (maybe a bit better) the dust emission properties across the sky, i.e. his behaviour with respect the galactic latitude. Then, performing local analysis one can find out cleaner zones of the sky, where the contamination of this component is less prominent, with clear advantages for observational sessions.
Component Separation Signals and images contain contributions from several components or sources. Component separation consist in separating the emission of interest from all the other components present in the data set The most popular CS model in CMB analysis is the linear mixture: all components are assumed to have an emission which can be decomposed as the product of a spatial template indipendent of the frequency of observation and of a spectral emission law which does not depend on the pixel.
The Spectral Matching method Blind separation and SMICA Multi Detector Multi Component Analysis Our analysis The aim is that to recover the CIB from a set of infrared maps, to separate and recognize the Galactic dust emission, to fix problems related to residual in ZLE subtraction. Possibly to realize a better destriping of IRAS maps. Our data set IRIS maps (12, 25, 60, 100 micron) IRAS maps (by which the IRIS maps were derived) DIRBE (only the channels with these fequencies)
Preliminary analysis Comparison of the zero level between IRAS maps and DIRBE maps Checking for holes in the maps Finding out relevant differencies between maps of different frequency Repixelization of te DIRBE data set … Starting using SMICA 4 frequencies + 2 (then 3) different map sets = 8 (12) maps Sources detection and subtraction Finding the right masking map for all the maps
Conclusions Spectral distortions are not simple to detect, the signal is very low and to get the sensitivity needed it is required a fine calibration with a reference BB and great control of systematic. A study about observational experiment from the Moon is in progress: no atmosphere = great results from ground based experiments. With KYPRIX and other codes like CMBfast we have a complete set of instruments to probe the primordial universe in a theoretical way. Identifying and mapping the emission of all the astrophysical processes that a Planck like satellite will detect is one of the most important step in the exploitation of CMB data analysis. We are going into the era of high precision cosmology, so we have to know in the best possible way how to deal with contamination generated by our own Galaxy. The work on component separation is about T, but new cosmology is also pointing to the polarization signal of the CMBR: we’ll stay tuned!