Internet sources
Web-based genome browser using AJAX and canvas technologies T.F.Valeev 1,2 , N.Tolstykh 1 , F.A.Kolpakov 1,3 1 Institute of System Biology, Novosibirsk, Russia, 2 Institute of Informatics Systems, SB RAS, Novosibirsk, Russia

Internet sources
E N D
Presentation Transcript
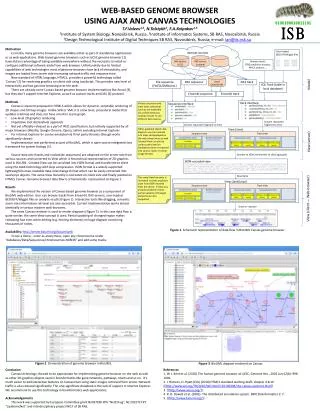
Web-based genome browserusing AJAX and canvas technologies • T.F.Valeev1,2, N.Tolstykh1, F.A.Kolpakov1,3 • 1Institute of System Biology, Novosibirsk, Russia, 2Institute of Informatics Systems, SB RAS, Novosibirsk, Russia • 3Design Technological Institute of Digital Techniques SB RAS, Novosibirsk, Russia; e-mail: lan@iis.nsk.su Internet sources • Motivation • Currently many genome browsers are available either as part of standalone applications or as web-applications. Web-based genome browsers such as UCSC genome browser [1] have distinct advantage of being available everywhere without the necessity to install or configure additional software aside from web-browser. Unfortunately due to limited capabilities of web technologies most of genome browsers have lack of interactivity, and images are loaded from server side increasing network traffic and response time. • New standard of HTML language, HTML5, provides a powerful technology called ‘Canvas’ [2] for rendering graphics on client side using JavaScript. This provides new level of interactivity and fast genome browsing over the web. • There are already some Canvas-based genome browser implementations like AnnoJ [3], but they don’t support Internet Explorer, as well as custom tracks and DAS [4] protocol. • Methods • Canvas iselement proposed in HTML5 which allows for dynamic, scriptable rendering of 2D shapes and bitmap images. Unlike SVG or VML it is a low level, procedural model that updates a bitmap and does not have a built in scene graph. • Low-level 2D graphics rendering • Imperative (not declarative) approach • Not yet officially released as a part of W3C specification, but natively supported by all major browsers (Mozilla, Google Chrome, Opera, Safari) excluding Internet Explorer • For Internet Explorer 6+ can be emulated via third-party libraries (though works significantly slower) • Implementation was performed as part of BioUML, which isopen source integrated Java framework for system biology [5]. • Source data sets (tracks and nucleotide sequences) are obtained on the server side from various sources and converted to View which is hierarchical representation of 2D-graphics used in BioUML. Created View can be serialized into JSON format and transferred to client using the AJAX technology with Gzip compression. JSON format is a widely-supported lightweight human-readable data-interchange format which can be easily converted into JavaScript objects. The same View hierarchy is recreated on client side and finally painted on HTML5 Canvas. Genome browser data flow is schematically represented on Figure 1. • Results • We implemented the version of Canvas-based genome-browser as a component of BioUML web edition. User can browse tracks from Ensembl, DAS-servers, user-loaded BED/GFF/Wiggle files or analysis results (Figure 2). Interactive tools like dragging, semantic zoom sites information retrieval are also accessible. Current implementation works almost identically in various modern web-browsers. • The same Canvas renderer is used to render diagrams (Figure 3). In this case data flow is quite similar: the same View concept is used. Partial updating of changed region makes redrawing fast even when editing (e.g. moving elements) on huge diagram containing thousands of nodes. • Availability: http://server.biouml.org/bioumlweb • To see a demo - enter as anonymous, open any chromosome under “databases/Data/Sequences/chromosomes NCBI36” and add some tracks. User-loaded BED/GFF/Wiggle files chr1 233604 233639 chr1 559767 559802 chr1 742600 742635 chr1 742600 742635 … DAS source: UCSC DAS source: Ensembl … Analysis result:TFBS prediction analysis, MACS analysis, … LocalEnsembl DB File sequence (FASTA/EMBL/etc.) DAS sequence DAS track Model SQL Track (table in local database) Ensembl sequence Ensembl track Various sequence and track (sites collection) sources are accessible via unified interfaces making it easier to use different data sources. Sequence interface … Track interface Convert requestedfragment to View Convert requested fragment to View Other graphical objects like diagrams can be rendered into View and displayed on the web using Canvas as well. Created View can also be used to paint itself on standalone client or exported into various raster or vector image formats. View (JavaScript) View (Java) View (server) Sequence view Sequence view Track view Track view CompositeView (ruler) CompositeView (ruler) TextView (sequence) ACGTACGTACGT… TextView (sequence) ACGTACGTACGT… CompositeView (site) CompositeView (site) CompositeView (site) CompositeView (site) … … LineView LineView BoxView (site body) BoxView (site body) TextView (site name) TextView (site name) BoxView (site body) BoxView (site body) TextView (site name) TextView (site name) Serialize to JSON and transfer to client (gzipped) LineView LineView LineView LineView … … JSON-encoded view{"children":[{"children":[{"pen":{"color":[0,0,0,255],"width":1},"height":54,"trackWidth":665,"width":669 ,"class":"TrackBackgroundView","type":"0","y":10,"x":-2},{"model":"3596179","children":[{"pen":{"color":[ 0,255,0,255],"width":5},"y1":31,"y2":31,"class":"LineView","x2":664,"type":"0","x1":1},{"alignment":0,"te xt":"...dust...","font":{"color":[0,0,0,255],"font":["Serif",0,12]},"class":"TextView","type":"0","y":23, "x":313}],"class":"CompositeView","type":"20"},... Deserialize The same View hierarchy is recreated in client JavaScript code from JSON received from the server. If View was already created on client, partial updates of changed elements are alsosupported. View (client — Web-browser) Draw to <canvas> Figure 1. Schematic representation of data flow in BioUML Canvas genome browser Figure 2. Demonstration of genome browser in BioUML. Figure 3. BioUML diagram rendered on Canvas. Conclusion Canvas technology showed to be appropriate for implementing genome browser on the web as well as other 2D-graphics objects used in bioinformatics like gene networks, pathways, charts and so on. It’s much easier to add interactive features on Canvas than using static images retrieved from server. Network traffic is also reduced significantly. The only significant drawback is the lack of support in Internet Explorer. We recommend to use this technology in bioinformatics web-applications. Acknowledgements This work was supported by European Committee grant №037590 FP6 “Net2Drug”, № 202272 FP7 “LipidomicNet” and interdisciplinary project №17 of SB RAS. References 1. W. J. Kent et al. (2002) The human genome browser at UCSC, Genome Res., 2002 Jun;12(6): 996-1006. 2. I. Hickson, D. Hyatt (Eds) (2010) HTML5 standard working draft, chapter 4.8.10 {{http://www.w3.org/TR/2010/WD-html5-20100304/the-canvas-element.html}} 3. {{http://www.annoj.org/}} 4. R. D. Dowell et al. (2001). The distributed annotation system, BMC Bioinformatics 2: 7. 5. {{http://www.biouml.org/}}