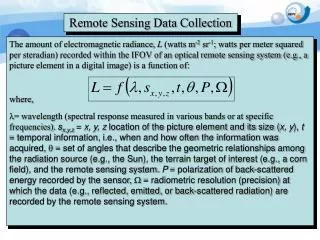
Remote Sensing and Internet Data Sources
Remote Sensing and Internet Data Sources. Unit 3: Module 12, Lecture 1 – Satellites and Aerial Photography. Sources of spatial and environmental data. Remotely sensed data (raster data) Airphoto Satellite Digital data repositories - (Module 14) On-line Electronic media


Remote Sensing and Internet Data Sources
E N D
Presentation Transcript
Remote Sensing and Internet Data Sources Unit 3: Module 12, Lecture 1 – Satellites and Aerial Photography
Sources of spatial and environmental data • Remotely sensed data (raster data) • Airphoto • Satellite • Digital data repositories - (Module 14) • On-line • Electronic media • GPS data (point data) - (Module 16) • Input of hard-copy data – (Module 16) • Digitizing (vector data) • Scanning (raster data)
Sources of data: remote imagery • Satellite imagery • Digital imagery • Numerous satellites with different levels of resolution • SeaWIFS • SPOT • LANDSAT • AVHRR • MODIS MODIS image of Hurricane Isobel off US East Coast, September 17, 2003
SeaWIFS image of California FiresOct 26, 2003 SeaWIFS • 1 km res • Daily • NASA
QuickBird image of Grand Prix Fire, CAOctober 27, 2003 60 cm resolution natural color image
QuickBird image of Grand Prix Fire, CAOctober 27, 2003 – detail view
GOES Weather Satellite • Geostationary orbit 36,000 km above earth • East and West satellites provide complete coverage • High frequency (up to 15 min intervals) • Visible • Infrared • Water vapor
Resolution in Satellite imagery • Satellite sensors vary in the different types of resolution • Spatial resolution = pixel size • Spectral resolution = # of bands, band width • Radiometric resolution = data intensity in band • Temporal resolution = frequency of sampling
Pixel resolution • 1 km AVHRR classification of forest land • Relatively coarse • Broad picture of landscape • Regional assessment • 30 m LANDSAT classification of forest and land use • Much finer detail • Local assessment
Spectral Resolution: Number of bands • “Bands” are regions of the electromagnetic spectrum sampled by the sensor • Visible light (RGB) • Near and far infrared • Other frequencies • More bands = more information to classify land features • Multispectral • Hyperspectral – very fine divisions of the spectrum
Image classification • Remote sensing satellites and aircraft-borne sensors simply record information on spectral reflectance • The science of “Image Classification” makes these volumes of information useful • Goal – develop a relationship between the “spectral signature” and a classification of the landscape • Coarse: forest, ag, urban • Fine: aspen forest, corn, high-density residential
Differences in “spectral signatures” are used to classify land features
Sources of data: remote imagery Aerial photography and imagery • Film technology • Oblique • Vertical • Black and White • Color Infrared - common in agriculture and forestry applications • Usually interpreted as map polygons (vector format) B & W photo Photointerpreted Oblique photo Color IR
Aerial photography and imagery Digital imagery Images from non-photographic sensors Usually classified by computer algorithms Multispectral or hyperspectral available Sources of data: remote imagery AISA hyperspectral sensor Hyperspectral crop circles courtesy CALMIT labs, NE
Hyperspectral data • A large number of spectral bands (30-100s) • Capable of discriminating very fine differences in color (reflectance) • Used to map aquatic veg, Chlorophyll content, turbidity, many other attributes Hyperspectral image of Kingsbury Creek – image acquired by Nebraska Space Grant for WOW
Common aerial photography: DOQs • USGS Digital Orthophoto Quad • Natl’ Aerial Photography Program (NAPP) • Cloud-free • 20000 ft altitude • B&W or CIR • Each photo 5.5 x 5.5 mi • Began in 1987 • 5-7 yr photography cycle • Big files! • Med resolution – 40 Mb • High res. – 117 Mb-1.3 Gb Color-infrared NAPP photo San Diego, CA
Common aerial photography: FSA DOQs • Farm Services Administration (FSA) Color Orthophotos • 1 m resolution natural color imagery • Summer – leaf on • Available in quarter quads • Available as unclassified imagery, but very good resolution FSA photo – 1:7,000 scake Houston Co, MN
Sources of data: scanned imagery • Scanning and rectification (raster data) • Hard copies of airphotos or other images can be scanned at high resolution (600-800 dpi) • These typically need to be georectified to use with other spatial layers (correct for camera lens abberations, plane tilt, etc) • Control points (known locations on ground) are used to georectify image • ImageWarp or other software used to “stretch” image to fit control points • Image can then be used as a backdrop for other spatial data layers, or for classification
Summary • Classified data from satellites are useful for land use planning, but the efforts involved in classification mean these are updated relatively infrequently (years) • Real-time satellite data (AVHRR, SeaWIFS, GOES) are typically unclassified, but can be interpreted visually with relatively little effort • Aerial photographs provide high resolution coverage (meter to submeter), and many on-line sources of recent photography exist