Model and remote-sensing data
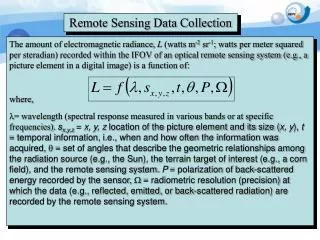
Model and remote-sensing data. SOEE1400 Lecture 5. (upper air obs). Synoptic Analysis. A simple analysis based on the observed synoptic data provides an instantaneous snapshot of the state of the atmosphere Problems: Very scattered observations…excessive interpolation in data sparse regions

Model and remote-sensing data
E N D
Presentation Transcript
Model and remote-sensing data SOEE1400 Lecture 5
(upper air obs) ENVI 1400 : Meteorology and Forecasting
Synoptic Analysis • A simple analysis based on the observed synoptic data provides an instantaneous snapshot of the state of the atmosphere • Problems: • Very scattered observations…excessive interpolation in data sparse regions • Bias by individual measurements • Instrument error • Sample unrepresentative of general conditions ENVI 1400 : Meteorology and Forecasting
Model(Equations) Analysis Forecast Observations Model Analyses • The use of numerical models in an analysis-forecast cycle introduces an extra dimension – time. ENVI 1400 : Meteorology and Forecasting
ADVANTAGES: • Data from past observations affects present analysis (4D variable assimilation) • Regions without observations are handled more realistically because information from past observation upwind propagates into data-sparse region. • Raw observations are smoothed during interpolation onto model grid – helps remove bias from non-representative measurements. • LIMITATIONS • Generally better than just sparse observations, BUT it is not real data – errors are very hard to assess. ENVI 1400 : Meteorology and Forecasting
(upper air obs) ENVI 1400 : Meteorology and Forecasting
REANALYSIS • ECMWF (and NCEP in USA) conduct reanalyses of past forecasts of past weather. • Not all observations are available in time to be included in regular forecast cycle • Allows time for extra quality control and corrections to be applied • ECMWF: • ERA-15 : 1978-1993 • ERA-40 : 1958-1997 ENVI 1400 : Meteorology and Forecasting
Reanalysis data are used for: • Climatological studies • As model initialization fields (for research) in data-sparse regions or upper atmosphere • Atmospheric chemistry modelling studies • To provide boundary conditions for regional-scale modelling studies (Research) ENVI 1400 : Meteorology and Forecasting
Global models divide the world into a grid, data is held on the intersections of the grid. Figure shows a 10 grid MetOffice global model uses a grid of approximately 0.8 longitude by 0.5 latitude UK represented by ~10x20 grid points (~60km spacing) MODELS ENVI 1400 : Meteorology and Forecasting
MetOffice mesoscale model – higher resolution, limited area model. Uses the global model to provide initialization and boundary conditions. 0.11° by 0.11° grid: approximately 11km resolution. 38 vertical levels in both global and mesoscale models, spacing increases with altitude. ENVI 1400 : Meteorology and Forecasting
Westerly wind Numerical weather prediction. Liquid water in g / kg Leeds
Model resolution is too low to resolve: • Individual clouds, even large thunderstorms. • Full details of topography • Details of changes of surface type • Processes on scales smaller than the grid must be parameterized. Vale of York North Sea Pennines ENVI 1400 : Meteorology and Forecasting
Parameterization • Parameterization is the simplification of a complex physical process in terms of parameters that are available to the model, or readily measured. • Models must use parameterizations of processes that : • Take place on scales smaller than the model grid • Involve parameters that are not explicitly defined in the model ENVI 1400 : Meteorology and Forecasting
First meteorological satellite: TIROS-1 (Television Infrared Observation Satellite), launched April 1, 1960. Satellite Data TIROS-1 image of tropical storm in Pacific, April 1960. ENVI 1400 : Meteorology and Forecasting
Geostationary satellites: remain above the same spot on the Earth’s surface – orbital period = period of rotation of earth. Approximately 36000km above surface. 5 or 6 satellites spaced to give coverage of whole earth. e.g: METEOSAT (EU), GOES series (USA) Polar Orbiting: Orbit is oriented north-south (inclined slightly). Often sun-synchronous. Orbital period ~100 minutes. Pass over different part of surface on every orbit – passes over same spot at irregular intervals. Low-altitude (700-800km) allows much higher resolution imagery than geostationary satellites. See: http://www.sat.dundee.ac.uk, http://www.goes.noaa.gov/ ENVI 1400 : Meteorology and Forecasting
NOAA-15 polar orbiter ground track for September 28 2005. ENVI 1400 : Meteorology and Forecasting
Visible imagery (B/W and true colour): “like a photograph from space” – interpretation is intuitive. Thin cloud (particularly cirrus) can be transparent. No use at night. Infrared imagery (multiple wavelengths in IR) AVHRR imagery from Dundee archive: CH2 = visible, CH4 = thermal infrared. Water vapour concentration (integrated through full depth of atmosphere) Satellite data … main channels ENVI 1400 : Meteorology and Forecasting
Examples … ENVI 1400 : Meteorology and Forecasting
Sea Surface Temperature Ocean Chlorophyll content Land use Wind speed over ocean from synthetic aperture radar (SAR) Chemistry (O3, NO2,…) Satellite data … others … ENVI 1400 : Meteorology and Forecasting
Visible imagery from METEOSAT ENVI 1400 : Meteorology and Forecasting
Infra red imagery from METEOSAT ENVI 1400 : Meteorology and Forecasting
QuikScat winds derived from SAR measurements(includes 22 hours of data) ENVI 1400 : Meteorology and Forecasting
MODIS sea surface temperature -2 C 35 C ENVI 1400 : Meteorology and Forecasting
Most satellites look vertically downwards – data is either: Vertical integral through atmosphere (e.g. water vapour) Represents value at some upper altitude (cloud top) Surface value In latter two cases, it can sometimes be difficult to determine vertical location e.g: distinguishing cloud from snow/ice, low cloud temperature from surface temperature. Vertical profiles of some quantities can be obtained via limb-sounding – looking at the edge (limb) of the visible disk of earth, i.e. sideways through the atmosphere. Vertical resolution is good Horizontal resolution is poor Particularly useful for chemical measurements, where certain wavelengths of light are absorbed by known chemical species. Vertical profiles from satellites ENVI 1400 : Meteorology and Forecasting
Absorption of light by particular molecular species allows a vertical profile of their concentration to be determined ENVI 1400 : Meteorology and Forecasting
Active sensors transmit a beam of radiation which is reflected from atmospheric constituents (clouds, rainfall, aerosol …) back to a sensor on the satellite. Examples: TRMM (space-borne rainfall radar) – “sees” rainfall within cloud. http://trmm.gsfc.nasa.gov/ CloudSat (space-borne cloud and rainfall radar) CALIPSO (space-borne lidar) – sees aerosol, thin cirrus and cloud-top. Satellite data: active sensors The A-train (NASA) ENVI 1400 : Meteorology and Forecasting
TRMM ENVI 1400 : Meteorology and Forecasting
CloudSat Meteosat CloudSat Courtesy of Thorwald Stein, U. Reading ENVI 1400 : Meteorology and Forecasting
CALIPSO lidar data1241 UTC 25/06/2006(from Cuesta et al., JGR) 7 g/kg de water vapor Cloud in white ECMWF Isentropes Monsoon Horizontal wind (arrow up=North) Ground mask (Signal attenuation)
Summary • Model analysis-forecast cycle provides a means of smoothing measurements, and interpreting them in a common framework. • Satellites and radar provide many different measurements – increasing variety and quality with time. ENVI 1400 : Meteorology and Forecasting