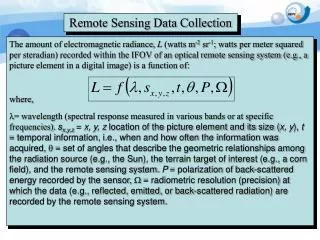
REMOTE SENSING DATA
REMOTE SENSING DATA. Markus Törmä Institute of Photogrammetry and Remote Sensing Helsinki University of Technology Markus.Torma@hut.fi. ROLE OF REMOTE SENSING. Inventory of larger areas Determination of surface properties Determination of surface topography


REMOTE SENSING DATA
E N D
Presentation Transcript
REMOTE SENSING DATA Markus Törmä Institute of Photogrammetry and Remote Sensing Helsinki University of Technology Markus.Torma@hut.fi
ROLE OF REMOTE SENSING • Inventory of larger areas Determination of surface properties Determination of surface topography • Monitoring environmental change • Visualization
SATELLITE IMAGES Landsat • Enhance Thematic Mapper 29.1.1999 • Thematic Mapper 1.9.1990 • MultiSpectral Scanner 12.7.1983 and 27.6.1975 Quickbird • 15.7.2003 CORONA • 3 images taken 28.6.1966 and 22.1.1967
LANDSAT ETM • Image size 185 x 185 km2 • 6 visual and near-infrared channels (spatial resolution30m) 1. 0.45 - 0.52 m 2. 0.52 - 0.60 m 3. 0.63 - 0.69 m 4. 0.76 - 0.90 m 5. 1.55 - 1.75 m 7. 2.08 - 2.35 m • Channel 6 thermal infrared: 10.4 - 12.5 m (60m) • Panchromatic channel: 0.50 - 0.90 m (15m)
Channels can be combined to form color images: true color (RGB: 321) and false color (RGB 741)
Effect of spatial resolution: detail from panchromatic (15m) and color image (30m)
LANDSAT TM • Similar than ETM • ETM 741 29.1.1999 vs. TM 741 1.9.1990
LANDSAT MSS • 4 channels • MSS 12.7.1983 and MSS 27.6.1975
LANDSAT • Sandy soils: ch7 / ch1 • Sandy soils 1.9.1990, sandy soils 29.1.1990 and change image (Red: more sand in 1999, green: more sand in 1990) NOTE: Images have been taken during different seasons, therefore the change can be due to seasonal effects like changing soil moisture
LANDSAT • Satellite image as base map • Landsat ETM pan and archaeological sites Colours: Red: Stone cairn (s) / tumulus / tumuli Blue: Shepherd´s / hunter´s rock shelter Bright green: Stone heap(s) / Muslim grave(s) Beige: Abandoned Bedouin camp / tent Orange: Open accumulated pottery sherd concentration Pink: Rectangular structure
QUICKBIRD • 4 channels (blue, green, red, NIR, 2.44m), PAN 0.61m • Image size 16.5 x 16.5 km2
CORONA • Panchromatic film which is digitized • Image size 188 x 14 km2 on the ground • Spatial resolution 2m in the best case
DIGITAL ELEVATION MODELS STRM-DEM • Shuttle Radar Topography Mapping mission 2000 • Based on SAR interferometry • 30m pixel DEM covers area partially Provided by DLR • 90m pixel DEM whole area ASTER-DEM • Optical ASTER-instrument in Terra satellite • 30m pixel
DIGITAL ELEVATION MODELS • Areal coverage of different DEMs • Red: SRTM-DEM, 30m pixel • Green and Blue: ASTER-DEM, 30m pixel • Other areas: SRTM-DEM, 90m pixel
VISUALIZATION • Unsupervised classification of ETM + DEM
VISUALIZATION • MSS 1983 + SRTM-DEM 90m
FREE DATA Global Land Cover Facility • University of Maryland • http://glcf.umiacs.umd.edu/ • Landsat ETM, TM, and MSS images • SRTM-DEM 90m Earth Observing System data Gateway • United States Geological Survey • http://edcimswww.cr.usgs.gov/pub/imswelcome/ • ASTER-DEM