Download
1 / 12
120 likes | 124 Vues
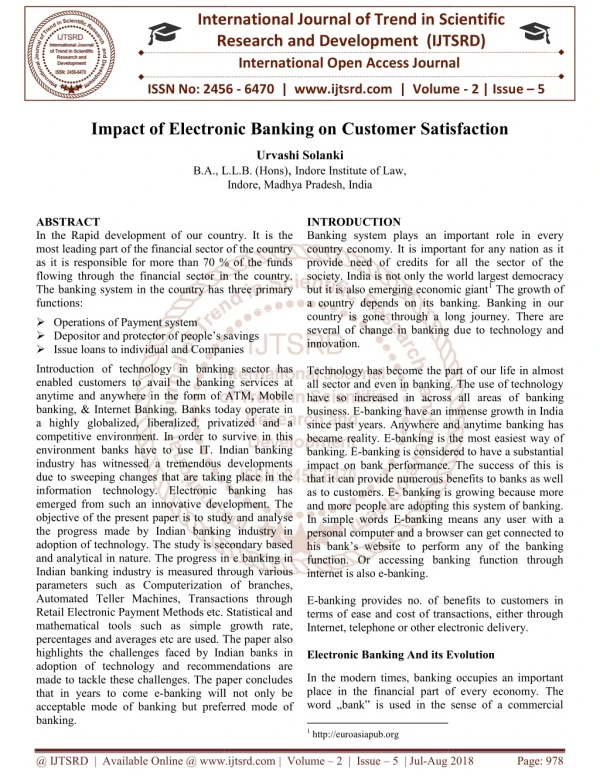
Objective Perceived service quality is the most important predictor of customer satisfaction. The purpose of this study was to investigate the impact of the service quality on the overall satisfaction of customers and their repurchase intentions in hotels of northern India. Method This cross sectional study was conducted in the year 2016. The study's sample consisted of 663guests who were staying in hotels of northern India, by using stratified random sampling. A questionnaire was used for data collection contacting 36 items 26 items about service quality and 5 items about overall satisfaction and 5 items about repurchase intentions and its validity and reliability were confirmed. Data analysis was performed using descriptive and statistical analysis. Result this study found a strong relationship between service quality and customer satisfaction as well as customer satisfaction and repurchase intentions. Conclusions Constructs related to tangibility, empathy, assurance had the most positive impact on overall satisfaction of customers. Managers and owners of hotels should give the services as per the requirements of the customers. Anjum Ara | Abid Shafi Zargar "An Empirical Study of the impact of Service Quality on Customer Satisfaction and Repurchase Intentions in Hotels' of Northern India" Published in International Journal of Trend in Scientific Research and Development (ijtsrd), ISSN: 2456-6470, Volume-2 | Issue-3 , April 2018, URL: https://www.ijtsrd.com/papers/ijtsrd12805.pdf Paper URL: http://www.ijtsrd.com/management/marketing/12805/an-empirical-study-of-the-impact-of-service-quality-on-customer-satisfaction-and-repurchase-intentions-in-hotels-of-northern-india/anjum-ara<br>

E N D
International Res Research and Development (IJTSRD) International Open Access Journal International Journal of Trend in Scientific Scientific (IJTSRD) International Open Access Journal ISSN No: 2456 ISSN No: 2456 - 6470 | www.ijtsrd.com | Volume 6470 | www.ijtsrd.com | Volume - 2 | Issue – 3 An Empirical Study of the impact of Service Quality on Customer Satisfaction and Repurchase Intentions in Hotels' of Northern India Satisfaction and Repurchase Intentions in Hotels' of Northern India Satisfaction and Repurchase Intentions in Hotels' of Northern India An Empirical Study of the impact of Service Quality on Customer An Empirical Study of the impact of Service Quality on Customer Abid Shafi Zargar Assistant Profes Assistant Professor, Abid Shafi Zargar Anjum Ara epartment of Commerce ashmir, Srinagar, India Ph.D Scholar, Department of Commerce University of Kashmir, Srinagar, India SSM College of Engineering and Technology, SSM College of Engineering and Technology, Pari.haspora, Kashmir Pari.haspora, Kashmir, India ABSTRACT Objective: Perceived service quality is the most important predictor of customer satisfaction. The purpose of this study was to investigate the impact the service quality on the overall satisfaction of customers and their repurchase intentions in hotels of northern India. Method: This cross-sectional study was conducted in the year 2016. The study’s sample consisted of 663guests who were staying in hotels of northern India, by using stratified random sampling. A questionnaire was used for data collection contacting 36 items (26 items about service quality and 5 items about overall satisfaction and 5 items about repurchase intentions) and its validity were confirmed. Data analysis was performed using descriptive and statistical analysis. Result: this study found a strong relationship between service quality and customer satisfaction as well as customer satisfaction and repurchase intent Conclusions: Constructs related to tangibility, empathy, assurance had the most positive impact on overall satisfaction of customers. Managers and owners of hotels should give the services as per the requirements of the customers. Keywords: service quality, customer Satisfaction, repurchase intentions, customer-hotel relationship Perceived service quality is the most important predictor of customer satisfaction. The purpose of this study was to investigate the impact of the service quality on the overall satisfaction of customers and their repurchase intentions in hotels of INTRODUCTION The importance of providing quality services in hospitality industry is being recognized as a way to expand and maintain a large and loyal customer base term success. As stated by Kandampully et. al., (2011), consistent quality of service creates and sustains the image of a destination which ultimately results in positive customers’ behavioral intentions. So, customers’ behavioral intention is dependent on the destinations ability to consistently deliver service quality. On the contrary, the cost of poor quality relate to lack of responsiveness to the customer, dissatisfied customers, customer complaints, adverse word of mouth communication, and dissatisfied employees (Crosby, 1979). Postma and Jenkins, (1997) also stated that quality improvement must be seriously concerned as a useful instrument in achieving competitive advantage, as a strategy to reduce uncertainty and improve the results of tality organizations. Superior customer service may, therefore, be seen as a mechanism to achieve differentiation and a competitive advantage, and so become integral to the overall direction and strategy of an organization (Brown and Swartz, 1989; The importance of providing quality services in hospitality industry is being recognized as a way to expand and maintain a large and loyal customer base for long-term success. As stated by Kandampully et. al., (2011), consistent quality of service creates and sustains the image of a destination which ultimately results in positive customers’ behavioral intentions. So, customers’ behavioral intention is depe the destinations ability to consistently deliver service quality. On the contrary, the cost of poor quality relate to lack of responsiveness to the customer, dissatisfied customers, customer complaints, adverse word of mouth communication, and di employees (Crosby, 1979). Postma and Jenkins, (1997) also stated that quality improvement must be seriously concerned as a useful instrument in achieving competitive advantage, as a strategy to reduce uncertainty and improve the results of hospitality organizations. Superior customer service may, therefore, be seen as a mechanism to achieve differentiation and a competitive advantage, and so become integral to the overall direction and strategy of an organization (Brown and Swartz, 1989; Parasuraman et. al., 1988). sectional study was conducted in the year 2016. The study’s sample consisted of otels of northern India, by using stratified random sampling. A questionnaire was used for data collection contacting 36 items (26 items about service quality and 5 items about overall satisfaction and 5 items about repurchase intentions) and its validity and reliability Data analysis was performed using this study found a strong relationship between service quality and customer satisfaction as well as customer satisfaction and repurchase intentions. Constructs related to tangibility, empathy, assurance had the most positive impact on overall satisfaction of customers. Managers and owners of hotels should give the services as per the Expectations and perceptions play a significant role in determining quality services. Generally, customers form their expectations from their past experience, friends’ advice, and marketers’ and competitors’ information and promises (Ko hospitality context, customers’ have expectations after selecting a hotel to selecting a hotel to Expectations and perceptions play a significant role in determining quality services. Generally, customers form their expectations from their past experience, friends’ advice, and marketers’ and competitors’ information and promises (Kotler, 2000). In the hospitality context, customers’ have expectations after e quality, customer Satisfaction, relationship stay stay and and that that their their @ IJTSRD | Available Online @ www.ijtsrd.com Available Online @ www.ijtsrd.com | Volume – 2 | Issue – 3 | Mar-Apr 2018 Apr 2018 Page: 2656
International Journal of Trend in Scientific Research and Development (IJTSRD) ISSN: 2456-6470 perception/satisfaction levels during and after their staying period are functions of their expectations (Korzay and Alvarez, 2005; Yoon and Uysal, 2005; Huh, et. al., 2006). According to Vazquez (2001), customers’ perceptions of service quality result from a comparison of their before-service expectations with their actual service experience. Madhavaiah, et. al., (2008) described that service quality is a function of expectation and performance as performance below expectation (obtaining a negative score) leads to a perception of low service quality, while exceeding expectation (obtaining a positive score) leads to a perception of high service quality. After comparing the expectations with perceived performance of the hotels, hotels’ service quality can be considered (Korzay and Alvarez 2005). In this context, service quality offered by a hotel can be better understood by comparing expectations and perceptions of customers regarding a hotel (Kozak et. al., 2004). accommodation service more effective and efficient. Review of Literature Service Quality Many researchers (Madanlal, 2007; Knowles, 1996 and Sunmee, 2005) traditionally agreed and accepted that service quality is a comparison between expectations with perceptions of performance. Perceived quality is the customer’s judgment about an entity’s overall excellence or superiority (Zeithaml 1987). It clearly differs from objective quality (as define by few researcher, for example, Garvin (1983) and Hjorth-Anderson (1984)). Bitner and Hubbert (1984) defined quality as the customer’s overall impression of the relative inferiority/ superiority of a firm by comparing the service user expectations with actual performance (Lewis and Booms, 1983; Groonroos, 1984). Wisniewski and Donnelly (1996) defined service quality as the extent to which a service meets customer’s needs or expectations. Customer expectations are beliefs about service delivery that function as standard or reference points against which performance is judged (Zeithaml and Bitner, 2003). Ying (1990), tried to determine the level of service quality in the Chinese hospitality industry, which includes hotels, restaurants, transportation and communication services of hotels. The results of survey shows that neither foreign customers nor Chinese customers have positive attitude toward service quality in China. Many inconvenient service factors such as inconvenience for handicapped persons, lack of cleanliness of restrooms, poor quality food inefficiency in plane and train on-time performance, problems in communication services and reservation services etc., are some of the reasons for low service quality Berry, et.al., (1985) opines that service quality stems from a comparison of what they feel service firms should offer (i.e. from their expectations) with their perception of the performance of the firm providing the services. Perceived service quality is, therefore, viewed as the degree and direction of discrepancy between customers’ perception and expectations. For example in real estate, this would be what the client is expecting from the agent in comparison to which is actually delivered by that agent. Augustyn (1998), discussed the initiatives relating to quality improvement in hospitality at international, national, regional, local and entrepreneurial levels and, used SERVQUAL model and benchmarking techniques for identifying quality improvement areas. The author revealed that current quality problems in hospitality result from operating improper hotel quality systems rather than from the lack of awareness and identified the inability of closing the hotel quality perception gap and the hotel quality control gap as the chief causes of ineffectiveness of the private sector hotel quality. Parasuraman, et al., (1985) defined service quality as: “the degree and direction of discrepancy between customers’ perceptions and expectations in terms of different but relatively important dimensions of the service quality which can affect their future behaviour”. In line with this thinking, Gronroos (1982) devoloped a model in which he contends that customers compare the service they expect with perceptions of the service they receive in evaluating service quality. Also, Smith and Houston (1982) claimed that satisfaction with service is related to confirmation or disconfirmation of expectations. They based their research on disconfirmation paradigm, which maintains that satisfaction is related to size and direction of the disconfirmation experience where disconfirmation is related to person’s initial Objectives of the Study 1.To study the impact of service quality on customer satisfaction intentions of hotel industry in northern India. 2.To suggest ways and means for improving hotel services with a view to make overall and repurchase @ IJTSRD | Available Online @ www.ijtsrd.com | Volume – 2 | Issue – 3 | Mar-Apr 2018 Page: 2657
International Journal of Trend in Scientific Research and Development (IJTSRD) ISSN: 2456-6470 expectations. Similarly Lewis and Booms (1983) stated that “service quality is a measure of how well the service level delivered matches customer expectations. Delivering quality service means confirming to customer expectations on a consistent basis”. Examination of these above writings and other literature on service marketing suggested three underlying themes: (2003) identified service quality as a measure to assess service performance, problems, manage service delivery, and as a basis for employee and corporate rewards. The study of service quality is critical for the success and survival in today’s competitive business environment (Fynes and Voss, 2001) as service quality has been recognized as a strategic tool for attaining efficiency in Backman and Veldkamp (1995) stated that quality of service is an essential factor involved in a service provider’s ability to attract more customers. Also, providing high level of quality service has become the selling point to attract customer’s attention and is the most important driver that leads to satisfaction (Angelova and Zekiri, 2011). Besides, Ostrowski, et., al., (1993) mentioned that service quality is a way of thinking about how to satisfy customers so that they hold positive attitudes toward the service they have received. According to Berry et. al., (1988), service quality has become a significant differentiator and the most powerful competitive weapon that organizations want to possess. Its importance to firms and customers is unequivocal because of its benefits that contribute to market share and return on investment (Parasuraman, et al. 1985). The delivery of high quality service to customers offers firms an opportunity to develop unique position in the minds of the target customers which results in; greater customer satisfaction and behavoural intention, greater recommend to others, reduction in customer complaints, improvement in customer retention rates; and, contributes to long-term profits of a business (Berry et. al., 1994; Scheneider and Chung, 1996; Magi and Julander, 1996; Lee et. al., 2000). Consequently, understanding and maintaining quality should be the main concerns of businesses today. Both manufacturing companies and service firms should be highly concerned with providing quality and delivering quality service (Akan, 1995). diagnose service Service quality is more difficult for the customer to evaluate than goods quality. Service quality perceptions result from a comparison of customer expectations with actual service performance. Quality evaluations are not made solely on the outcome of the service; they also involve evaluations of the process of service delivery. business performance. Most writers agree that customer’s expectations are rarely concerned with single aspect of the service package, but rather many aspects. Gronroos (1985), for example, investigates an attitudinal construct, resulting from the discrepancy between customer’s expectations and their perceptions of the quality of service actually delivered (Mangold and Emin, 1990). Furthermore, when decision makers in service organization, such as banks and hospitals are asked what constitutes quality in their service, the answers are less well-defined and tend to vary more from individual to individual. measurement, monitoring and improvement of quality become an elusive task. While the concept of service quality is difficult to define, the fact is, that both customers and service providers evaluate service quality on a daily and revolving basis (Mangoid and Emin, 1990). Consequently, the willingness to Reeves and Bednar (1994) defined service quality as excellence, value, conformance to specifications and meeting or exceeding customers’ expectations. Whereas, Lewis (1987) stated about service quality is “providing the customer with what he wants, when he wants it, and at acceptable cost, within the operating constraints of the business”, and “providing a better service than the customer expects”. Service quality can also be defined as the customers’ judgment about an entity’s overall excellence or superiority (Zeithaml 1988; Ueltschy et. al., 2004), or the extent to which a firm successfully serves the purpose of customers (Zeithaml et. al., 1990). According to Parasuraman et. al., and Bitner and Hubbert (1994), service quality is the customers’ overall impression of the relative inferiority/superiority of the organization and its services. However, Demoranville and Bienstock From the above discussion it is clear that service quality revolves around customer expectation and their perceptions of service performances. Hence it is characterized by the customers’ perception of service and the customers are the sole judges of the quality. Parasuraman et. al., (1991) rightly explained that consistent conformance to expectations begins with identifying and understanding customer expectation, @ IJTSRD | Available Online @ www.ijtsrd.com | Volume – 2 | Issue – 3 | Mar-Apr 2018 Page: 2658
International Journal of Trend in Scientific Research and Development (IJTSRD) ISSN: 2456-6470 only then the effective service quality strategies can be developed. Customer Satisfaction similar to an attitude, as it can be assessed as the sum of the satisfactions with the various attributes of the product or service (Churchill and Surprenant, 1982). However, while attitude is a pre-decision construct, satisfaction is a post decision experience construct (Latour and Peat, 1979). Furthermore, it highlights the construct of a “global” level of satisfaction (the overall service satisfaction) in contrast to the construct of a component level of satisfaction (the encounter service satisfaction). Boulding, et. al., 1993, mentioned that customer’s satisfaction is influenced by two factors which is experiences and expectations with service performance. Two additional issues that need to be clarified when researching customer satisfaction in services is whether satisfaction is conceptualized as facet (attribute specific) or as overall (aggregate); and whether it is viewed as transaction-specific (encounter satisfaction) or as cumulative (satisfaction over time) (Hoest and et. al., 2004). However, according to Levesque and McDougall (1996) satisfaction is conceptualized as an overall customer attitude towards a service provider. Many authors (Parasuraman et al., 1988; Bitner, 1990; Boulding, et al., 1993; Bitner and Hubbert, 1994; Taylor and Baker, 1994). Oliver (1980) have suggested that service quality and satisfaction are distinct constructs) identified dissatisfaction in terms of the disconfirmation of customers’ expectation. A positive disconfirmation leads to customer satisfaction and a negative disconfirmation leads to customer dissatisfaction. Oliver (1980) argued dissatisfaction is dependent on the extent of disconfirmation and the customer’s involvement with the service and the problem solving process. The Expectations Disconfirmation Model has been dominant model in satisfaction research. The model uses pre-consumption expectations in a comparison with post-consumption experiences of a product/service to form an attitude of satisfaction or dissatisfaction toward the product/service (Oliver, 1980; Churchill and Surprenant, 1982; Oliver and DeSarbo, 1988; Tse and Wilton, 1988). The expectancy disconfirmation paradigm in process theory provides the grounding for the vast majority of satisfaction studies and encompasses four constructs: (1) Expectations (2) Performance (3) Disconfirmation and (4) Satisfaction. Disconfirmation arises from discrepancies between prior expectations and actual performance. There are three possibilities: zero disconfirmation can result when a product performs as expected; positive disconfirmation can occur when the product performs better than expected; and negative disconfirmation when the product performs below expectations and dissatisfaction sets. satisfaction and that the amount of level of Repurchase Intentions The concept of repurchase intentions is referred to as people’s beliefs about what they intend to do in a certain situation (Ajzen and Fishbein, 1980). Repurchase intentions can be defined as, “indicators that signal whether customers will remain with or defect from the company” (Zeithaml et. al., 1996; Alexandris et al., 2002). Madhavaiah et. al., (2008) stated, “behavioral intentions can be positive or negative, depending on the quality and satisfaction rating that the customer has for the service”. In general, repurchase intentions are associated with customer retention and customer loyalty (Alexandris, et. al., 2002). Fishbein and Ajzen (1980) defined repurchase intentions as “a measure of the strength of one’s intention to perform a specific behavior”. Favorable repurchase intentions are associated with a service providers’ ability to make its customers: say positive things about them (Boulding, et. al., 1993), recommend them to other customers (Parasuraman, et. al, 1991, 1988), remain loyal to them (Rust and Zahorik, 1993), spend more with the organization and pay price premiums (Lin and Hsieh, 2007). Conversely, Lobo et. al., (2007) indicate that unfavorable repurchase intentions include customer switching behavior and Repurchase intentions can predict actual customer behavior when repurchase intentions are appropriately measured (Ajzen and Fishbein 1980). Dabholkar et al. A comparison of the satisfaction model with the Gaps model indicates that the most salient feature is that the latter leaves out the issue of disconfirmation and seeks to represent an entire psychological process by an operationalisation that involves the simple subtraction of expectations from perceptions. A number of other distinctions are often made between satisfaction and quality. First, while the original five dimensions of SERVQUAL are fairly specific, those for satisfaction are broader and can result from a wider set of factors. Second, satisfaction assessments require customer experience, while quality does not (Oliver, 1980; Bolton and Drew, 1991b; Cronin and Taylor, 1992; Boulding, et. al., 1993). Operationally, satisfaction is complaint behavior. @ IJTSRD | Available Online @ www.ijtsrd.com | Volume – 2 | Issue – 3 | Mar-Apr 2018 Page: 2659
International Journal of Trend in Scientific Research and Development (IJTSRD) ISSN: 2456-6470 X2 = Chi square (2000) found that financial success and future performance of an organizations depend on the extent to which customers’ favorable repurchase intentions are fostered. N = population size. P = significance level d = degree of freedom The repurchase intentions are one of the most important factors that allow managers to increase profits in the services sector. Understanding the repurchase intentions of customers after experiencing services is important because they are seen as a prime determinant of a firm’s long term financial performance and is considered a major source of competitive advantage (Lam et. al., 2004). A positive attitude before the brand enhances the probability of repetition and recommendation to other customers (Reichheld and Sasser, 1990). Thus, behavioral intentions are important indicators of customers’ future behaviors, trigger future behaviors (Ajzen and Fishbein, 1980) and are defined as “a deeply held commitment to repurchase or re-patronize a preferred product or service in the future” (Oliver, 1997). Many studies have examined the antecedents of repeat purchase intentions. Concerning the influences of satisfaction and quality on these intentions, Taylor and Baker (1994), suggested that satisfaction should be described as a moderator between service quality and purchasing intention. Cronin and Taylor (1992), Sample Design and Procedure As a result, a sample of approximately 663 customers must be taken from the sample organization. The sample size consisting 663 (six hundred sixty three) in two selected states of proportionately distributed availability of hotels rooms. This was further proportionately distributed based on classification of hotels as shown in following Table 1. The data was collected in a period of six months by spending 3-4 hours a day and investigator took every care that the guests staying in different hotels already contacted should not be repeated. The questionnaire were personally distributed and collected. Out of 800 (eight hundred) questionnaires, 665 (six hundred sixty five) were found usable, thus representing a response rate of 83.85%. The questionnaires were distributed and collected personally representing a 100% response rate. The data was then analyzed with the help of SPSS 20 and Amos version 20 data base. northern after India considering was Table 1: Category-wise Break-up for Sample Size Category of Hotels Jammu & Kashmir Punjab Total In order to determine the sample size for the study, a pilot survey was conducted in February, 2016 and the investigator took a random sample of 100 guests who were staying in different hotels of northern India (Jammu & Kashmir, Punjab). Selected guests were asked limited questions related to hotel services with the aim to know whether they had ever used hotel services A 32 62 94 B 47 89 136 C 55 102 157 D 40 91 131 Based on the pilot survey, the investigator found that almost 75 guests had used the hotel services earlier (i.e. 75% of the 100 guests) and remaining had not used before. On the basis of this information, following formula has been used to work out the appropriate sample size: E 33 112 145 Total 207 456 663 Frequency Analysis FORMULA Frequency Analysis has been performed to analyze the background of respondents. In order to control the influence of demographic factor on the overall result of the study, care has been taken that sufficient number of respondents are drawn from different socio - economic groups – age groups, educational level, S = X NP(1-P)/d2(N-1)+x2 (1-P) (Krejcie & Morgan, 1970) Where, S = sample size. @ IJTSRD | Available Online @ www.ijtsrd.com | Volume – 2 | Issue – 3 | Mar-Apr 2018 Page: 2660
International Journal of Trend in Scientific Research and Development (IJTSRD) ISSN: 2456-6470 level of income etc. Table 2 to 9 presents demographic profile of the selected respondents. Table 5: Aggregate Demographic Profile as per Length of Stay No. of Respondents 1-6 days 311 7-12 days 179 13-18 days 97 Length of stay Percentage Table 2: Aggregate Demographic Profile as per Age No. of Respondents 20-30 204 31-40 242 41-50 162 Above 51 55 47.00 27.00 Age in Years Percentage 14.50 11.50 30.87 36.60 24.30 8.23 More than 19 days Total 76 663 100 Respondents who stayed in between 1-6 days were, were heavy participants respondents staying 7-12 days (27%). Least number of participants (11.5%) has a stay of more than 19 days followed by the respondents (14.5%) stay of 13- 18 days (Table 5). Table 6: Aggregate Demographic Profile as per the Number of visit Number of visit Respondents 1st 196 2nd 194 3rd 139 4th 134 Total 663 100 (47%) followed by The data in the table 2 shows that majority respondents fall in the age group of 31-40 years (36.60%) followed by the age group of 20-30 years (30.87 %), 41-50 years (24.30%), and the remaining are above 51 years of age. Table 3: Aggregate Demographic Profile as per Gender No. of Respondents Male 383 Female 280 No. of Percentage Gender Percentage 29.62 29.25 21.01 20.12 57.75 42.25 Total 663 100 The data on Table 3 shows that out of the total sample size of 663 respondents, majority were males (57.75%). Table 4: Aggregate Demographic Profile as per Educational Qualification Total 663 100 Majority of respondents 29.62% had come to the hotels of northern India for the first time followed by 29.25% for the 2nd time, 21.01% for the 3rd time and 20.12% for the 4th time table 6. Table 7: Aggregate Demographic Profile as per the Purpose of visit No. of Respondents Business 111 Pilgrimage 106 Leisure/holidays 282 Visiting friends/relatives Sports 115 Total 663 Respondents who came for leisure/holidays were heavy participants (42.50%) followed by the sports No. of Educational Qualification Percentage Respondents Up to secondary Graduation Post Graduation Total 144 21.75 Purpose of visit Percentage 335 184 50.50 27.75 16.75 16.00 42.50 7.38 663 100 49 Majority of the respondents (50.50%) were graduates followed by post graduate (27.75%) and the remaining were under graduates as shown in the Table 4. 17.37 100 @ IJTSRD | Available Online @ www.ijtsrd.com | Volume – 2 | Issue – 3 | Mar-Apr 2018 Page: 2661
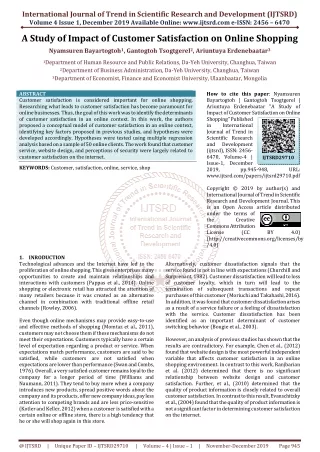
International Journal of Trend in Scientific Research and Development (IJTSRD) ISSN: 2456-6470 persons (17.37%) and the respondents who came to visit friends /relatives were least in number (7.38%) followed by the pilgrimage (16.00%) and business tourists (16.75%) as shown in (Table 7). Table 8: Aggregate Demographic Profile as per the Category of Hotels Category of Hotels Respondents A 164 B 180 C 174 D 81 E 64 Total 663 A sizeable number of participants belonged to the “B” category of hotels (27.12%) followed by the “C” category of hotels (26.25%) and the least number (9.63%) were from “E” category of hotels followed by “D” and “A” category of hotels (12.25% and 24.75%) respectively (Table 8). Table 9: Aggregate Demographic Profile as per the Nationality No. of Respondents Indians 401 Foreigners 262 assessed generally by the two measures; (a) Kurtosis and (b) skewness. Kurtosis refers to the peakedness or flatness of the distribution compared to the normal distribution. While as skewness is described as the balance of distribution. In order to examine the normality of data, the value of Kurtosis and skewness must lie between - 1 to + 1 or closed to zero (Gao et al., 2008). In the present study the skewness and kurtosis were examined with the help of SPSS as shown in the Table 10 Since all the values of the data normality test were found within acceptance limit, therefore, the normality of data stands confirmed. Table 10: Shows the Skewness and Kurtosis Service Quality Tangibility -0.148 Reliability 0.010 Responsiveness 0.138 Assurance -0.115 Empathy -0.241 Customer Satisfaction Repurchase Intentions Linearity The linearity of the data was assessed by the application of normal distributed plot namely, Q-Q plots, Q-Q plots are plots of the observed order quantile verses the expected quantile. The straight line in the graphs represents the trend of the expected data, while as, the dotted line along with the straight line represent the observed data. The convergence of these two lines is the sign of data normality, while as, departure or divergence of the dotted line from the straight line are the evidence against the assumption that the data is normal. In other words if the data are normally distributed then the data points fall approximately on a diagonal straight line, and if the data points stray away from the diagonal line then the data is said to be not normally distributed. In fact these plots provide information about the symmetry or asymmetry. No. of Percentage 24.75 27.12 26.25 12.25 9.63 100 Skewness Kurtosis -0.591 -0.595 -0.531 0.561 -0.548 -0.233 -0.477 -0.144 -0.087 Respondents Percentage 60.48 39.52 Total 663 100 Majority of the respondents were from Indian States (60.48%) followed by the foreigners (39.52%) as shown in (Table 9). Outliers’ detection Outliers’ are the extreme responses which may unduly influence the outcome of any multivariate analysis (Blake & Hair, 2012). The AMOS output provide the outlier responses, which later were eliminated for the subsequent analysis. Data normality Normality refers to the shape of the data distribution for an individual metric correspondence to the normal distribution. Since normality is used for F and t test, therefore if the variation from the normal distribution is sufficiently large it may lead to the invalid statistical test. For testing data normality, shape of the distribution is variable and its @ IJTSRD | Available Online @ www.ijtsrd.com | Volume – 2 | Issue – 3 | Mar-Apr 2018 Page: 2662
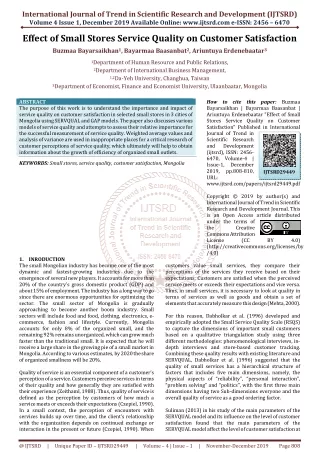
International Journal of Trend in Scientific Research and Development (IJTSRD) ISSN: 2456-6470 Graphs 1: Below graphs show the linearity Measurement Instrument Measurement model for Service quality The fit of CFA for second order model service quality was examined. The indices were as: value of x2/df = 2.21, GFI = .990, AGFI = .971, NFI = .989, TLI = .984 CFI = .992, RMSEA = .058. Measurement Model for Customer Satisfaction The results of CFA indicate that the model fits the data. (X2/df = 2.851, GFI = .982, AGFI = .947, NFI = .977, CFI = .981, TLI = .961, RMSEA = .076). Measurement Model for Repurchase Intentions The results from the model fit were satisfactory, (X2/df = 2.72, GFI = .983, AGFI = .948, NFI = .946, CFI = .954, TLI = .909, RMSEA = .074). @ IJTSRD | Available Online @ www.ijtsrd.com | Volume – 2 | Issue – 3 | Mar-Apr 2018 Page: 2663
International Journal of Trend in Scientific Research and Development (IJTSRD) ISSN: 2456-6470 Results Relationship Customer Satisfaction, Service Quality and Repurchase and Customer Satisfaction and Repurchase Intentions (Hypothesis H3, H4 and H5) Table: 12: Correlations between Service Quality and One of the major objectives of the study was to measure the service quality in hotels, under reference. To achieve this objective, the first step was directed at the measurement of service quality construct. According to Gronroos, (1984) and Parasuraman et. al., (1988) Service quality is defined as the difference between customer expectations and perceptions of service or as the customers satisfaction or dissatisfaction formed by their experience of purchase and use of the service. Consequently, the main area of questioning consisted regarding quality of services received in hotel industry and its dimensions – tangibility, reliability, responsiveness, assurance and empathy. Perceptions of customers were measured on a 5 point (strongly disagree/ strongly agree Likert’s Type scale. Mean scores of consumers’ perceptions were computed for each category of hotel separately, results of which are presented in following Table 11 under study and are presented below: Service quality C. R. Satisfact ion Intentio n Pearson Correlation Sig. (2- tailed) N Pearson Correlation Sig. (2- tailed) N Pearson Correlation Sig. (2- tailed) .756** .591** 1 Service quality customers perceptions .000 .000 663 .756** 663 663 .601** 1 C. Satisfaction .000 .000 663 .591** 663 .601** 663 1 Over-all Service Quality Scores in Hotels .000 .000 R. Intention To measure the over-all service quality in hotels, under study, mean scores of all hotels where computed separately and averaged on all dimensions (Table 11). N 663 663 663 **. Correlation is significant at the 0.01 level (2-tailed). Table 12 reveals that service quality is positively correlated with customer satisfaction (r = 0.756**), service quality is positively correlated with repurchase intentions (r = 0.591**) and customer satisfaction is positively correlated with repurchase intentions (r = 0.601**) Table 11: Service Quality Scores Averaged on all Dimensions Dimensions of service quality St. Mean Deviation Tangibility 3.34 1.22 Reliability Responsiveness Assurance Empathy Overall service quality (Averaged on all dimensions) 3.18 3.29 3.24 3.28 1.26 1.17 1.18 1.19 Conclusion and suggestion The main purpose of this study was to determine the differential impact of perceived service quality on customer satisfaction and repurchase intentions. The study results showed that three dimensions of SERVQUAL such as tangibles, responsiveness and 3.27 1.20 @ IJTSRD | Available Online @ www.ijtsrd.com | Volume – 2 | Issue – 3 | Mar-Apr 2018 Page: 2664
International Journal of Trend in Scientific Research and Development (IJTSRD) ISSN: 2456-6470 empathy fostered the customer repurchase intentions whereas reliability and assurance did not observe to have the most impact on the repurchase intentions of guests. The results also showed that tangibles post more impact on customer repurchase intentions followed by responsiveness and empathy. The result that service quality dimensions have positive impact on customer satisfaction and repurchase intentions is consistent with the other empirical studies in the services marketing literature. For instance, in a study of retail bank customers in the Netherlands, Bloemer et al. (1998) demonstrated that service quality had relationship with customer satisfaction and loyalty directly and indirectly. Similar findings were also reported in the works of Bell et al. (2005), Lassar et al. (2000), Bei and Chiao (2006) in Taiwan, Karatepe et al. (2005) in Northern Cyprus, and Mosahab et al. (2010) in Iran. The current study presents very useful insights to hotel management and marketing practitioners to better understand the relationship of service quality dimensions and customer satisfaction. As the organizational structures of hotels operating in northern India are not sync with the accordance of consumer’s point of view and not providing the individualized service quality so the management should focused on establishing customer orientated atmosphere in the hotel. References 1)Augustyn, M. M., (1998), “The Road to Quality Enhancement in Tourism”. International Journal of Contemporary Hospitality Management, Vol. 10/4, Pp. 145-158. Behavioral Intentions”. Journal of Marketing Research, Vol. 30, No. 1, Pp.7-28. 6)Boulding, W., Kalra, A., Staelin, R., and Zeithaml, V. A., (1993), “A Dynamic Process Model of Service Quality from Expectations to Behavioral Intentions”. Journal of Marketing Research, Vol. 30, No. 1, Pp.7-28. 7)Brown, S. W., and Swartz, T. A., (1989), “A Gap Analysis of Professional Service Quality”. i.Business Business Service Context”. Journal Academic Marketing Science, Vol. to 8)Churchill, G. A., and Surprenant, C., (1982), “An Investigation into the Determinants of Customer Satisfaction”. Journal of Marketing Research, Vol. 19, No. 4, Pp. 491-504. 9)Churchill, G. A., and Surprenant, C., (1982), “An Investigation into the Determinants of Customer Satisfaction”. Journal of Marketing Research, Vol. 19, No. 4, Pp. 491-504. 10)Cronin and Taylor, S.A (1992), “Measuring Service Quality: A Extension.” Journal of Marketing, Vol. 56 (July): Pp.55-67. Re-Examination and 11)Crosby, P. B., (1979), “Quality is Free: The Art of Making Quality Certain”. New York: 12)Dabholkar, P. A., Shepherd, D. C., and Thorpe, D. I., (2000), “A Comprehensive Framework for Service Quality: An Investigation of Critical Conceptual and Measurement Issues through a Longitudinal Study”. Journal of Retailing, Vol. 76, No. 2, Pp. 139-173. Educational and Psychological Measurement, 30,Pp. 607-610. 2)Bitner, M. J., and Hubbert, A. K., (1994), “Encounters Satisfaction Satisfaction versus Quality”, Journal of Financial Services Marketing, Pp. 1-5. versus Overall 13)Gronroos C. (1984), A Service Quality Model and its Marketting Implications. European Journal 3)Bitner, Encounters: The Effects of Physical Surroundings and Employee Responses”. Journal of Marketing, Vol. 54, No. 2, Pp. 69-82. M., (1990), “Evaluating Service 14)Hoest, V. and Knie-Andersen, M. (2004), “Modeling Customer Satisfaction in Mortgage Credit Companies”, the International Journal of Bank Marketing, Vol. 22, Pp.26-42. 4)Bolton, R. N., and Drew, J. H., (1991a), “A Multistage Model of Customers’ Assessment of Service Quality and Value”. Journal of Consumer Research, Vol. 17, No. 4, Pp. 375-384. 15)Huh, J., Uysal, M., and, McCleary, K., (2006), “Cultural/Heritage Destinations: Tourist Satis- faction and Market Segmentation”. Journal of Hospitality and Leisure Marketing, Vol.14, No. 3, Pp. 81-99. 5)Boulding, W., Kalra, A., Staelin, R., and Zeithaml, V. A., (1993), “A Dynamic Process Model of Service Quality from Expectations to 16)Kandampully, J., Juwaheer, T. D., and Hu, H. H., (2011), “The Influence of a Hotel Firm's @ IJTSRD | Available Online @ www.ijtsrd.com | Volume – 2 | Issue – 3 | Mar-Apr 2018 Page: 2665
International Journal of Trend in Scientific Research and Development (IJTSRD) ISSN: 2456-6470 17)Korzay, M., and Alvarez, M. D., (2005), “Satisfaction and Dissatisfaction of Japanese Tourists in Turkey, Anatolia”. An International Journal of Tourism and Hospitality Research, Vol. 16, No. 2, Pp. 176-193. 18)Kotler, P., (2000), “Marketing Management”, 10th Edition, New Jersey, Prentice-Hall. 28)Parasuraman, A., Zeithaml, V. A., and Berry, L. L., (1988), “SERVQUAL: A Multiple Item A Conceptual Model of Service Quality and its Implications for Future “Customer Value, Satisfaction, Switching Costs: An Illustration from a 1, Pp. 21 42 Research”, Loyalty, and 29).Parasuraman, A., Zeithaml, V. A., and Berry, L. L., (1988), “SERVQUAL: A Multiple Item Scale for Measuring Consumer Perceptions of Service Quality”. Journal of Retailing, Vol. 64, No. 1, Pp. 12-40. 19)Kozak, M., Bigne, E., and, Andreau, L., (2004), “Satisfaction and Destination Loyalty: A Com- parison between Non-Repeat Tourists”. Journal of Quality Assurance in Hospitality and Tourism, Vol. 5, No. 1, Pp. 43-59. and Repeat 30)Parasuraman,A., Zeithmal, V.A and Berry,L.L (1998), “SERVQUAL:A Multiple Item Scale for Measuring Consumer Perception of Service Quality”, Journal of Retailing, Vol. 62, No.7, Pp.22-30. 20)Krejcie, R. V., and Morgan, D.W. (1970), “Determining Sample Activities, Size for Research 21)Lam, S. Y., Shankar, V., Erramilli, M. K., and Murthy, B., (2004), 31)Postma, A., and Jenkins, A. K., (1997), “Improving the Tourist’s Experience: Quality Quality of Service and Image and its Effect on Tourism Customer Loyalty”. Retailing, Vol. 64, No. 1, Pp. 12-40. 22)Lassar, W., Manolis, C., and Winsor, R., (2000), “SQ Perspectives and Satisfaction in Private Banking”. The International Journal of Bank Marketing, Vol. 18, No. 4, Pp. 181-199. 23)Levesque, T., and Mcdougall, G., (1996), “Determinants of Customer Satisfaction in Retail Banking”, International Marketing, Vol. 14, No. 7, Pp. 12-20. 32)Rust, R. T., and Zahorik, A. J., (1993), “Customer Satisfaction, Customer Retention, and Market Share”. Journal of Retailing, Vol. 69, No. 2, Pp. 193-215. Scale for Perceptions of Service Quality”. Journal of Journal of Bank Measuring Consumer 24)Lin, J. S., and Hsieh, P. L., (2007), “The Influence of Technology Readiness on Satisfaction and Behavioral Intentions Technologies”. Journal of Computers in Human Behaviour, Vol. 23, No. 3, Pp. 1597-1615. 33)Taylor, S. A., and Baker, T. L., (1994), “An Assessment of the Relationship between Service Quality and Customer Satisfaction in the Formation of Consumers’ Purchase Intentions”. Journal of Retailing, Vol. 70, No. 2, Pp. 163-178. toward Self-Service 25)Lobo, A., Maritz, A., and Mehta, S., (2007), “Enhancing Singapore Travel Agencies’ Customer Loyalty: An Empirical Customers’ Behavioral Intentions and Zones of Tolerance”. International Journal of Tourism Research, Vol. 9, No. 6, Pp. 485-495. 34)Taylor, S. A., and Baker, T. L., (1994), “An Assessment of the Relationship between Service Quality and Customer Satisfaction in the Formation of Consumers’ Purchase Intentions”. Journal of Retailing, Vol. 70, No. 2, Pp. 163-178. Tourism, Edited By Murphy, P. E., Willey, Chichester. Investigation of 26)Madhavaiah, C., Krishnamacharyulu, C., and Akthar P., (2008), “Service Quality and Customer Behavioural Intentions in Fixed Telephone Services: A Case Study of BSNL”. Synthesis, Vol. 5, No. 2, Pp. 65-84. 35)Tse, D. K., and Wilton, P. C., (1988), “Models of Consumer Satisfaction Formation: An Extension”. Journal of Marketing Research, No.17, Pp. 460- 69. 27)Oliver, R. L., (1980), “A Cognitive Model of the Antecedents and Consequences of Satisfaction Decisions”, Journal of Marketing Research, Vol. 17, Pp. 460-469. 36)Vazquez, (2001), “Expectations: A Comparison Standard in Measuring Service Quality: An Assessment of a Reassessment”. Journal of Marketing, Vol. 58, No. 1, Pp. 132-139. @ IJTSRD | Available Online @ www.ijtsrd.com | Volume – 2 | Issue – 3 | Mar-Apr 2018 Page: 2666
International Journal of Trend in Scientific Research and Development (IJTSRD) ISSN: 2456-6470 37)Ying, L. B., (1990), “A Survey of Service Quality and Job Satisfaction in Tourism Industry of China”. A Thesis in Restaurant, Hotel, and Institutional Management, Submitted to the Graduate Faculty of Texas Tech University, China (Available Online). 38)Yoon, Y., and Uysal, M., (2005), “An Examination of the Effects of Motivation and Satisfaction on Destination Loyalty: A Structural Model”. Journal of Tourism Management, Vol. 26, Pp. 45-56. 39)Zeithaml, V. A., Bitner, M., and Gremler, D. D., (1996), “Services Customer Focus across the Firm”. Fifth edition, Boston, Massachusetts: McGraw. Marketing: Integrating 40)Zeithmal V.A and Berry L.L (1988),Management Applied to Tourist Destinations”, Quality Management in Urbanof Marketing, Vol. 18(4) pp.9.Parasuraman A., @ IJTSRD | Available Online @ www.ijtsrd.com | Volume – 2 | Issue – 3 | Mar-Apr 2018 Page: 2667