Download
1 / 3
40 likes | 93 Vues
Aim and objective A simple, pru00e9:cised, accurate method was developed for the estimation of Crizotinib by RP HPLC technique. Chromatographic conditions used are stationary phase BDS 250x4.6 mm, 5u00b5-. Mobile phase buffer Methodology Acetonitrile in the ratio of 60 40 and flow rate was maintained at1ml min, detection wave length was 267 nm, column temperature was set to 30o C and diluents was methanol water System suitability parameters were studied by injecting the standard five times and results were well 50 50 , Results and Discussion Conditions were finalized as optimized method under acceptance criteria. Linearity study was carried out between 25 to 150 levels, r2 value was found to be as 0.999. Precision was found to be 1.26 for repeatability and 0.93 for intermediate precision. LOD and LOQ are 0.080 ug ml. By using above method assay of marketed formulation was carried out 100.24 was present. Prapulla Putta "Analytical Methods Development and Validation of Naproxen and Sumatriptan by RP HPLC" Published in International Journal of Trend in Scientific Research and Development (ijtsrd), ISSN: 2456-6470, Volume-3 | Issue-4 , June 2019, URL: https://www.ijtsrd.com/papers/ijtsrd23582.pdf Paper URL: https://www.ijtsrd.com/pharmacy/analytical-chemistry/23582/analytical-methods-development-and-validation-of-naproxen-and-sumatriptan-by-rp-hplc/prapulla-putta<br>

E N D
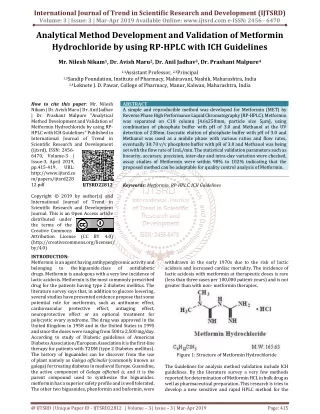
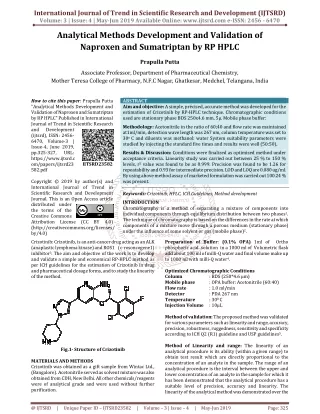
International Journal of Trend in Scientific Research and Development (IJTSRD) Volume: 3 | Issue: 4 | May-Jun 2019 Available Online: www.ijtsrd.com e-ISSN: 2456 - 6470 Analytical Methods Development and Validation of Naproxen and Sumatriptan by RP HPLC Prapulla Putta Associate Professor, Department of Pharmaceutical Chemistry, Mother Teresa College of Pharmacy, N.F.C Nagar, Ghatkesar, Medchel, Telangana, India How to cite this paper: Prapulla Putta "Analytical Methods Development and Validation of Naproxen and Sumatriptan by RP HPLC" Published in International Journal of Trend in Scientific Research and Development (ijtsrd), ISSN: 2456- 6470, Volume-3 | Issue-4, June 2019, pp.325-327, URL: https://www.ijtsrd.c om/papers/ijtsrd23 582.pdf Copyright © 2019 by author(s) and International Journal of Trend in Scientific Research and Development Journal. This is an Open Access article distributed under the terms of the Creative Commons Attribution License (CC BY 4.0) (http://creativecommons.org/licenses/ by/4.0) Crizotinib: Crizotinib, is an anti-cancer drug acting as an ALK (anaplastic lymphoma kinase) and ROS1 (c-rosoncogene1) inhibitor3. The aim and objective of the work is to develop and validate a simple and economical RP-HPLC method as per ICH guidelines for the estimation of Crizotinib in drug and pharmaceutical dosage forms, and to study the linearity of the method. ABSTRACT Aim and objective: A simple, précised, accurate method was developed for the estimation of Crizotinib by RP-HPLC technique. Chromatographic conditions used are stationary phase BDS 250x4.6 mm, 5µ. Mobile phase buffer: Methodology: Acetonitrile in the ratio of 60;40 and flow rate was maintained at1ml/min, detection wave length was 267 nm, column temperature was set to 30o C and diluents was methanol: water System suitability parameters were studied by injecting the standard five times and results were well (50:50), Results & Discussion: Conditions were finalized as optimized method under acceptance criteria. Linearity study was carried out between 25 % to 150 % levels, r2 value was found to be as 0.999. Precision was found to be 1.26 for repeatability and 0.93 for intermediate precision. LOD and LOQ are 0.080 ug/ml. By using above method assay of marketed formulation was carried out 100.24 % was present. Keywords: Crizotinib, HPLC, ICH Guidelines, Method development INTRODUCTION Chromatography is a method of separating a mixture of components into individual components through equilibrium distribution between two phases1. The technique of chromatography is based on the differences in the rate at which components of a mixture move through a porous medium (stationary phase) under the influence of some solvent or gas (mobile phase)2. IJTSRD23582 Preparation of Buffer: (0.1% OPA) 1ml of Ortho phosphoric acid solution in a 1000 ml of Volumetric flask add about 100 ml of milli-Q water and final volume make up to 1000 ml with milli-Q water4. Optimized Chromatographic Conditions Column : BDS (250*4.6 μm) Mobile phase : OPA buffer: Acetonitrile (60:40) Flow rate : 1.0 ml/min Detector : PDA 267 nm Temperature : 300 C Injection Volume : 10µL Method of validation: The proposed method was validated for various parameters such as linearity and range, accuracy, precision, robustness, ruggedness, sensitivity and specificity according to ICH Q2 (R1) guideline and USP guidelines5. Method of Linearity and range: The linearity of an analytical procedure is its ability (within a given range) to obtain test result which are directly proportional to the concentration of an analyte in the sample. The range of an analytical procedure is the interval between the upper and lower concentration of an analyte in the sample for which it has been demonstrated that the analytical procedure has a suitable level of precision, accuracy and linearity. The linearity of the analytical method was demonstrated over the Fig.1- Structure of Crizotinib MATERIALS AND METHODS Crizotinib was obtained as a gift sample from Wintac Ltd., (Bangalore). Acetonitrile served as solvent mixture was also obtained from CDH, New Delhi. All other chemicals/reagents were of analytical grade and were used without further purification. @ IJTSRD | Unique Paper ID – IJTSRD23582 | Volume – 3 | Issue – 4 | May-Jun 2019 Page: 325
International Journal of Trend in Scientific Research and Development (IJTSRD) @ www.ijtsrd.com eISSN: 2456-6470 concentration range investigated by triplicate analysis (n = 3) at a concentration range of 2-20 μg/ml. The absorbance obtained at respective concentration was recorded, and the graph is plotted as concentration (μg/ml) versus absorbance. The linear regression equation and the coefficient correlation were obtained from the UV probe software6. Method of Accuracy: The accuracy of an analytical procedure expresses the closeness of agreement between the value which is accepted either as a conventional true value or an accepted reference value and the value found. This is sometimes termed trueness. The accuracy of proposed method was determined on the basis of recovery study. Recovery study was carried out by spiking standard working solution to sample solution (formulation) at three different levels 80%, 100% and 120%. The final concentration of Crizotinib was determined at each levels of the amount; three determinations were performed. The percentage recovery was calculated as mean ± standard deviation7. Method of Precision: The precision of an analytical procedure expresses the closeness of agreement (degree of scatter) between a series of measurements obtained from multiple sampling of the homogeneous sample under the prescribed conditions. The precision of the method was demonstrated by intra-day and inter-day variation studies. In the intra-day precision study, three different solutions of same concentration were prepared and analysed in the same day (morning, noon and evening), whereas in the inter-day RESULTS AND DISCUSSIONS precision study, the solutions of same concentration were prepared and analysed, for three consecutive days, and the absorbance were recorded. All study was performed in triplicates. The result was indicated by calculating percentage RSD8. Method of Robustness: The robustness of an analytical procedure is a measure of its capacity remains unaffected by small, but deliberate variations in method parameters and provides an indication of its reliability during normal usage9. Method of Ruggedness: The ruggedness is a degree of reproducibility of test result under verification of condition like a different analyst, different instruments and different days10. Assay Procedure Column is equilibrated for 30 min with mobile phase. 20 µl of diluent as blank was injected into the system and recorded the chromatogram for a run time of 30 min. 20 µl of standard preparation-1 was injected into the system and recorded the chromatogram for a run time of 30 min. 20 µl of standard preparation-2 was injected into the system and recorded the chromatogram for a run time of 30 min. Test is valid only when the match factor is in between 0.98 to 1.02. 20 µl of standard preparation-2 into the system was separately injected for four times and recorded each chromatogram for a run time of 30 min. Test is valid only when the five standard preparation-2 injections pass the system suitability11. Table1. System suitability - System suitability data Peak Name RT Crizotinib 2.556 1458811 Crizotinib 2.563 1412479 Crizotinib 2.565 1450647 Crizotinib 2.574 1465621 Crizotinib 2.577 1463605 Crizotinib 2.617 1444216 Standard deviation % RSD Sl. No 1 2 3 4 5 6 Mean Area USP Plate CountUSP Tailing 3949 3927 3811 3719 3784 3885 1.37 1.34 1.33 1.37 1.35 1.33 1449230 19722.4 1.4 Method of Precision: Table2. Data of Repeatability Sl. No 1 2 3 4 5 6 Avg. Std. devi % RSD Peak area 1450617 1423806 1448914 1456113 1469303 1476272 1454171 18349.4 1.26 Fig.2- blank Chromatogram Fig.3- System suitability Chromatogram Fig.4- Optimized chromatogram @ IJTSRD | Unique Paper ID - IJTSRD23582 | Volume – 3 | Issue – 4 | May-Jun 2019 Page: 326
International Journal of Trend in Scientific Research and Development (IJTSRD) @ www.ijtsrd.com eISSN: 2456-6470 Observation: Crizotinib eluted with good peak shape and retention time and tailing was passed Intermediate precision: Six working sample solutions of 100 ppm are injected on the next day of the preparation of samples and the % Amount found was calculated and %RSD was found to be 0.93 and chromatogram was shown in fig.3. Table3. Data of Intermediate precision Sl. No 1 2 3 4 5 6 Average Standard deviation % RSD Method of Linearity: To demonstrate the linearity of assay method, inject 5 standard solutions with concentrations of about 37.5 ppm to 225 ppm of Crizotinib. Plot a graph to concentration versus peak area. Slope obtained was 21035 Y-Intercept was 892.5 and Correlation Co-efficient was found to be 0.999 and Linearity plot. Table4. Linearity Concentration and Response Linearity Level (%) 1 0 2 25 3 50 4 75 5 100 6 125 7 150 25 % to150 % levels, r2 value was found to be as 0.999. Precision was found to be 1.26 for repeatability and 0.93 for intermediate precision. LOD and LOQ are 0.080 µg/ml and 0.243 µg/ml respectively. By using above method assay of marketed formulation was carried out 100.24 % was present. ACKNOWLEDGEMENT I am very thankful to Mr. L. Matsyagiri, Associate Professor, Swami Vivekananda Institute of Pharmaceutical Sciences, Vangapally, Yadagirigutta, Telangana, India, for his support for the study. REFERENCES [1]Sethi PD., Quantitative analysis of Drugs & Pharmaceuticals. CBS publishers and distributors, New Delhi, 3rd edition, 2001 Pg. no 1-120. Peak Area 1439917 1470663 1472005 1477149 1473073 1462129 1465823 13618.0 0.93 Yadadri Bhongir-506286, [2]Crizotinib. https://pubchem.ncbi.nlm.nih.gov/compound (accessed Oct 21, 2015). [3]Ramachandra and N.V.S. Naidu, Validation of RP -HPLC Method for Estimation of Dasatinib In Bulk and Its Pharmaceutical Dosage Forms, International journal of pharmacy and biological sciences, 2014; 61-68: 2230- 7605. [4]Kishore konam & Dharmeshwar jadhav, Development and validation of a RP- HPLC method for determination of dronedarone in bulk and pharmaceutical formulation, International Journal of Pharmacy and Biological Sciences, 2014; 4(1): 179-185. Concentration (ppm) 0 25 50 75 100 125 150 Sl. No Area 0 400600 808783 1203917 1624787 2009776 2409818 [5]International Conference on Harmonization (ICH), Q2A. “Validation of Analytical Procedures: Methodology”. Geneva, 1994. [6]Skoog et al., Principles of Instrumental Analysis. Barkhanath publishers, 8th edition, Pg. no. 973-995. [7]Prapulla Putta, Analytical methods Development and Validation of Crizotinib by RP-HPLC Technique, International Journal Pharmacology, 2019; 1(1); 1-4. Table5. Summary of results Parameters Calibration range (mcg/ml) Optimized wave length Retention time Regression equation (Y) Correlation coefficient (r2) Precision (% RSD*) Percentage Recovery Limit of Detection (µg/ml) Limit of Quantization (µg/ml) Crizotinib 25-150 ppm 267 nm 2.563 min y = 16091x + 1403.4 0.999 1.26 100.24 0.080 0.243 of Biochemistry and [8]Selvakumar. S, Ravichandran. S, Matsyagiri. L, Development and Validation of analytical method for Simultaneous estimation of Ornidazole and Cefixime trihydrate tablet dosage forms by UV spectroscopy. Asian J. Pharm. Ana. 2016; 6(4): 246-252. [9]Chatwal GR, and Anand SK. Instrumental Methods of Chemical Analysis. 5th Revised and Enlarged ed., Himalaya Publication House, Mumbai, 2002; 2: 630. CONCLUSION Chromatographic conditions used are stationary phase BDS 250 x 4.6 mm, 5µ. Mobile phase buffer: Acetonitrile in the ratio of 60:40 and flow rate was maintained at 1ml/min, detection wave length was 267 nm, column temperature was set to 30o C and diluents was methanol: Water (50:50), Conditions were finalized as optimized method. System suitability parameters were studied by injecting the standard five times and results were well under the acceptance criteria. Linearity study was carried out between [10]Matsyagiri. L, Jagadeesh. P, Mounika. B, Srinivas. V, Theja.V, Madhiha Jabeen and Dr. K. Hemamalini, Effect of solvents on Spectrophotometric Estimation of Tinidazole in bulk and dosage forms, World Journal of Pharmaceutical Research, 2018; 7(9): 1742-1754. [11]JadhavPB, Vivek Shejwal, Development and Validation of an RP-HPLC Method for Crizotinib, International Journal of Pharmacy and Pharmaceutical Research. Human, 2017; 9(2):100-106. @ IJTSRD | Unique Paper ID - IJTSRD23582 | Volume – 3 | Issue – 4 | May-Jun 2019 Page: 327