Download
1 / 10
100 likes | 139 Vues
This project is to understand and have the ability to perform dynamic test. Furthermore in this project, the author can investigate how the dynamics of a multistory building is modified by base isolation. The dynamic properties are also very important for the dynamics analysis of the structure. The main task in this project is to determine the dynamic behavior of a 5 storey steel structure model with base isolation system and without base isolation system by experimentally and numerically. In this section the author examine the vibration properties, natural modes and the earthquake response of two systems 1 Five storey building on a fixed base, 2 Same five storey building supported on the isolation system. In this whole project, the following tasks have to do. First the five storey structure has to model in SAP2000 numerically. After that by the definition of reference sensor positions, sensor setups and excitation locations, the first experimental modal test has planned to do. Then the data assessments have to do like model identification, comparison of test results with the numerical model and also simulate the tests numerically. Again it needs to modify the structure in the numerical model and analyzed it again. In the second test, the system has to prepare with base isolation system. There also have to do second data assessments like model identification, comparison of test results with the numerical model with respect to base isolation system and braced system. Since the dynamic behavior of a linearly behaving structure can be described by its modal parameters natural frequencies, mode shapes, modal damping it is important to carry out tests to identify these parameters. From a numerical analysis study, how response of the building with proposed isolation system under multi direction excitation is then presented followed by the conclusion. Khin Thanda Htun | Kyaw Kaung Cho "Experimental in Structural Dynamics (Base Isolation System: Modelling)" Published in International Journal of Trend in Scientific Research and Development (ijtsrd), ISSN: 2456-6470, Volume-3 | Issue-3 , April 2019, URL: https://www.ijtsrd.com/papers/ijtsrd21704.pdf Paper URL: https://www.ijtsrd.com/engineering/civil-engineering/21704/experimental-in-structural-dynamics--base-isolation-system-modelling/khin-thanda-htun<br>

E N D
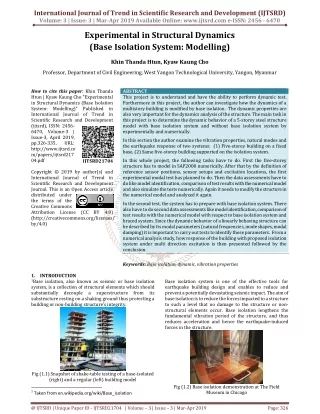
International Journal of Trend in Scientific Research and Development (IJTSRD) Volume: 3 | Issue: 3 | Mar-Apr 2019 Available Online: www.ijtsrd.com e-ISSN: 2456 - 6470 Experimental in Structural Dynamics (Base Isolation System: Modelling) Khin Thanda Htun, Kyaw Kaung Cho Professor, Department of Civil Engineering, West Yangon Technological University, Yangon, Myanmar How to cite this paper: Khin Thanda Htun | Kyaw Kaung Cho "Experimental in Structural Dynamics (Base Isolation System: Modelling)" Published in International Journal of Trend in Scientific Research and Development (ijtsrd), ISSN: 2456- 6470, Volume-3 | Issue-3, April 2019, pp.326-335, URL: http://www.ijtsrd.co m/papers/ijtsrd217 04.pdf Copyright © 2019 by author(s) and International Journal of Trend in Scientific Research and Development Journal. This is an Open Access article distributed under the terms of the Creative Commons Attribution License (CC BY 4.0) (http://creativecommons.org/licenses/ by/4.0) 1.INTRODUCTION 1Base isolation, also known as seismic or base isolation system, is a collection of structural elements which should substantially decouple a superstructure from its substructure resting on a shaking ground thus protecting a building or non-building structure’s integrity. ABSTRACT This project is to understand and have the ability to perform dynamic test. Furthermore in this project, the author can investigate how the dynamics of a multistory building is modified by base isolation. The dynamic properties are also very important for the dynamics analysis of the structure. The main task in this project is to determine the dynamic behavior of a 5-storey steel structure model with base isolation system and without base isolation system by experimentally and numerically. In this section the author examine the vibration properties, natural modes and the earthquake response of two systems: (1) Five-storey building on a fixed base, (2) Same five-storey building supported on the isolation system. In this whole project, the following tasks have to do. First the five-storey structure has to model in SAP2000 numerically. After that by the definition of reference sensor positions, sensor setups and excitation locations, the first experimental modal test has planned to do. Then the data assessments have to do like model identification, comparison of test results with the numerical model and also simulate the tests numerically. Again it needs to modify the structure in the numerical model and analyzed it again. In the second test, the system has to prepare with base isolation system. There also have to do second data assessments like model identification, comparison of test results with the numerical model with respect to base isolation system and braced system. Since the dynamic behavior of a linearly behaving structure can be described by its modal parameters (natural frequencies, mode shapes, modal damping) it is important to carry out tests to identify these parameters. From a numerical analysis study, how response of the building with proposed isolation system under multi direction excitation is then presented followed by the conclusion. IJTSRD21704 Keywords: Base isolation, dynamic, vibration properties Base isolation system is one of the effective tools for earthquake building design and enables to reduce and prevent a potentially devastating seismic impact. The aim of base isolation is to reduce the forces impacted to a structure to such a level that no damage to the structure or non- structural elements occur. Base isolation lengthens the fundamental vibration period of the structure, and thus reduces acceleration and hence the earthquake-induced forces in the structure. Fig (1.1) Snapshot of shake-table testing of a base-isolated (right) and a regular (left) building model 1 Taken from en.wikipedia.org/wiki/Base_isolation Fig (1.2) Base isolation demonstration at The Field Museum in Chicago @ IJTSRD | Unique Paper ID - IJTSRD21704 | Volume – 3 | Issue – 3 | Mar-Apr 2019 Page: 326
International Journal of Trend in Scientific Research and Development (IJTSRD) @ www.ijtsrd.com eISSN: 2456-6470 Base isolation system consists of isolation units with or without isolation components, where: 1.Isolation units are the basic elements of base isolation system which are intended to provide the mentioned decoupling effect to a building or non-building structure. 2.Isolation components are the connections between isolation units and their parts having no decoupling effect of their own. By their response to an earthquake impact, all isolation units may be divided into two basic categories: shear units and sliding units. Fig (2.1) Base model, braced model, and base isolated model 2.2.Modeling in SAP2000 The numerical modeling for the base isolated system was attempted with the used of spring elements. The structure was supported on spring in three directions. In this modeling, the model is limited so that it can only reach nonlinear condition in U2 and U3 direction, which is means that in U1 direction the system is fixed and can only response in linear range, and in U2 direction, the system can slide on the axis. The stiffness value for the lateral springs was taken from the value obtained for the springs actually used in the experimental structure. Spring parameter used: Vertical Spring = 1,000,000 N/m Lateral Spring = 1,000 N/m Fig (1.3) Comparison between fixed-base system and base-isolation system mechanism during an earthquake 2.Numerical Modelling The numerical modeling of the structure was done using the finite element program SAP 2000. 2.1.Parameters of Numerical Model The model parameters used for the analysis in numerical analysis are taken as following: ?Section Properties: Size of the Beam = 0.060 * 0.005 m (with stringer element of same size) Size of the Column = M5 Size of the Bracing Used = M5 Size of the Bracing = 0.060 * 0.005 m ?Material Properties: Unit mass of the Steel = 7850 kg/m3 Elastic Modulus of Steel = 2.1 E+11 N/m2 Poisson ratio = 0.2 Numerical modeling was performed for the three set up of structures: (a)Base model (b)Braced model with bracing in second and fourth floor (c)Base isolated model Fig (2.2) Base isolated model in SAP2000 The table below describes the comparison of Eigen frequencies from the base model, braced model, and base isolation model: Eigen frequencies(Hz) Mode Number model model Mode 1 3.36 3.44 Mode 2 3.36 4.31 Mode 3 3.48 4.45 Mode 4 9.82 10.04 Mode 5 9.82 11.77 Mode 6 10.16 12.17 Mode 7 15.53 15.57 Mode 8 15.53 16.11 Mode 9 16.03 16.64 Mode 10 20.00 20.79 Table (2.1) Results of Modal Analysis with SAP2000 Base Braced Base Isolated Model 1.36 1.95 2.26 7.25 7.98 8.04 13.83 14.28 14.5 18.87 @ IJTSRD | Unique Paper ID - IJTSRD21704 | Volume – 3 | Issue – 3 | Mar-Apr 2019 Page: 327
International Journal of Trend in Scientific Research and Development (IJTSRD) @ www.ijtsrd.com eISSN: 2456-6470 Fig (2.2) Comparison of Eigen frequencies between each system in SAP2000 From the graph above we can see that Braced model system stiffen the structure, which is conclude by an increased in Eigen frequency. On the other hand, base isolated model make the structure more flexible. We can see that the Eigen frequency decreases, indicating that the structure become more flexible. 3.Experimental Test 3.1.Equipments The dynamic response measurement of the experimental model was measured using 8 acceleration sensor and one force sensor. Seven acceleration sensors were used to measure the response of the structure and one sensor was used to measure the base excitation. The force sensor was used for application of impulse force on the structure. The response of the system was measured through a data collection system. The sensor set up was arranged in combination of four set up in order to capture the response of every node of the structures. Two sensors in node 21 (top floor) in X direction and Y direction were fixed as the reference sensor and other sensors were changed in respective set up. The experimental test was performed for three structural systems, the base model, base model with bracing in the second and fourth floor and base model with base isolation. Same combination of the sensor arrangement was used for the three structural systems. Fig (3.1) Sensor Arrangement (First and second set up) @ IJTSRD | Unique Paper ID - IJTSRD21704 | Volume – 3 | Issue – 3 | Mar-Apr 2019 Page: 328
International Journal of Trend in Scientific Research and Development (IJTSRD) @ www.ijtsrd.com eISSN: 2456-6470 ?The frictional force if clean and dry surface: = 331.79 N ?The frictional force if lubricated and Greasy Surface = 26.54 N ?Load on each slider = 82.94 N if dry ?Load on each slider = 6.63 N if lubricated ?Acceleration of the shaker required (if clean and dry) =2.45 m/s2 ?Acceleration of the shaker required (if lubricated) = 0.1962 m/s2 During the experiment, the author realized that the acceleration values required to overcome the sliding friction was too high for the shaker. The load from the structure was too high on the copper pipes it was not possible to slide the structure over the copper pipe. In addition, the long copper pipes supported on the wooden strips were acting as beam supported on the support with the cantilevers and the structure load was acted on the cantilever part. This induced additional load on the long copper pipes thus making it more difficult to slide over it. Fi g(3.2) Sensor Arrangement (Third and fourth set up) 3.2.Modeling of Base Isolated System on the Workshop The project objective required a design of a base isolated system to be tested. The 1st design attempt was made using two copper pipes intended to slide over each other. The set up consisted of two long copper pipes of smaller diameter and four small pieces of pipes of larger diameter. The load of the structure was intended to be taken by the small pieces of pipes and required to slide over the length of the long pipes. The long pipes were supported on two strip of wood rigidly fixed in the base plate of the shaker. The larger diameter pipe was inserted in the small diameter pipe and the structure was placed on top of the larger diameter pipe. Fig (3.4) 1st attempt to model a base isolated system (failed attempt) The 2nd design attempt to model a base isolated system was attempted with 8 pieces if GI pipes, like shown in the picture below. The attempt was to roll the structure over the pipes between the two bolts used to fix the wooden plank in the base plate. Fig (3.5) Schematic diagram of the system works for the 2nd design attempt Fig (3.3) Copper pipes used to model the sliding of the structure Design calculation for the design of Base Isolated System (Attempt first): ?Mass of the structure = 33.82 Kg ?Weight of the structure = 331.79 N ?Friction Coefficient between Copper and Copper, • If clean and dry surfaces = 1 • Lubricated and Greasy Surface = 0.08 Fig (3.6) 2nd attempt to model a base isolated system (failed attempt) @ IJTSRD | Unique Paper ID - IJTSRD21704 | Volume – 3 | Issue – 3 | Mar-Apr 2019 Page: 329
International Journal of Trend in Scientific Research and Development (IJTSRD) @ www.ijtsrd.com eISSN: 2456-6470 Four wooden strips were fixed in the base plate of the shaker with the help of bolts. The head of the bolts were intended to limit the movement of the rolling pipes. The structure was placed over the pipes and made to roll over the pipes. The length of the pipes used was not long enough and the whole system was not stable. In the end the author realize that, it is needed to design a base isolated system not only can slide but also stable, so it is needed something which is able to pull the structure back to its initial position. The 3rd or final attempt was finally a success. The used of GI pipes were then replaced by longer copper pipes. The pipes were placed in between the head of the bolt which control the movement of the structure. Also four springs were placed in the middle of the base plate to control the lateral movement of the structure. The spring assured that the system moved back to its original state after excitation. The stiffness of the spring used in the base isolation system was computed experimentally. Since there was no laboratory set up available for the test, the test was performed with only the available materials like wooden clamp and glass for putting the additional load. The test was performed by adding weight to the glass container and thus measuring the elongation of the spring. Fig (3.8) Attempt to measure the stiffness of the spring From the table below, the spring stiffness can be calculated by making an assumption that the spring is still in linear range, even after it was loaded with increasing load. Fig (3.7) 3rd attempt to model base isolated system (success) Mass added (g) 0.00 460.00 228.20 228.60 194.20 Weight (N) 0.00 4.51 2.24 2.24 1.91 Cumulative Weight (N) 0.00 4.51 6.75 8.99 10.90 Length of the spring (cm) 14.60 15.80 16.40 17.00 17.40 Cumulative Elongation (m) 0.000 0.012 0.018 0.024 0.028 SN 1.00 2.00 3.00 4.00 5.00 Table (3.1) Observation of the elongation of the spring The data procession steps consist of: 1.Making the geometry of the structure In order to do this, first the nodes were defined and then connected each node by making a link between nodes to build the structural model. The model consists of 5 storey and 24 nodes. 2.Define the master nodes and the slave nodes 3.Conversion of the digital data obtained into signals 4.Processing the data Sampling frequency of 2048 was used on the experimental test. This step also includes dissemination of the signal, and removal of redundant channels and also assigning degrees of freedom for the nodes. Sensors numbers are assigned to corresponding nodes with direction of measurement. 5.Analyzing the Data using Stochastic Subspace The singular values of the system can be got from this step. These values indicate maximum possible system order equal to 1608. 6.Perform Modal Analysis In this step the dots were selected. The dots represent the Eigen frequency from stabilization plot in order to get the mode shape of the system. 7.Combine the different sensor setup Fig (3.9) Calculation of spring stiffness The stiffness of the spring was found to be 374.7 N/m. 4.Data Processing 4.1.Data Processing with MACEC The data obtained from the experimental testing was processed using MACEC for the determination of model frequencies and modal vectors. MACEC is an analysis tool box of Matlab. MACEC requires definition of the structure with grid with the coordinates of nodes and elements. It also requires assignment of master nodes and slave nodes definition in order to have a complete visualization of the structures and mode shapes. @ IJTSRD | Unique Paper ID - IJTSRD21704 | Volume – 3 | Issue – 3 | Mar-Apr 2019 Page: 330
International Journal of Trend in Scientific Research and Development (IJTSRD) @ www.ijtsrd.com eISSN: 2456-6470 In order to get the full mode shapes of the system, all of the results from different sensor setup were needed to combine. Fig (4.5) 7th mode and 3th mode Fig (4.1) Geometry of the model by making a link between nodes Fig (4.2) Singular value of base model from sensor setup-2 Fig (4.6) 10th mode (b) Mode shape of structure system: braced model Fig (4.3) Stabilization plot and selection of the Eigen frequency to capture the mode shape 4.2.Mode Shapes from Macec (a) Mode shape of structure system: base model Fig (4.7) 1st mode and 4th mode Fig (4.4) 1st mode and 4th mode @ IJTSRD | Unique Paper ID - IJTSRD21704 | Volume – 3 | Issue – 3 | Mar-Apr 2019 Page: 331
International Journal of Trend in Scientific Research and Development (IJTSRD) @ www.ijtsrd.com eISSN: 2456-6470 The frequencies ranges obtained from data processing largely depend on the quality of the experimental data obtained and also on the structural system under observation. The experimental data was obtained for noise excitation of frequency ranging from 0 to 100 Hz and also from impulse excitation. There were some measurement done with sine waves for base isolated structure and the base model. The sine wave data is used for the comparison of the top displacement between the base model and the isolated structural systems. The data was sampling frequency of 2048 was chosen and the time of observation was 200 seconds. In this case, it was able to get 4 Eigen frequencies in the range from 1 to 20 Hz, but from braced model it was only able to get 3 Eigen frequencies in the same range. On the other hand, it was also unable to get the Eigen frequencies for torsion mode. To compensate with this problem, the Eigen frequency was extracted from Impulse excitation result, to have the Eigen frequency for torsion mode. Fig (4.8) 7th mode and 3th mode (c) Mode shape of structure system: base isolated model Fig (4.9) 1st mode and 4th mode Fig (4.11) Comparison of Eigen frequencies of each system from MACEC results From the graph above, it can be seen that the results are more or less similar with the numerical simulation with SAP 2000. Braced model stiffen the structure, so that the Eigen frequency a bit higher. On the other hand, base isolated model make the structure more flexible, indicating by the lower Eigen frequency compare to base model or braced model. 4.4.Comparison of Eigen frequencies from MACEC and SAP 2000 A comparison between the experimental results obtained from data processing from MACEC and numerical results obtained from SAP 2000 is presented below: (a)Eigen frequencies comparison: SAP2000, MACEC (Base Model) Base Model Eigen frequencies(Hz) Mode Shape SAP2000 Mode 1 3,36 Mode 3 3,48 Mode 4 9,82 Mode 7 15,57 Mode 10 20,79 Table (4.2) Eigen frequencies of base model (SAP2000, MACEC) Fig (4.10) 7th mode and 10th mode 4.3.Eigen frequencies from MACEC The analysis of experimental data showed that there were some jumps in the frequencies values for all the three experimental set up. It was noted that frequency range of Model 10 for the braced system obtained from numerical simulation was not available. Similar was the case with the torsion mode for the base isolated system. Eigen frequencies(Hz) MACEC 3,1 3,4 9,24 14,52 19 Base Isolated Model 1.30 - 5.61 14.64 19.00 Mode Number Base model Braced model Type Mode 1 Mode 3 Mode 4 Mode 7 Mode10 Table (4.1) Eigen frequencies between each system 3.10 3.40 9.24 14.52 19.00 3.40 4.30 10.79 16.00 - Translation Torsion Translation Translation Translation @ IJTSRD | Unique Paper ID - IJTSRD21704 | Volume – 3 | Issue – 3 | Mar-Apr 2019 Page: 332
International Journal of Trend in Scientific Research and Development (IJTSRD) @ www.ijtsrd.com eISSN: 2456-6470 4.5.Model Assurance Criteria (MAC) The model assurance criteria for comparison between the model shapes derived from the experimental analysis and obtained from the numerical simulation of the structure has been calculated using the following relation. The MAC values range between 0 and 1. The Mac value near one indicates that the two compared modes are identical and result from numerical simulation and experiments are in coherence. Mac values near 0 indicate that the two modes are not comparable and the results from numerical and experimental results are not in coherence. Fig (4.12) Comparison of Eigen frequencies of base model (b)Eigen frequencies compare: SAP2000, MACEC (Braced Model) Braced Model Eigen frequencies(Hz) Mode Shape SAP2000 Mode 1 Mode 3 Mode 4 10,04 Mode 7 15,57 Mode 10 20,79 Table (4.3) Eigen frequencies of braced model (SAP2000, MACEC) The modal vectors for the calculation of the MAC are extracted from the MACEC and from the SAP 2000 model. MACEC 3,4 4,3 10,79 16 - 3,44 4,45 Mode 1 3 4 7 10 MAC 0.58 0.99 0.51 0.59 0.80 Table (4.5) MAC Values for Base Model Mode 1 3 4 7 MAC 0.97 0.99 0.86 0.84 Table (4.6) MAC Values for Braced Model Mode 1 4 8 10 MAC 0.52 0.45 0.49 0.61 Table (4.7) MAC Values for Isolated Model 4.6.Data Processing with LABVIEW LABVIEW software is used as a tool to extract the portion of the data in order to get the signal from the digital data obtained from the experimental analysis. The *.lvm files are the time history data with the one column being the time and other column the response acceleration measured. Every lvm file contained 2 second time interval data. Since we had the measurement for 200 sec for every measurement, this means that we have 100 *.lvm file that we need in order to get the time history signal. Since a periodic sine function input was applied to excite the structure, we only took 4 measurement data, which meant that we have a time history signal with duration for 8 sec. Both the structure systems (Base model and Base isolated model) were excited with sine function excitation with same amplitude and frequency. For measurement data without base isolation, we used measurement 2nd with the frequency 1.7 Hz and amplitude of 0.2 m/s2 and for measurement data with base isolation we used measurement 18th with the frequency with the same frequency and amplitude. The experimental data was processed using the Labview. The acceleration data was two times integrated to get the displacement history and relative displacement between the top nodal displacement and the support displacement was computed. The obtained result shows that there is significant reduction in the relative displacement of a base isolated system. Fig (4.13) Comparison of Eigen frequencies of braced model (c)Eigen frequencies compare: SAP2000, MACEC (Base Isolated Model) Base Isolated Model Eigen frequencies(Hz) Mode Shape Mode 1 Mode 3 Mode 4 Mode 7 Mode 10 Table (4.4) Eigen frequencies of base isolated model (SAP2000, MACEC) SAP2000 1,36 2,26 7,25 13,83 18,87 MACEC 1,3 - 5,61 14,64 19 Fig (4.14) Comparison of Eigen frequencies of base isolated model @ IJTSRD | Unique Paper ID - IJTSRD21704 | Volume – 3 | Issue – 3 | Mar-Apr 2019 Page: 333
International Journal of Trend in Scientific Research and Development (IJTSRD) @ www.ijtsrd.com eISSN: 2456-6470 Fig (4.15) Output from Lab View (Calculation of Relative Displacements) 5.Numerical Simulation in SAP 2000 Using Experimental Data Numerical simulation for base isolated model also performed. This time SAP2000 is used to analyze the base isolated structure with time history function. It was taken the data in the range of 5 sec only, because SAP2000 took a lot of time to load the measurement file, if all the data are used. In the end, the measured response and the simulated response are compared in the graph below: Fig (5.1) Comparison of response (Experimental and Numerical) for base isolated model @ IJTSRD | Unique Paper ID - IJTSRD21704 | Volume – 3 | Issue – 3 | Mar-Apr 2019 Page: 334
International Journal of Trend in Scientific Research and Development (IJTSRD) @ www.ijtsrd.com eISSN: 2456-6470 6.Discussions and Conclusion The project aimed at experimental analysis of the base isolated system in comparison to a base model. The base isolated system was designed using available material and equipments in the lab. The experimental result showed that the system used for base isolation reduced the time period of the structure and the relative displacement of the top with respect to the support. The base isolated system introduced in the structure make the structure more flexible thus reduced the affect of the earthquake loads on the structure. The use of bracing elements stiffens the structure. It provides additional stiffness to the structure and decreases in time period. The model itself needs some improvement regarding the stability of the structure and also robustness to have similar result in repeated measurements. The base isolated method largely depends on the behaviors of the springs attached which provided the stability to the structure. The base isolation system can be improved by providing stable arrangement of spring system and also introducing dampers to reflect the real time model for base isolation. The analysis of the experiment data showed some deviation from the results obtained from the numerical results. Model frequency value for the second mode for base isolated system show deviation from the numerical result. The spring analogy was used for modeling in SAP as isolators while the real structure was isolated using steel pipes and making roll over the pipes. The deviation may have resulted due to some minor difference in the principles applied for modeling of base isolation. The experimental results are also affected by the distribution of the sensor. The mass of the sensor also contributes to the response of the structure. The sensor arrangement had a mass concentration in every floor. The sensor arrangement should be arranged that there is no mass concentration and thus result minimum contribution to the structural response. 7.References [1]Dynamics of Structures, Ray W Clough and Joseph Penzien [2]Dynamics of Structures, A K Chopra [3]Lecture Notes – Dr. Ing Volkmar Zabel [4]“An Automatic mode selection strategy for model updating using the Modal Assurance Criterion and Modal Strain Energies”, M. Brehm, Volkmar Zabel, C. Buchery and D. Ribeiro [5]http://en.wikipedia.org/ @ IJTSRD | Unique Paper ID - IJTSRD21704 | Volume – 3 | Issue – 3 | Mar-Apr 2019 Page: 335