Download
1 / 7
70 likes | 75 Vues
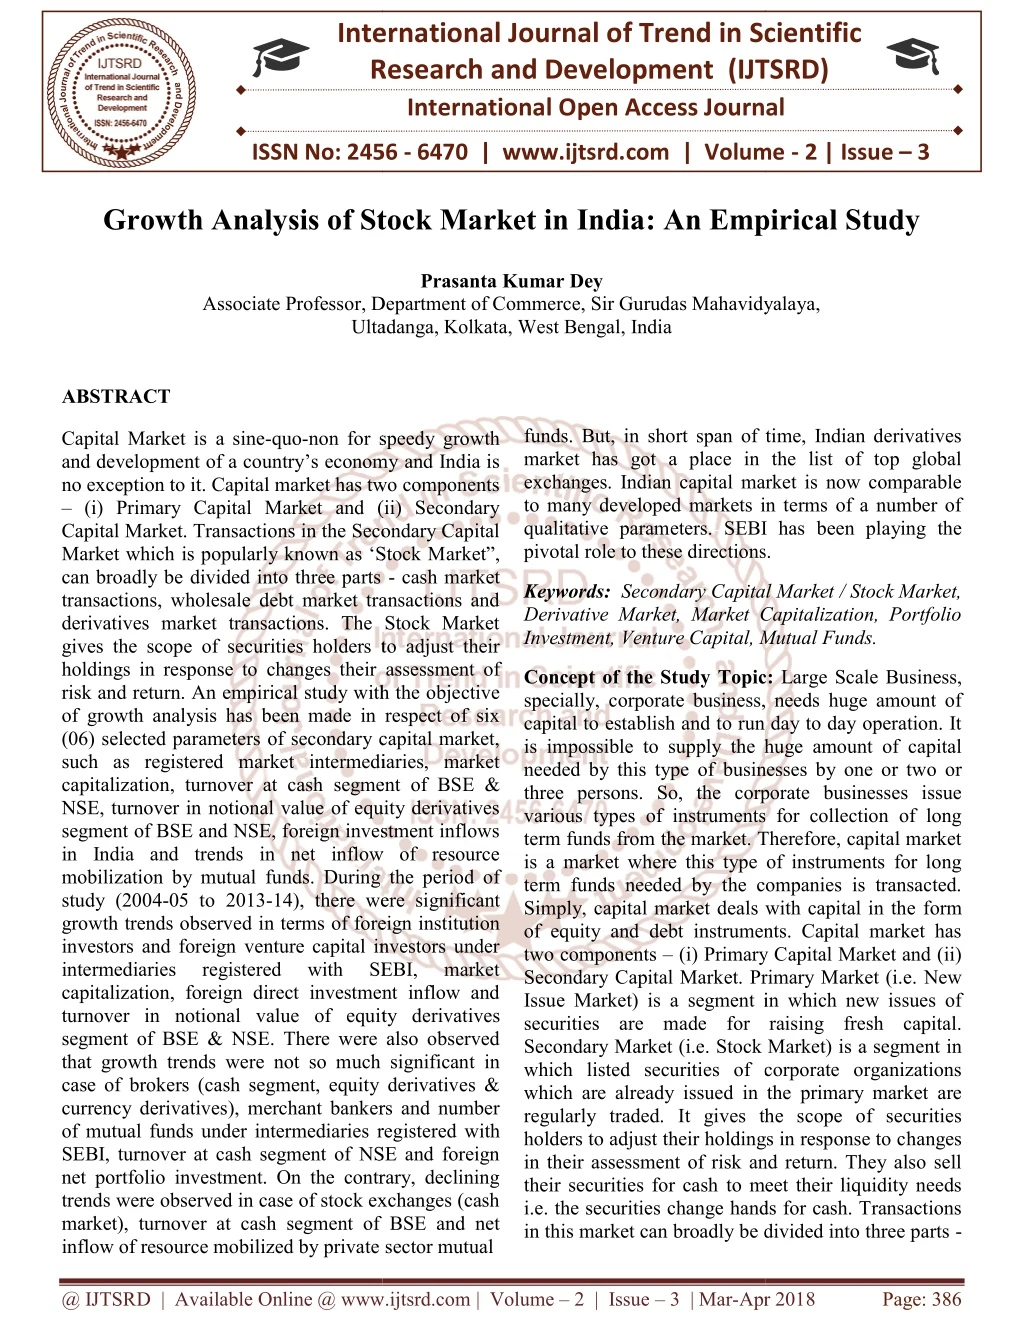
Capital Market is a sine quo non for speedy growth and development of a country's economy and India is no exception to it. Capital market has two components i Primary Capital Market and ii Secondary Capital Market. Transactions in the Secondary Capital Market which is popularly known as 'Stock Market, can broadly be divided into three parts cash market transactions, wholesale debt market transactions and derivatives market transactions. The Stock Market gives the scope of securities holders to adjust their holdings in response to changes their assessment of risk and return. An empirical study with the objective of growth analysis has been made in respect of six 06 selected parameters of secondary capital market, such as registered market intermediaries, market capitalization, turnover at cash segment of BSE and NSE, turnover in notional value of equity derivatives segment of BSE and NSE, foreign investment inflows in India and trends in net inflow of resource mobilization by mutual funds. During the period of study 2004 05 to 2013 14 , there were significant growth trends observed in terms of foreign institution investors and foreign venture capital investors under intermediaries registered with SEBI, market capitalization, foreign direct investment inflow and turnover in notional value of equity derivatives segment of BSE and NSE. There were also observed that growth trends were not so much significant in case of brokers cash segment, equity derivatives and currency derivatives , merchant bankers and number of mutual funds under intermediaries registered with SEBI, turnover at cash segment of NSE and foreign net portfolio investment. On the contrary, declining trends were observed in case of stock exchanges cash market , turnover at cash segment of BSE and net inflow of resource mobilized by private sector mutual funds. But, in short span of time, Indian derivatives market has got a place in the list of top global exchanges. Indian capital market is now comparable to many developed markets in terms of a number of qualitative parameters. SEBI has been playing the pivotal role to these directions. Prasanta Kumar Dey "Growth Analysis of Stock Market in India: An Empirical Study" Published in International Journal of Trend in Scientific Research and Development (ijtsrd), ISSN: 2456-6470, Volume-2 | Issue-3 , April 2018, URL: https://www.ijtsrd.com/papers/ijtsrd10895.pdf Paper URL: http://www.ijtsrd.com/management/accounting-and-finance/10895/growth-analysis-of-stock-market-in-india-an-empirical-study/prasanta-kumar-dey<br>

E N D
International Resea Research and Development (IJTSRD) International Open Access Journal Growth Analysis of Stock Market in India: An Empirical Study International Journal of Trend in Scientific Scientific (IJTSRD) International Open Access Journal ISSN No: 2456 ISSN No: 2456 - 6470 | www.ijtsrd.com | Volume 6470 | www.ijtsrd.com | Volume - 2 | Issue – 3 Growth Analysis of Stock Market in India An Empirical Study Prasanta Kumar Dey Associate Professor, Department of Commerce, Sir Gurudas Mahavidyalaya, Associate Professor, Department of Commerce, Sir Gurudas Mahavidyalaya, Ultadanga, Kolkata Associate Professor, Department of Commerce, Sir Gurudas Mahavidyalaya, Ultadanga, Kolkata, West Bengal, India ABSTRACT Capital Market is a sine-quo-non for speedy gr and development of a country’s economy and India is no exception to it. Capital market has two components – (i) Primary Capital Market and (ii) Secondary Capital Market. Transactions in the Secondary Capital Market which is popularly known as ‘Stock M can broadly be divided into three parts transactions, wholesale debt market transactions and derivatives market transactions. The Stock Market gives the scope of securities holders to adjust their holdings in response to changes their risk and return. An empirical study with the objective of growth analysis has been made in respect of six (06) selected parameters of secondary capital market, such as registered market intermediaries, market capitalization, turnover at cash segment of BSE & NSE, turnover in notional value of equity derivatives segment of BSE and NSE, foreign investment inflows in India and trends in net inflow of resource mobilization by mutual funds. During the period of study (2004-05 to 2013-14), there we growth trends observed in terms of foreign institution investors and foreign venture capital investors under intermediaries registered capitalization, foreign direct investment inflow and turnover in notional value of equity derivatives segment of BSE & NSE. There were also observed that growth trends were not so much significant in case of brokers (cash segment, equity derivatives & currency derivatives), merchant bankers and number of mutual funds under intermediaries reg SEBI, turnover at cash segment of NSE and foreign net portfolio investment. On the contrary, declining trends were observed in case of stock exchanges (cash market), turnover at cash segment of BSE and net inflow of resource mobilized by private sector mutual funds. But, in short span of time, Indian derivatives market has got a place in the list of top global exchanges. Indian capital market is now comparable to many developed markets in terms of a number of qualitative parameters. SEBI has been playing the funds. But, in short span of time, Indian derivatives market has got a place in the list of top global exchanges. Indian capital market is now comparable to many developed markets in terms of a number of qualitative parameters. SEBI has pivotal role to these directions. pivotal role to these directions. non for speedy growth and development of a country’s economy and India is no exception to it. Capital market has two components (i) Primary Capital Market and (ii) Secondary Capital Market. Transactions in the Secondary Capital Market which is popularly known as ‘Stock Market”, can broadly be divided into three parts - cash market transactions, wholesale debt market transactions and derivatives market transactions. The Stock Market gives the scope of securities holders to adjust their Secondary Capital Market / Stock Market, Derivative Market, Market Capitalization, Portfolio Keywords: Secondary Capital Market / Stock Market, Derivative Market, Market Capitalization, Portfolio Investment, Venture Capital, Mutual Funds. Investment, Venture Capital, Mutual Funds. assessment of Concept of the Study Topic specially, corporate business, needs huge amount of capital to establish and to run day to day operation. It is impossible to supply the huge amount of capital needed by this type of businesses by one or two or three persons. So, the corporate businesses issue various types of instruments for collection of long term funds from the market. Therefore, capital market is a market where this type of instruments for long term funds needed by the companies is transacted. Simply, capital market deals with capital in the of equity and debt instruments. Capital market has two components – (i) Primary Capital Market and (ii) Secondary Capital Market. Primary Market (i.e. New Issue Market) is a segment in which new issues of securities are made for raising fresh capital. Secondary Market (i.e. Stock Market) is a segment in which listed securities of corporate organizations which are already issued in the primary market are regularly traded. It gives the scope of securities holders to adjust their holdings in response to c in their assessment of risk and return. They also sell their securities for cash to meet their liquidity needs i.e. the securities change hands for cash. Transactions in this market can broadly be divided into three parts in this market can broadly be divided into three parts - Concept of the Study Topic: Large Scale Business, lly, corporate business, needs huge amount of capital to establish and to run day to day operation. It is impossible to supply the huge amount of capital needed by this type of businesses by one or two or three persons. So, the corporate businesses issue arious types of instruments for collection of long term funds from the market. Therefore, capital market is a market where this type of instruments for long term funds needed by the companies is transacted. Simply, capital market deals with capital in the form of equity and debt instruments. Capital market has (i) Primary Capital Market and (ii) Secondary Capital Market. Primary Market (i.e. New Issue Market) is a segment in which new issues of securities are made for raising fresh capital. Secondary Market (i.e. Stock Market) is a segment in which listed securities of corporate organizations which are already issued in the primary market are regularly traded. It gives the scope of securities holders to adjust their holdings in response to changes in their assessment of risk and return. They also sell their securities for cash to meet their liquidity needs i.e. the securities change hands for cash. Transactions risk and return. An empirical study with the objective of growth analysis has been made in respect of six (06) selected parameters of secondary capital market, such as registered market intermediaries, market segment of BSE & NSE, turnover in notional value of equity derivatives segment of BSE and NSE, foreign investment inflows in India and trends in net inflow of resource mobilization by mutual funds. During the period of 14), there were significant growth trends observed in terms of foreign institution investors and foreign venture capital investors under intermediaries registered capitalization, foreign direct investment inflow and with with SEBI, SEBI, market market ty derivatives segment of BSE & NSE. There were also observed that growth trends were not so much significant in case of brokers (cash segment, equity derivatives & currency derivatives), merchant bankers and number of mutual funds under intermediaries registered with SEBI, turnover at cash segment of NSE and foreign net portfolio investment. On the contrary, declining trends were observed in case of stock exchanges (cash market), turnover at cash segment of BSE and net te sector mutual @ IJTSRD | Available Online @ www.ijtsrd.com ailable Online @ www.ijtsrd.com | Volume – 2 | Issue – 3 | Mar-Apr 2018 Apr 2018 Page: 386
International Journal of Trend in Scientific Research and Development (IJTSRD) ISSN: 2456-6470 cash market transactions, wholesale debt market transactions and derivatives market transactions. Capital Market is a sine-quo-non for speedy growth and development of a country’s economy and India is no exception to it. So, as a student of commerce, the ‘Growth Analysis of Stock Market in India – An Empirical Study’ has been chosen as study topic to discuss. Objectives of the Study: The present study is mainly aimed at evaluating and analyzing the growth achieved by the stock market on the basis of six (06) selected parameters of stock market. The other objectives are – (1) to mention the recent major reforms of capital market in India; (2) to evaluate and analyze the selected parameters empirically, and (3) to make some concluding remarks for further growth and development of the stock market in India. Needs of the Study: The study may help to understand the followings: (1)Conceptual framework of stock market. (2)Various dimensions of stock market. (3)Various economic reforms already made for the growth and development of stock market. (4)Growth trends of the stock market. (5)Course of actions needed for further growth and development of the stock market. Methodology of the Study: The study covers the period from 2004-05 to 2013-14. The data used in the study are all secondary data. These are collected mainly from Handbook of Statistics on the Indian Securities Market published by SEBI. The study is a combination of both theoretical as well as analytical works. The whole work is to some extent narrative and to a greater extent, it is analytical. In the work, the procured data have been analyzed by using various statistical tools and techniques with a view to evaluating the growth of Indian stock market during the period of the study. To analyze the data, various arithmetical and statistical tools like Percentage, Mean and Growth Rate have been used to have an idea on the general profile of the variables. To measure the growth achieved by the Indian stock market during the period of study, the exponential growth rate has been computed. Limitations of the Study: (1) the study has been made on the basis of six (6) parameters only. (2) Secondary data have been considered for ten (10) years only.(3) Exponential growth rate has been computed only to explain growth rate stock market. Capital Market Instruments: (A)Basic Instruments - (1)Equity / Ordinary Shares (2)Preference Shares (3)Debentures / Bonds / Treasury Notes (4)Innovative Debt Instruments/Securities: (a)Convertible Debentures / Bonds (b)Call able / Putt able Bonds / Debentures (c)Warrants (d)Zero Interest Bonds (ZIBs) / Debentures (e)Deep Discount Bond (DDB) (f)Secured Premium Notes (SPNs) (g)Floating Rate Bonds (FRBs) (B)Derivative Instruments – (1)Index Futures e.g. Sensex Future (BSX), Nifty Future (NFUTIDX NIFTY), Bank Nifty Future, CNX IT Future etc. (2)Index Options e.g. Option on Nifty, Option on Bank Nifty, Option on CNX IT etc. (3)Stock Futures (4)Stock Options Investment in Indian Capital Market: (A)Investment by Indian - (a)Individual Investors (b)Institutional Investors (i)Investment Trust (ii)UTI (iii)LICI (iv)GICI (v)Investment Bank (vi)Development Banks – IDBI, IFCI, ICICI, SIDBI, NABARD etc. (B)Investment by Foreigner - (a)Foreign Direct Investment (b)Foreign Collaboration (c)Loan Raised from Government of Other Countries (d)Loans from World Bank, IMF, ADB (e)External Commercial Borrowings (ECB) (f)Foreign Institution Investment Major Capital Market Reforms: Few capital market reforms are mentioned here - @ IJTSRD | Available Online @ www.ijtsrd.com | Volume – 2 | Issue – 3 | Mar-Apr 2018 Page: 387
International Journal of Trend in Scientific Research and Development (IJTSRD) ISSN: 2456-6470 1)Establishment of the Securities and Exchange Board of India (SEBI) in 1988. 2)Establishment of Creditors Rating Agencies viz. Credit Rating Information Services of India Limited (CRISIL) in1988, Investment Information and Credit Rating Agency of India Limited (ICRA) in1991, Credit Analysis and Research Limited (CARE) in 1993, Onida Individual Credit Rating Agency (ONICRA) in 1993 and Duff and Phelps Credit Rating (India) Pvt. Ltd. in 1996. 3)Establishment of NSE in 1994. 4)Setting up of Merchant Banking Division by Indian & Foreign Commercial Banks. 5)Introduction of Electronic Transactions. 6)Introduction of Book Building System. 7)Introduction of Green Shoe Option. 8)Registration of Foreign Institutional Investor (FIIs). 9)Introduction of Trading of Government Securities on the Stock Exchanges. 10)Setting up of Mutual Funds. 11)Introduction of Nomination Facility for unit holders of Mutual Funds. 12)Permission of Leasing Companies and Venture Capital Companies. 13)Introduction of Derivatives Trading at BSE and NSE. 14)Setting up of Insurance Regulatory and Development Authority (IRDA) in 2000. 15)Setting up of Multi Commodity Exchange (MCX) for Commodity Trading. Etc. Statistical Analysis SEBI Registered Market Intermediaries play an important role in the stock market in canalizing the financial resources from savers to investors. The role of professionally managed market intermediaries is very important for business finance and growth of stock market. The market requires services of a variety of intermediaries to bring the suppliers and users of funds together for mutual benefit. The stock market is comprised with so many middlemen who are popularly known as stock market participants or intermediaries. SEBI is the sole authority to recognize, supervise and control the activities of all intermediaries. Intermediaries: Table 1: SEBI Registered Market Intermediaries 2004 -05 -06 -07 -08 23 23 22 Market Intermediaries 2005 2006 2007 2008 -09 19 2009 -10 19 2010 -11 19 2011- 12 19 2012- 13 20 2013- 14 20 19 1. Stock Exchanges (Cash Market) 2. Stock Exchanges (Derivatives Market) 3. Brokers (Cash Segment) 4. Brokers (Equity Derivatives) 5. Brokers (Currency Derivatives) 6. Depository Participants 7. Merchant Bankers 8. Mutual Funds 9. Foreign Institutional Investors 10. Foreign Venture Capital Investors Source: SEBI Handbook of Statistics 2 2 2 2 2 2 2 2 3 3 9,128 1,003 1,188 1,349 1,575 1,770 1,899 2,301 2,337 9,335 9,443 9,487 8,652 8,804 9,235 9,307 10,128 2,957 9,135 3,072 NA NA NA NA 1,202 1,450 1,894 2,173 2,330 2,406 477 526 593 654 714 758 805 854 865 866 128 39 685 130 38 882 152 40 997 155 40 1,319 1,635 1,713 1,722 1,765 134 44 164 47 192 51 200 49 198 52 1,757 199 51 1,739 14 39 78 97 129 143 153 175 182 193 @ IJTSRD | Available Online @ www.ijtsrd.com | Volume – 2 | Issue – 3 | Mar-Apr 2018 Page: 388
International Journal of Trend in Scientific Research and Development (IJTSRD) ISSN: 2456-6470 The Table 1shows the summary of selected ten SEBI recognized stock market intermediaries who have formally been taking part in capital market (both primary and secondary) operations. During 2004-05 to 2013-14, there were significant increases in the number of various classes of intermediaries registered with SEBI such as Brokers (Equity Derivatives), Brokers (Currency Derivatives), Foreign Institutional Investors, and Foreign Venture Capital Investors. At the same time, number of Stock Exchanges (Derivatives Market) remained more or less unchanged. Again, the number of Stock Exchanges (Cash Market) decreased from 23 to 20. The Indian broking industry has undergone structural changes during the recent years. Brokers are the key players in the transactions of Secondary Capital Market. Data in the Table 1show that the number of total brokers in traditional cash segment was 9,128 in 2004-05 and it rose to 9,135 in 2013-14 reckoning a 1 percent growth per year. Whereas, the derivatives market in India is very much new and the number of brokers in equity derivatives market grew from 1,003 in 2004-05 to 3,072 in 2013-14 showing a rise of 6.36 percent per year. The number of Foreign Institutional Investors which was 685 in 2004-05 rose to 1,739 in 2013-14 registering a growth of 5.14 percent during this period. The worth noting growth was observed in case of Foreign Venture Capital Investors showing a rise of 12.85 percent. During the study period, the overall growth of these selected 10 SEBI Registered Market Intermediaries was 3.21 percent. Movement of Number of Listed Companies and Market Capitalization: According to Section 73(1) of the Indian Companies Act, 1956, listing of specific security is essential to get the privilege of floor trading in a stock exchange. From the Table 2 of listed companies, the number of listed companies with BSE got up from 4,731 in 2004-05 to 5,541 in 2013- 14 showing an increase of 0.75 percent per year. In case of NSE, the number of listed companies grew up from 970 in 2004-05 to 1,708 in 2013-14, registering a rise of 3.10 percent per year. Comparing between BSE and NSE, it is clear that companies have preferred NSE instead of BSE for listing their stocks. Table 2: Number of Listed Companies and Market Capitalization Year No. of Listed Companies (Rs. in Crore) 2004-05 4,731 16,98,428 2005-06 4,781 30,22,191 2006-07 4,821 35,45,041 2007-08 4,887 51,38,014 2008-09 4,929 30,86,075 2009-10 4,975 61,65,619 2010-11 5,067 68,39,084 2011-12 5,133 62,14,941 2012-13 5,211 53,48,645 2013-14 5,541 74,15,296 Source: SEBI Handbook of Statistics BSE NSE Market Capitalization No. of Listed Companies 970 1,069 1,228 1,381 1,432 1,470 1,574 1,646 1,666 1,708 Market Capitalization (Rs. in Crore) 15,85,585 28,13,201 33,67,350 48,58,122 28,96,194 60,09,173 67,02,616 60,96,518 52,32,273 72,77,720 Market Capitalization (MC) is considered as an important indicator of growth of stock market and it is obtained by multiplying the total number of shares listed on the stock exchange by the market price per share of that stock exchange. Again, MC plays an important role when shares are offered or acquired in a competitive environment especially in the global market. Over the years, the Stock Market in India has become stronger. With the increase in the number of listed companies, market capitalization also moved up. Among 23 stock exchanges in India, BSE and NSE are the most active exchanges followed by UPSE, ASE and CSE (not shown in the table). It is @ IJTSRD | Available Online @ www.ijtsrd.com | Volume – 2 | Issue – 3 | Mar-Apr 2018 Page: 389
International Journal of Trend in Scientific Research and Development (IJTSRD) ISSN: 2456-6470 seen from the table that the MC in BSE recorded a compounded increase of 6.77 percent per year during 2004-05 to 2013-04. But in case of NSE, the annual compounded GR of MC for the same period is comparatively better i.e. 7.12 percent per year. Turnover at Cash Segment of BSE & NSE: Turnover on a stock exchange is an important indicator of liquidity and also the indicator of growth of the stock exchange. Both the investors as well as the brokers prefer those stock exchanges where turnovers are high. The issuers, in the cases of IPOs and also in the cases of subsequent issues, choose only the high turnover stock exchanges for the purpose of listing of their securities. It is our common experience that the companies proceed for delisting of their securities from the stock exchanges where turnover is very thin or where turnover has come down to zero. In this part of the study, an attempt has been made to analyze the trend of turnovers on BSE and NSE. Table 3: Turnover at Cash Segment of BSE & NSE (Rs. in Crore) Year BSE 2004-05 5,18,717 2005-06 8,16,074 2006-07 9,56,185 2007-08 15,78,857 2008-09 11,00,075 2009-10 13,78,809 11,05,027 6,67,498 5,48,774 5,21,664 35,77,410 28,10,893 27,08,279 28,08,488 2010-11 2011-12 2012-13 2013-14 Source: SEBI Handbook of Statistics Data relating to turnover on BSE and NSE (in Cash Segments) for the period 2004-05 to 2013-14 are shown in the Table 3. During the period under review, turnover of BSE increased from Rs. 5,18,717 Crore in 2004-05 to Rs. 5,21,664 Crore in 2013-14 registering an average decreasing rate of 1.62 percent per year during the whole period. But, in case of NSE, it was increased from Rs. 11,40,072 Crore in 2004-05 to Rs. 28,08,488 Crore in 2013-14 registering a compound growth rate of 4.41 percent per year which was better than BSE. Turnover in Notional Value of Equity Derivatives Segment of BSE and NSE: Introduction of exchange traded derivatives is one of the significant developments in the history of Indian Capital Market. In India, derivatives trading began with the launch of index futures in June, 2000 followed by Index Options, Stock Options and Stock Futures in 2001. The two premier stock exchanges, namely BSE and NSE provide trading platforms for derivatives transactions. Presently, the Indian derivatives market is dominated by NSE with a share of over 99 percent of the total turnover as well as number of contracts. NSE 11,40,072 15,69,558 19,45,287 35,51,037 27,52,023 41,38,023 Table 4: Notional Value of Equity Derivatives Segment of BSE and NSE (Rs. in Crore) BSE Index Stock Futures Options Future s 13,600 2,298 213 2 5 3 1 0 55,491 0 3,515 0 2,34,660 39 7,609 0 11,757 9 9 0 96 138 0 0 154 0 0 0 1,78,449 6,18,343 10,216 1,469 1,22,374 70,27,481 3,418 10,246 63,494 90,55,201 54,609 46,131 Source: SEBI Handbook of Statistics NSE Year Index Stock Options Futures Options Futures Options 7,72,174 15,13,791 25,39,575 38,20,667 35,70,111 39,34,389 43,56,755 35,77,998 25,27,131 30,85,297 1,21,954 3,38,469 7,91,912 13,62,111 37,31,501 80,27,965 1,83,65,366 2,27,20,032 2,27,81,574 2,77,67,341 14,84,067 27,91,721 38,30,972 75,48,563 34,79,642 51,95,247 54,95,757 40,74,671 42,23,872 49,49,282 1,68,858 1,80,567 1,93,811 3,59,136 2,29,227 5,06,065 10,30,344 9,77,031 20,00,427 24,09,488 2004-05 2005-06 2006-07 2007-08 2008-09 2009-10 2010-11 2011-12 2012-13 2013-14 @ IJTSRD | Available Online @ www.ijtsrd.com | Volume – 2 | Issue – 3 | Mar-Apr 2018 Page: 390
International Journal of Trend in Scientific Research and Development (IJTSRD) ISSN: 2456-6470 The growth rates of Notional Value of Equity Derivatives Segment of BSE for Index Futures and for Index Options show 21.26 percent per year and 104.20 percent per year respectively. Again, the growth rates of Notional Value of Equity Derivatives Segment of BSE for Stock Futures and for Stock Options are 28.67 percent per year and 78.66 percent per year separately. But, the growth rates of Notional Value of Equity Derivatives Segment of NSE for Index and Stock are 5.68 percent & 36.91 percent and 4.20 percent & 14.94 percent per year respectively. Combining Index Futures & Index Options and Stock Futures & Stock Options, the overall growth rate of Notional Value of Equity Derivatives Segment of BSE is found to be 58.20 percent per year and the same for NSE is 15.43 percent per year. Considering altogether, we get it as 36.81 percent per year. Foreign Investment Inflows in India: The Private Foreign Investments play an important role in corporate finance of India. The private foreign investments in Indian Capital Market come in two ways - such as Foreign Direct Investment (FDI) and Foreign Portfolio Investment (FPI). Foreign Portfolio Investment is comprised with investment in ADRs/GDRs, investment by Foreign Institutional Investors (FIIs) and investment in offshore funds and others. Again, foreign investment flows to India in the form of FDI and Euro-Issues (AGRs/GDRs) can be treated as primary market investment and investment by FIIs can be treated as secondary market investment. India liberalized her FDI policy regime considerably since 1991. “The rationale of FDI flows, it is well known, is that foreign savings supplementing domestic savings would help augment that in turn would push up growth, given the productivity of investment”. Table 5: Foreign Investment Inflows in India (Rs. in Billion) Year Net Direct Investment 2004-05 167 2005-06 134 2006-07 349 2007-08 638 2008-09 1,000 2009-10 858 2010-11 541 1,021 1,079 1,300 851 1,466 297 1,872 2,545 1,597 2011-12 2012-13 2013-14 Note: Net = Investment in India minus Investment by India Source: SEBI Handbook of Statistics Foreign investment flows into India, comprising FDI and FPI, rose, but not sharply, during the study period 2004-05 to 2013-14 following liberalized foreign policies. Net Direct Investment (NDI) increased from Rs. 167 Billion in 2004-05 to Rs. 1,300 Billion in 2013-14 (Table 5) with yearly compounded growth rate was found to be 12.13 percent but Net Portfolio Investment (NPI) rose from Rs. 413 Billion in 2004- 05 to Rs. 1,106 Billion in 2007-08 and it dropped to negative NPI Rs. 651 in 2008-09 and again it jumped to Rs. 1,466 Billion in 2012-13 and again it moved up to Rs. 297 Billion in 2013-14 showing a growth 3.16 percent per year for whole study period. The overall yearly compounded growth rate for the whole study period 2004-05 to 2013-14 worked out to 8.11 percent per year. Trends in Net Inflow of Resource Mobilization by Mutual Funds: Mutual Funds are the important avenues through which households participate in the capital market in indirect ways. Mutual Funds (MFs) are financial intermediaries of Capital Market and the MFs collect the savings of investors and invest them in a large and well diversified portfolio of securities such as money market instruments, corporate and government bonds and equity shares of joint stock companies. By virtue of SEBI (Mutual Funds) Regulations, 1993, Private Sector MFs have been allowed to operate and it commenced operations in the Indian Capital Market since 1993-94. As on 31st March, 2005, there were 39 MFs registered with SEBI of which 31 belonged to the Private Sector and 8 (including the UTI MF) were in the Public Sector. In this part, an attempt has been made to analyze the trends in Net Inflow of Resource Mobilization by Mutual Funds. Table 6: Net Inflow of Resource Mobilization by Mutual Funds (Rs. in Crore) Year Private Sector Sector 2004-05 7,600 (2,677) 2005-06 42,977 6,379 2006-07 79,038 7,621 2007-08 1,33,304 10,677 2008-09 (34,018) 9,380 2009-10 54,928 15,653 2010-11 (19,215) (16,636) Net Portfolio Investment 413 554 319 1,106 (651) 1,540 1,394 Total Public UTI Total 580 678 668 1,744 349 2,298 1,935 (2,722) 3,424 7,326 9,820 (3,658) 12,499 12,499 2,200 52,779 93,985 1,53,802 (28,296) 83,080 (49,406) @ IJTSRD | Available Online @ www.ijtsrd.com | Volume – 2 | Issue – 3 | Mar-Apr 2018 Page: 391
International Journal of Trend in Scientific Research and Development (IJTSRD) ISSN: 2456-6470 1)Bhaskara, P. Vijaya & Mahapatra, B. (2003), Derivatives Simplified: An Introduction to Risk Management, Sage Publication, New Delhi 2)Majumdar, A.K. and Kapoor. G. K. (2005), Students’ Guide To Company Law, Taxmann Publications (P) Ltd., New Delhi 3)Rao, N. K. (1988), Stock Market Efficiency: The Indian Experience. Reprinted in Gupta, O.P (1989): Stock Market Efficiency and Price Behavior, Anmol Publications, New Delhi 4)Sarkhel Jaydeb and Arindam Gupta (2002), Capital Market: Theory And Institutions, Book Syndicate Private Ltd. 5)Vashisht, A. K. & Gupta, R. K. (2005), Investment Management and Stock Market, Deep & Deep Publication Pvt. Ltd. New Delhi Articles in Journals: 1)Vashistha, S. D., The Secondary Capital Market: Some Important Aspects, The Indian Journal of Commerce, Conference Issue (2001), Vol. 54 No. 4 2)Vijaysingh Thakur Devendrasingh, Emerging Issues in Capital Market, The Indian Journal of Commerce, Conference Issue (2001), Vol. 54 No. 4 3)Thakur, P. C. and J. Raghakardar Pal Singh, Reflections on the Changing Scenario of the Indian Stock Exchanges, The Indian Journal of Commerce,Conference Issue (2001), Vol. 54 No. 4 Reports: 1)BSE Annual Report 2013-14 2)NSE Annual Report 2013-14 3)SEBI Annual Reports, 2012-2013 & 2013-2014 4)World Investment Report, 2007, Published by Academic Foundations, New Delhi- 110002 Websites 1)www.bseindia.com 2)www.capitalindia.com 3)www.capitalmarket.com 4)www.finmin.nic.in 5)www.indiainfoline.com 6)www.nseindia.com 7)www.sebi.gov.in 2011-12 (15,446) 2012-13 2013-14 Source: SEBI Handbook of Statistics During the study period, net inflow, after redemption from Gross Resource Mobilization, the yearly compounded growth rates of Private Sector MFs, Public Sector MFs and UTI MFs were (-) 33.93 percent, 2.36 percent and 9.67 percent respectively. The sectoral shares in ultimate net inflow indicated the dominance of Private sector Mutual Funds. Concluding Remark and Suggestion for further Growth of Stock Market in India: Considering six (06) selected parameters, the highest growth rate (36.81 percent per year) was observed in respect of “Equity Derivatives Segment of BSE & NSE” whereas the lowest growth rate (1.39 percent per year) was observed in respect of “Turnover at Cash Segment of BSE & NSE”. Finally, it is observed that the Indian Stock Market has grown at an average rate 3.87 percent as measured by taking the simple average of percentages of six (06) selected parameters considered as above. Now, we may conclude that Indian Stock Market is a growing market. For achieving further growth, the following suggestions may be helpful: (1)More and more companies should come forward with Green Shoe Option technique while raising their resources from the capital market. (2)In the net of capital market, online trading facilities should be available from all branches of banks and post office in India. (3)SEBI should also come forward to organize seminars, conferences, symposiums in the grass root level for development of investment education in the common people. (4)It is suggested that short-term capital gain from securities traded in stock market should be exempt from tax. (5)Existing FDI limits in different sectors should be hiked and more FDI proposals should be cleared by the Foreign Investment Promotion Board to boost the capital market. References Books: (6,578) 8,629 7,010 (3,394) 3,999 8,892 (22,024) 76,539 76,098 67,911 60,196 @ IJTSRD | Available Online @ www.ijtsrd.com | Volume – 2 | Issue – 3 | Mar-Apr 2018 Page: 392