Download

1 / 4
40 likes | 55 Vues
The three letters NPAu009d strike fright in banking sector and business circle today. NPA is a short form of Non Performing Assetsu009d. In banking, NPA are loans given to doubtful customers who may or may not repay the loan on time. There are two types of assets viz. performing and non performing. Performing loans are standard loans on which both the principle and interest re secured and their return is guaranteed. Non performing assets NPA is result of asset Liability mismatch, A NPA account in the books of accounts is an asset as it indicates the amount receivable from the defaulters. It means if any bank gives loan to the customer if the interest for the loan is not paid by the customer till 90 days then the account is called as NPA account. NPAs reflect the performance of the banks. Mr.Tushar Patil | Prof. Sagar Sutar "Non-Performing Assets: A Study of Shree Warana Co-operative Bank Ltd. Warananagar" Published in International Journal of Trend in Scientific Research and Development (ijtsrd), ISSN: 2456-6470, Special Issue | Fostering Innovation, Integration and Inclusion Through Interdisciplinary Practices in Management , March 2019, URL: https://www.ijtsrd.com/papers/ijtsrd23075.pdf Paper URL: https://www.ijtsrd.com/management/accounting-and-finance/23075/non-performing-assets-a-study-of-shree-warana-co-operative-bank-ltd-warananagar/mrtushar-patil<br>

E N D
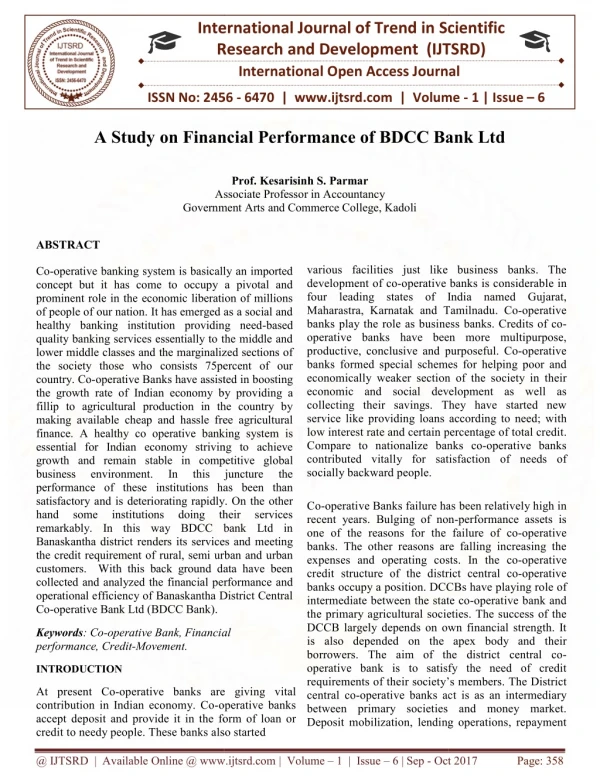
International Journal of Trend in Scientific Research and Development (IJTSRD) Conference Issue | March 2019 Available Online: www.ijtsrd.com e-ISSN: 2456 - 6470 Fostering Innovation, Integration and Inclusion Through Interdisciplinary Practices in Management Non-Performing Assets: A Study of Shree Warana Co-operative Bank Ltd. Warananagar Mr. Tushar Patil1, Prof. Sagar Sutar2 1M.Phil Student, 2Assistant Professor 1chhatrapati Shahu Institute of Business Education and Research, Kolhapur, Maharashtra, India 2Ashokrao Mane Group of Institutions, Vathar Tarf Vadgaon, Maharashtra, India Organised By: Management Department, Chhatrapati Shahu Institute of Business Education and Research, Kolhapur, Maharashtra to doubtful customers who may or may not repay the loan on time. There are two types of assets viz. performing and non- performing. Performing loans are standard loans on which both the principle and interest re secured and their return is guaranteed. Non-performing assets [NPA] is result of asset Liability mismatch, A NPA account in the books of accounts is an asset as it indicates the amount receivable from the defaulters. It means if any bank gives loan to the customer if the interest for the loan is not paid by the customer till 90 days then the account is called as NPA account. NPAs reflect the performance of the banks. KEYWORDS: Non Performing Assets, Causes, assets, liabilities etc. INTRODUCTION A high level of NPA suggest high profitability of large number of credit defaults that affect the profitability and net worth of banks and also erodes the value of the assets. The NPAs growth involves the necessity of the provisions, which reduce the overall profits and shareholders values. The issues of non- performing assets have been discussed length for financial system all over the world the problems of NPAs is not only affecting the banks also the whole economy. The Indian banking has come from a long way from being a sleepy business largely brought about by the large dose of liberalization and economic reform that allowed banks to explore new business opportunities rather than generating from conventional stream (i.e. borrowing and lending). Modern commercial banks perform large number of function and provide service to industries as well as to the consumers. It is not possible to make definite list of the functions of bank. It feels necessary to understand the study regarding management of NPAs well as position of NPAs and the comparative study of NPA position of five branches of Shree Warana Co-operative bank ltd. Warananagar. Objectives of the Study:- 1.To understand the meaning and nature of NPA. 2.To examine the causes for NPAs in bank. 3.To study the NPA position of five branches (2013-14 to 2015-16). 4.To know about assets classification. 5.To provide better suggestion on the basis of NPAs of five branches. Research Methodology:- Research Methodology is the systematic, theoretical analysis of the methods applied to a field of study. For this specific study five branches has been considered these are (Warana, ABSTRACT The three letters “NPA” strike fright in banking sector and business circle today. NPA is a short form of “Non-Performing Assets”. In banking, NPA are loans given How to cite this paper: Mr.Tushar Patil | Prof. Sagar Sutar "Non-Performing Assets: A Study of Shree Warana Co- operative Bank Ltd. Warananagar" Published in International Journal of Trend in Scientific Research and Development (ijtsrd), ISSN: 2456-6470, Special Issue | Fostering Innovation, Integration and Inclusion Through Interdisciplinary Practices in Management, March 2019, pp.101-104, https://www.ijtsrd.com/papers/ijtsrd2 3075.pdf IJTSRD23075 URL: Kodoli, Vadgaon, Kini and Paragon). There are total numbers of NPA account is 274 in the year of the 2015-16. According to that is not possible. Hence 10% of population of total NPAs account has been selected for the study. For these study 27 respondents (NPA’s) has been considered. For the study percentage analysis and statistics tools has been used for the data analysis. Data Collection:- The data collection is consists of two methods. A.Primary Data B.Secondary Data @ IJTSRD | Unique Paper ID - IJTSRD23075 | Conference Issue | FIIITIPM - 2019 | March 2019 Page: 101
International Journal of Trend in Scientific Research and Development (IJTSRD) @ www.ijtsrd.com eISSN: 2456-6470 A.Primary Data:-The primary data were collected from personal interview with bank manager and account executives. B.Secondary Data:-The secondary data were collected through various books, bank statements, annual reports, research journals and bank website. Limitations of the Study:- 1.The study is limited to Shree Warana Co-operative bank ltd. Warananagar.(Warana, Kodoli, Vadgaon, Kini and Paragon) 2.Banks are being overburdened with work so sharing knowledge from bank employee was limited. 3.The study is carried only non- performing assets. 4.Confidential information was not shared Non- Performing Assets An asset, including a leased asset, becomes non-performing when it ceases to generate income for the bank. A ‘non-performing assets’ was defined as accredit facility in respect of which the interest and/ or installment of principle has remained ‘past due’ for a specified period of time. The specified period was reduced in a phased manner as under: w.e.f. 31.03.2001: 180 days w.e.f. 31.03.2004: 90 days 90 days’ delinquency norms are not applicable to agriculture segment. With the effect from March 31, 2004, NPA shall be a loan or an advance where: 1.Term loan: Interest and /or installment of principle remain over due for a period of more than 90 days. 2.Cash credit/overdraft: The account remains ‘out of order’ for a period of more than 90 days. 3.Bills: The bill remains overdue for a period of more than 90 days from due date of payment. 4.Other loans: Any amount to be received remains overdue for a period of more than 90 days. 5.Agricultural accounts: In the case of agriculture advances, where repayment is based on income from crop. An account will be classified as NPA as under: Ifloan has been granted for short duration crop: interest and /or installment of principle remain overdue for two crop seasons beyond the due date. If loan has been granted for long duration crop: interest and /or installment of principle remain overdue foe one crop seasons beyond due date. Data Analysis Table 1.1 Branch wise Loans and Advances provided for the year 2013-14 to 2015-16 Types of NPA Gross NPA: - Gross NPAs are the sum total of all loan assets that are classified as NPAs as per RBI guidelines as on balance sheet date. Gross NPA reflects the quality of the loans made by banks. It consists of all the nonstandard assets like as sub-standard, doubtful, and loss assets. It can be calculated with the help of following ratio: Gross NPAs Ratio = Gross NPAs / Gross Advances Net NPA: - Net NPAs arethose type of NPAs in which the bank has deducted the provision regarding NPAs. Net NPA shows the actual burden of banks. Since in India, bank balance sheets contain a huge amount of NPAs and the process of recovery and write off of loans is very time consuming, the banks have to make certain provisions against the NPAs according to central bank guidelines. It can be calculated by following: Net NPAs = Gross NPAs – Provisions / Gross Advances- Provisions Assets Classification Under the prudential norms of asset classification, banks are now required to classify their advance in the four broad groups. Broadly speaking, classification of assets into four categories would be done taking into account the degree of well-defined credit weakness, risks and the extent of defense on collateral security for realization of dues, As assign if I can’t a welcome derivation from the earlier concepts, the assets classification into four groups is based on age of the NPA advances, which is shown as under: 1.Standard Assets-Standard asset is one which does not disclose any problem and which does not carry more than normal risk attached to the business. Such an asset should not bean NPA. 2.Sub- standard Assets-With effect from 31 March 2005, sub-standard asset would be one, which has remained NPA for a period less than or equal to 12 months. 3.Doubtful Assets-With effect from March 31, 2005, an asset would be classified as doubtful it has remained in the substandard in the substandard category for a period of 12 moths. 4.Loss Assets-A loss asset is one where loss has been identified by the bank of internal or external auditor so the RBI inspection but the amount has been written off wholly. (Rs. In Lacs) Total (%) Loans and advances 2013-14 2014-15 2015-16 2657.40 3433.45 691.25 688.53 922.66 839.09 1732.30 1868.89 866.10 874.50 Total Amount 9569.41 2159.98 2689.45 5527.43 2575.58 (Source- secondary data) % of loans and advances 2013-14 2014-15 2015-16 27.77 35.88 32 31.87 34.31 31.20 31.34 33.81 33.63 33.95 Branch Warana Kodoli Pargon Vadgaon Kini 3478.56 780.20 927.70 1926.24 834.98 36.35 36.13 34.49 34.85 32.42 100 100 100 100 100 The above table no. 1.1 shows the information about loans and advances for the years, 2013-14 to 2015-16 of the all five branches @ IJTSRD | Unique Paper ID - IJTSRD23075 | Conference Issue | FIIITIPM - 2019 | March 2019 Page: 102
International Journal of Trend in Scientific Research and Development (IJTSRD) @ www.ijtsrd.com eISSN: 2456-6470 It is found that the loans and advances are increasing trend of Warananagar & Vadgaon branch. The loans and advances provided by kodoli branch was constant in the year 2013-14 to 2014-2015 and increased in the year 2015-16.The amount of loans and advances are not constant and changing every year of Paragon & kini branch. Table 1.2 Recovery against loans and advances for the year 2013-14 to 2015-16 Recovery 2013-14 2014-15 2015-16 2013-14 2014-15 2015-16 Warana 2575.52 3301.10 3360.63 Kodoli 606.96 619.23 729.67 Pargon 826.71 724.03 836.87 Vadgaon 1658.70 1783.32 1793.61 Kini 840.96 823.67 784.25 (Source- secondary data) The above table no. 1.2 shows the information about recovery against loans and advancesfor the years, 2013-14 to 2015-16 of the all five branches. It is observed that in the year of 2013-14 higher recovery has been done by Kini branch i.e. 97.09% whereas very less recovery has been done by Kodoli branch i.e. 87.80%.It is found that in the year of 2014-15 higher recovery has been done by Warana branch is 96.14%. Whereas very less recovery has been done by Pargon branch i.e. 86.28%. It is found that in the year of 2015- 16 higher recovery has been done by Warana branch is 96.60%. Whereas Pargon and Vadgaon branch has recovered same percentage of amount i.e.93.11%. Table 1.3 Gross NPA of 5 branches for the year 2013-14 to 2015-16 Gross NPA Amount 2013-14 2014-15 2015-16 2013-14 2014-15 2015-16 Warana 81.88 132.25 117.93 Kodoli 84.29 69.30 50.53 Pargon 95.95 115.06 63.83 Vadgaon 73.60 54.57 132.63 Kini 24.14 50.83 50.73 (Source- secondary data) The above table no. 1.3 shows the information about Gross NPA for the years, 2013-14 to 2015-16 of the all five branches. It is found that very less Gross NPA of Kini branch is 2.78%and very high Gross NPA of Kodoli branch i.e. 12.19% in the year of the 2013-14. Gross NPA of Kini and Vadgaon branch are increasing and that is not good for the bank. Gross NPA of Kodoli branch are decreasing. NPA of Warana and Pargon branch is fluctuating. It is observed that very less Gross NPA of Warana branch is 3.85 %and very high Gross NPA of Pargon branch i.e. 13.71% in the year 2014-15. It is analyzed that very less Gross NPA of Warana branch is 3.39 and very high Gross NPA of 6.88 for two branches i.e. Pargon and Vadgaon for the year of 2015- 16. Table 1.4 Causes for Repayment of Loans and Advances Sr. No. Causes 1 Employment termination 2 Diversification of investment 3 Unwanted expenses 4 Other Total The above table no. 1.4 shows causes for repayment of loans and advances. It is observed that maximum respondents are being non-performing assets because of employment termination i.e. 44.44%. Table 1.5 Classification of Assets Warana Kodoli Pargon Vadgaon Standard Assets Standard assets 3360.63 Sub Standard Assets D1 D2 D3 Loss Assets Amount NPA 117.93 Gross NPAs Total Amount 3478.56 (Source- secondary data) The above table no. 1.5 shows assets classification of the five branches. The asset classification of five branches which shoes in sub-standard assets, doubtful 1 doubtful 2 doubtful 3 and loss assets. The above table also shows how branches are having their non-performing assets. Findings 1.It is found that the loans and advances are increasing trend of Warananagar & Vadgaon branch. The loans and (Rs. In Lacs) % of Recovery Branch 96.91 87.80 89.60 95.95 97.09 96.14 89.93 86.28 95.42 94.18 96.60 93.52 93.11 93.11 93.92 % of Gross NPA Branch 3.08 12.19 10.39 4.24 2.78 3.85 10.06 13.71 4.57 5.81 3.39 6.47 6.88 6.88 6.07 No. Respondent 12 04 08 03 27 % 44.44 14.82 29.62 11.12 100 Kini 784.25 19.05 20.17 11.07 0.44 0.00 50.73 834.98 729.67 20.51 9.50 4.57 15.95 0.00 50.53 780.20 863.87 11.44 12.58 26.53 13.28 0.00 63.83 927.70 1793.61 44.38 44.37 13.02 30.86 0.00 132.63 1926.24 40.20 39.76 15.87 22.10 0.00 Nonperforming Assets advances provided by kodoli branch was constant in the year 2013-14 to 2014-2015 and increased in the year 2015-16.The amount of loans and advances are not @ IJTSRD | Unique Paper ID - IJTSRD23075 | Conference Issue | FIIITIPM - 2019 | March 2019 Page: 103
International Journal of Trend in Scientific Research and Development (IJTSRD) @ www.ijtsrd.com eISSN: 2456-6470 constant and changing every year of Paragon & kini branch(Refer table no.1.1) 2.It is observed that in the year of 2013-14 higher recovery has been done by Kini branch i.e. 97.09% whereas very less recovery has been done by Kodoli branch i.e. 87.80%.It is found that in the year of 2014-15 higher recovery has been done by Warana branch is 96.14%. Whereas very less recovery has been done by Pargon branch i.e. 86.28%. It is found that in the year of 2015-16 higher recovery has been done by Warana branch is 96.60%. Whereas Pargon and Vadgaon branch has recovered same percentage of amount i.e.93.11%. (Refer table no.1.2) 3.It is found that very less Gross NPA of Kini branch is 2.78%and very high Gross NPA of Kodoli branch i.e. 12.19% in the year of the 2013-14. Gross NPA of Kini and Vadgaon branch are increasing and that is not good for the bank. Gross NPA of Kodoli branch are decreasing. NPA of Warana and Pargon branch is fluctuating. It is observed that very less Gross NPA of Warana branch is 3.85 %and very high Gross NPA of Pargon branch i.e. 13.71% in the year 2014-15. It is analyzed that very less Gross NPA of Warana branch is 3.39 and very high Gross NPA of 6.88 for two branches i.e. Pargon and Vadgaon for the year of 2015-16. (Refer table no.1.3) 4.It is observed that maximum respondents are being non- performing assets because of employment termination i.e. 44.44%. (Refer table no.1.4) Suggestions The Warana branch must maintain their recovery policy. The Kodoli branch must improve in the recovery of loans and advances. The branch should prepare the portfolio of customers while providing loans. The other branches must be improve in the strategy of recovery. The Kodoli branch must increase loans and advances to the customers. The bank should confirm about employment of customer and then provides loans and advances. The bank should make rating to customers. Conclusion The study is related to the only five branches of Warana bank. The branches are Warana, Kodoli, Vadgaon, Kini and Paragon. The financial position of the Warana branch is good. The study is about non - performing assets of five branches, there are some branches whose loans and advances are increasing and some branches are constant. The recovery of Warana branch is good as per findings in the study. The overall Gross NPA of bank has been increased and that is not good for the bank. References: [1]Books:- Bharati V. Pathak, system,Pearson,2008,Second edition, Page no. 576 Benton E. Gup And James W. Kolari, Commercial Banking: The Management of Risk, Susan Elbe, 2004,Third Edition Chapter no.2 page no. 51-66 The Indian financial [2]Referred reports:- Annual report Financial Year 2013-14 Annual report Financial Year 2014-15 Annual report Financial Year 2015-16 Annual report Financial Year 2016-17 [3]Journals:- International Journal of Innovations in Engineering and Technology (IJIET) International Journal of Marketing, Financial Services & Management Research___ ISSN 2277- 3622 Vol.2, No. 9, September (2013) [4]Website:- http://www.waranabank.com https://rbi.org.in Copyright © 2019 by author(s) and International Journal of Trend in Scientific Research and Development Journal. This is an Open Access article distributed under the terms of the Creative Commons Attribution License (CC BY 4.0) (http://creativecommons.org/licenses/by/4.0) @ IJTSRD | Unique Paper ID - IJTSRD23075 | Conference Issue | FIIITIPM - 2019 | March 2019 Page: 104