Download
1 / 8
80 likes | 100 Vues
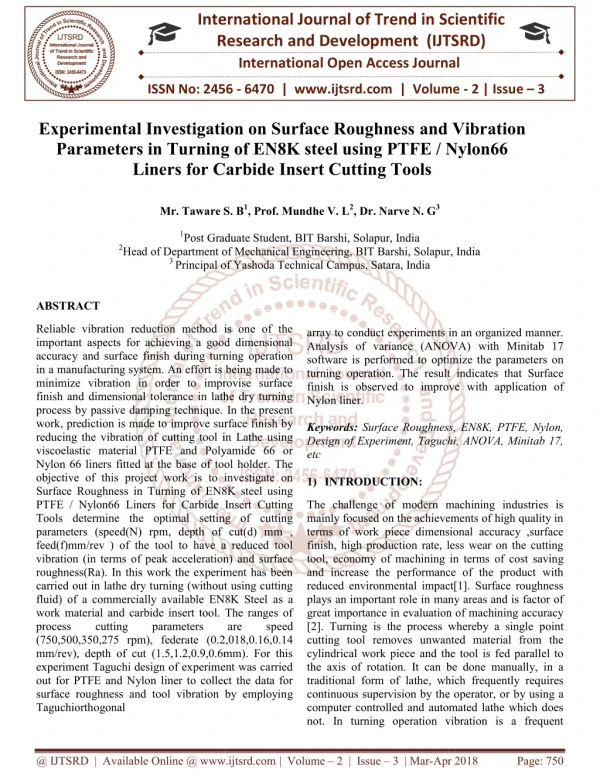
Reliable vibration reduction method is one of the important aspects for achieving a good dimensional accuracy and surface finish during turning operation in a manufacturing system. An effort is being made to minimize vibration in order to improvise surface finish and dimensional tolerance in lathe dry turning process by passive damping technique. In the present work, prediction is made to improve surface finish by reducing the vibration of cutting tool in Lathe using viscoelastic material PTFE and Polyamide 66 or Nylon 66 liners fitted at the base of tool holder. The objective of this project work is to investigate on Surface Roughness in Turning of EN8K steel using PTFE Nylon66 Liners for Carbide Insert Cutting Tools determine the optimal setting of cutting parameters speed N rpm, depth of cut d mm , feed f mm rev of the tool to have a reduced tool vibration in terms of peak acceleration and surface roughness Ra . In this work the experiment has been carried out in lathe dry turning without using cutting fluid of a commercially available EN8K Steel as a work material and carbide insert tool. The ranges of process cutting parameters are speed 750,500,350,275 rpm , federate 0.2,018,0.16,0.14 mm rev , depth of cut 1.5,1.2,0.9,0.6mm . For this experiment Taguchi design of experiment was carried out for PTFE and Nylon liner to collect the data for surface roughness and tool vibration by employing Taguchiorthogonal array to conduct experiments in an organized manner. Analysis of variance ANOVA with Minitab 17 software is performed to optimize the parameters on turning operation. The result indicates that Surface finish is observed to improve with application of Nylon liner. Mr. Taware S. B | Prof. Mundhe V. L | Dr. Narve N. G "Experimental Investigation on Surface Roughness and Vibration Parameters in Turning of EN8K steel using PTFE / Nylon66 Liners for Carbide Insert Cutting Tools" Published in International Journal of Trend in Scientific Research and Development (ijtsrd), ISSN: 2456-6470, Volume-2 | Issue-3 , April 2018, URL: https://www.ijtsrd.com/papers/ijtsrd11080.pdf Paper URL: http://www.ijtsrd.com/engineering/mechanical-engineering/11080/experimental-investigation-on-surface-roughness-and-vibration-parameters-in-turning-of-en8k-steel-using-ptfe--nylon66-liners-for-carbide-insert-cutting-tools/mr-taware-s-b<br>

E N D
International Research Research and Development (IJTSRD) International Open Access Journal International Journal of Trend in Scientific Scientific (IJTSRD) International Open Access Journal ISSN No: 2456 ISSN No: 2456 - 6470 | www.ijtsrd.com | Volume 6470 | www.ijtsrd.com | Volume - 2 | Issue – 3 Experimental Investigation on Surface Roughness Parameters in Turning of EN8K steel using PTFE / Nylon66 Liners for Carbide Insert Cutting Tools Liners for Carbide Insert Cutting Tools Experimental Investigation on Surface Roughness and Vibration in Turning of EN8K steel using PTFE / Nylon66 in Turning of EN8K steel using PTFE / Nylon66 and Vibration Mr. Taware S. B Taware S. B1, Prof. Mundhe V. L2, Dr. Narve N. G3 Post Graduate Student, BIT Barshi, Solapur, India Head of Department of Mechanical Engineering, BIT Barshi, Solapur, India Principal of Yashoda Technical Campus, Satara, India 1Post Graduate Student, BIT Barshi, Solapur, India 2Head of Department of Mechanical Engineering, BIT Barshi, Solapur, India 3 Principal of Head of Department of Mechanical Engineering, BIT Barshi, Solapur, India array to conduct experiments in an organized manner. Analysis of variance (ANOVA) with Minitab 17 software is performed to optimize the parameters on turning operation. The result indicates that Surface finish is observed to improve Nylon liner. Keywords: Surface Roughness, EN8K, PTFE, Nylon, Design of Experiment, Taguchi, ANOVA, Minitab 17, etc 1)INTRODUCTION: ABSTRACT Reliable vibration reduction method is one of the important aspects for achieving a good dimensional accuracy and surface finish during turning in a manufacturing system. An effort is being made to minimize vibration in order to improvise surface finish and dimensional tolerance in lathe dry turning process by passive damping technique. In the present work, prediction is made to improve surface finish by reducing the vibration of cutting tool in Lathe using viscoelastic material PTFE and Polyamide 66 or Nylon 66 liners fitted at the base of tool holder. The objective of this project work is to investigate on Surface Roughness in Turning of EN8K steel using PTFE / Nylon66 Liners for Carbide Insert Cutting Tools determine the optimal setting of cutting parameters (speed(N) rpm, depth of cut(d) mm , feed(f)mm/rev ) of the tool to have a reduced tool vibration (in terms of peak acceleration) a roughness(Ra). In this work the experiment has been carried out in lathe dry turning (without using cutting fluid) of a commercially available EN8K Steel work material and carbide insert tool. The ranges of process cutting parameters (750,500,350,275 rpm), federate (0.2,018,0.16,0.14 mm/rev), depth of cut (1.5,1.2,0.9,0.6mm). For this experiment Taguchi design of experiment was carried out for PTFE and Nylon liner to collect the data for surface roughness and tool vibration by employin Taguchiorthogonal Reliable vibration reduction method is one of the important aspects for achieving a good dimensional accuracy and surface finish during turning operation in a manufacturing system. An effort is being made to minimize vibration in order to improvise surface finish and dimensional tolerance in lathe dry turning process by passive damping technique. In the present array to conduct experiments in an organized manner. Analysis of variance (ANOVA) with Minitab 17 performed to optimize the parameters on result indicates that Surface finish is observed to improve with application of surface finish by Surface Roughness, EN8K, PTFE, Nylon, Design of Experiment, Taguchi, ANOVA, Minitab 17, reducing the vibration of cutting tool in Lathe using viscoelastic material PTFE and Polyamide 66 or Nylon 66 liners fitted at the base of tool holder. The objective of this project work is to investigate on f EN8K steel using PTFE / Nylon66 Liners for Carbide Insert Cutting Tools determine the optimal setting of cutting parameters (speed(N) rpm, depth of cut(d) mm , feed(f)mm/rev ) of the tool to have a reduced tool vibration (in terms of peak acceleration) and surface roughness(Ra). In this work the experiment has been carried out in lathe dry turning (without using cutting fluid) of a commercially available EN8K Steel as a work material and carbide insert tool. The ranges of cutting parameters The challenge of modern machining industries is mainly focused on the achievements of high quality in terms of work piece dimensional accuracy ,surface finish, high production rate, less wear on the cutting tool, economy of machining in terms of cost savin and increase the performance of the product with reduced environmental impact[1]. Surface roughness plays an important role in many areas and is factor of great importance in evaluation of machining accuracy [2]. Turning is the process whereby a single p cutting tool removes unwanted material from the cylindrical work piece and the tool is fed parallel to the axis of rotation. It can be done manually, in a traditional form of lathe, which frequently requires continuous supervision by the operator, or computer controlled and automated lathe which does not. In turning operation vibration is a frequent not. In turning operation vibration is a frequent The challenge of modern machining industries is mainly focused on the achievements of high quality in terms of work piece dimensional accuracy ,surface finish, high production rate, less wear on the cutting tool, economy of machining in terms of cost saving and increase the performance of the product with reduced environmental impact[1]. Surface roughness plays an important role in many areas and is factor of great importance in evaluation of machining accuracy [2]. Turning is the process whereby a single point cutting tool removes unwanted material from the cylindrical work piece and the tool is fed parallel to the axis of rotation. It can be done manually, in a traditional form of lathe, which frequently requires continuous supervision by the operator, or by using a computer controlled and automated lathe which does are are sp speed (0.2,018,0.16,0.14 mm/rev), depth of cut (1.5,1.2,0.9,0.6mm). For this experiment Taguchi design of experiment was carried out for PTFE and Nylon liner to collect the data for surface roughness and tool vibration by employing @ IJTSRD | Available Online @ www.ijtsrd.com Online @ www.ijtsrd.com | Volume – 2 | Issue – 3 | Mar-Apr 2018 Apr 2018 Page: 750
International Journal of Trend in Scientific Research and Development (IJTSRD) ISSN: 2456-6470 problem .Vibration in machine tool is directly affecting the surface finish of the work material in turning process. So vibration of a machine tool is one of the major factors limiting its performance. The vibration occurring in the machine tool is due to the dynamic nature of force acting during the turning operation on the cutting tool [3]. Vibration can be measured in terms of peak acceleration, r.m.s value of velocity, peak to peak displacement. displacement (δ), velocity (Ve), acceleration (a) are other measured parameters measured using a Vibrometer. In the present study attempt has been made to investigate the effect of Turning of EN8K steel on surface roughness and Vibration Parameters through generating experimental data by performing turning test on EN8k steel material using PTFE / Nylon 66 Liners for Carbide Insert Cutting Tools by variation of suitable machining parameters namely Speed, feed and depth of cut. 3)Need of Optimization the Process: It is much more important to limit vibrations of the machine tool structure because 1. vibrations in machine tool results in poor surface finish, cutting edge damage, and irritating noise. 2. It also set up frequent stress cycles with resonance to occur. 3. It also causes fatigue failure. The present study thus aims at the vibration reduction of the tool by suitable altering the packing materials as liners below the tool Speed, feed, depth of cutting are used as input parameters and dimensional accuracy, surface finish are used as measured output parameters. The Vibration displacement (δ), velocity (Ve), acceleration are other measured parameters measured using a vibrometer The experimental data will be generated by performing turning test on EN8k material by variation of suitable machining parameters namely Speed, feed, depth of cut. 0 4)Problem Statement: The average surface roughness is given by [5] Ra = Where Ra is the arithmetic average deviation from mean line, L is the sampling length and Y the coordinate of the profile curve. Machining vibration accompanies every cutting process. Being influenced by many sources, such as machine structure, tool type, work material, etc., the composition of the machining vibration is complex. However, at least two types of vibrations, forced vibration and self-excited vibration, were identified as machining vibrations [1], [2]. In turning operation, tool vibration is a common problem and it affects the performance of a machine, tool life and surface finish of the work material. The standard procedure adopted to avoid vibration during machining is by careful planning of the cutting parameters and damping of cutting tool. There have been many investigations on vibration prediction and control in turning. 2)Relevance of Project : …………. (1) parameters like The dynamic motion between work piece and cutting tool during turning operation produce vibrations which result in unacceptable surface finish and dimensional errors. The present work is to investigate the passive vibration damping method of using PTFE and Nylon 66 packing liners for carbide insert cutting tool during turning operation. 5)Project Objective: Reliable vibration reduction method is one of the important aspects for achieving a good dimensional accuracy and surface finish during turning operation in an manufacturing system. The surface quality is influenced by cutting speed, feed rate and depth of cut and many other parameters. Speed, feed and depth of cut are used as input parameters and dimensional accuracy, surface finishes are used as measured output parameters. The Vibration The objective is to investigate the effect of Turning of EN8K steel using PTFE / Nylon 66 Liners for Carbide Insert Cutting Toolson surface roughness and Vibration Parameters. The experimental data will be generated by performing turning tests on EN8k material by variation of suitable machining parameters namely Speed, feed, depth of cut and measurement of process parameters like @ IJTSRD | Available Online @ www.ijtsrd.com | Volume – 2 | Issue – 3 | Mar-Apr 2018 Page: 751
International Journal of Trend in Scientific Research and Development (IJTSRD) ISSN: 2456-6470 output parameters and vibration parameters withPTFE and Nylon 66 respectively packing liners for Carbide Insert Cutting Tool. 6)EXPERIMENTAL SETUP: b. Work Piece Material: a. EN8K: Unalloyed medium carbon Steel (BS 970 080m40) has high strength levels compared to normal bright Mild Steel, due to thermo mechanical rolling. EN8K is suitable for all round engineering purposes that may require a Steel of greater strength. Table No: 1 Experimental Condition Work Piece Material EN8K Steel 100 mm 50 mm Length of the Work Piece Dia. of the Work Piece c. Table No: 2 Chemical Composition of EN8 Steel Fig.3 a.b.c. Tool Holder without Recess & with Recess Std Grade C Mn Si P S BS 970 EN8/ 080M40 Min 0.35 0.60 0.05 0.015 0.015 Max 0.45 1.00 0.35 0.06 0.6 Table No: 3 Physical Properties of EN 8 Steel b. a. Maximum stress Yield stress Elongation Proof Stress(0.2%) Density 850 N/mm2 Fig.4.a.b. Tool Holder with PTFE Liner fitted 465 N/mm2 16% 450 N/mm2 7.87gm/cm3 a. b. Tool Holder: Fig.5.a.b. Tool Holder with Nylon Liner fitted Machine Tool Used: Fig.2. Tool Holder Fig-6: Centre Lathe @ IJTSRD | Available Online @ www.ijtsrd.com | Volume – 2 | Issue – 3 | Mar-Apr 2018 Page: 752
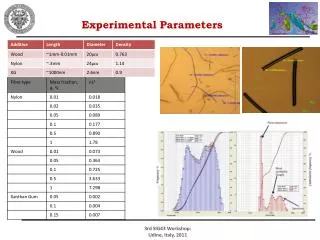
International Journal of Trend in Scientific Research and Development (IJTSRD) ISSN: 2456-6470 qualitative understanding of how these data are to be analysed. [2]. the present experiments were designed on the basis of these guidelines. The step-by-step procedure which was used in designing these experiments is outlined below: Testing Equipment: a.Portable Roughness Tester Surftest SJ-210 b.Digital Tachometer 1.Define problem statement The objective of the experiments is to determine the influence of various process parameters and their interactions on the response in using PTFE and Nylon 66 packing liners for carbide insert cutting tool during turning operation by developing mathematical models. 2.Selection of response variables In selecting the response variables, it should be ensured that these variables information about the process performance under study. Following measures of performance (response variables) were chosen Surface Roughness (Ra) Dimensional Tolerance (Tw) 3.Selection of process variables Trial experiments were conducted for selection of input parameter with carbide insert cutting tool with a tool holder on local work material. Based on the trial experiments conducted, the following process variables are selected for further experimentation a. provide useful c. b. Fig.7 Equipment and instruments used during experiments PLANNING OF EXPERIMENTS Design of Experiments To use the statistical approach in designing and analyzing an experiment, it is necessary to have a clear idea in advance of exactly what is to be studied, how the data are to be collected, and at least a Table 4 Process variables and their levels Unit Level-1 Parameter Level-2 Level-3 Level-4 SPEED rpm 750 500 350 275 FEED mm/rev 0.2 0.18 0.16 0.14 DOC mm 1.5 1.2 0.9 0.6 7)EXPERIMENTAL RESULTS OF PTFE Table 5 Results of experiment with PTFE Std. order 1 2 3 4 5 Speed rpm 750 750 750 750 500 Feed mm/rev DoC mm 1.5 1.2 0.9 0.6 1.2 Ra µm 1.2825 1.03645 0.83505 0.75335 1.19035 Rt µm Rz µm 9.234 7.46244 6.01236 5.42412 8.57052 0.2 0.18 0.16 0.14 0.2 11.15775 9.017115 7.264935 6.554145 10.35605 @ IJTSRD | Available Online @ www.ijtsrd.com | Volume – 2 | Issue – 3 | Mar-Apr 2018 Page: 753
International Journal of Trend in Scientific Research and Development (IJTSRD) ISSN: 2456-6470 6 7 8 9 10 11 12 13 14 15 16 500 500 500 350 350 350 350 275 275 275 275 0.18 0.16 0.14 0.2 0.18 0.16 0.14 0.2 0.18 0.16 0.14 1.5 0.6 0.9 0.9 0.6 1.5 1.2 0.6 0.9 1.2 1.5 1.0849 1.05355 0.9234 1.33665 1.2274 1.254 0.76475 2.1736 1.13905 0.8417 1.026 9.43863 9.165885 8.03358 11.62886 10.67838 10.9098 6.653325 18.91032 9.909735 7.32279 8.9262 7.81128 7.58556 6.64848 9.62388 8.83728 9.0288 5.5062 15.64992 8.20116 6.06024 7.3872 Result Analysis and Discussions The turning experiments were conducted by using the parametric approach of Taguchi’s method. Using Taguchi approach, only main effect of individual parameters havebeen evaluated. The effects of individual turning process parameters, on the machining characteristics namely surface roughness (Ra) and Tolerance (Tw) have been discussed in this section. Experimental data have been converted into signal to noise (S/N) ratio as suggested by Taguchi method. Ra and Tw characteristics are analysed using “lower the Residual Plots for SNRA1 Normal Probability Plot Versus Fits 99 1 90 Residual 0 Percent 50 -1 10 -2 1 -2 -1 0 1 2 -6 -4 -2 0 2 Residual Fitted Value Histogram Versus Order 6.0 1 4.5 Frequency Residual 0 3.0 -1 1.5 -2 0.0 -1.5 -1.0 -0.5 Residual 0.0 0.5 1.0 1 2 3 4 5 6 7 8 9 10 11 12 13 14 15 16 Observation Order better” type.In order to evaluate the feasibility and sufficiency of the present experimental results, analysis of variance (ANOVA) has been performed by using, a statistical software, MINITAB 17. Using ANOVA, the percentage contribution of various process parameters can information about how significant the effect of each process parameter on performance characteristics of interest can be obtained. Fig 9 Residual plots for S/N ratios of Ra It can be seen from Figure 8 and 9 that the residuals follow an approximately straight line in normal probability plot and approximate symmetric nature of histogram indicates that the residuals are normally distributed. Residuals possess constant variance as they are scattered randomly around zero in residuals versus the fitted values. Since residuals exhibit no clear pattern, there is no error due to time or data collection be estimated. Thus, Effect Of Process Parameters On Surface Roughness (Ra) order. Residual Plots for MEAN1 Main Effects Plot for Means Data Means Normal Probability Plot Versus Fits 99 Speed Feed DOC 0.3 90 0.2 1.5 Residual Percent 0.1 50 1.4 0.0 10 -0.1 1.3 Mean of Means 1 -0.4 -0.2 0.0 0.2 0.4 1.0 1.5 2.0 Residual Fitted Value 1.2 Histogram Versus Order 1.1 4.8 0.3 0.2 3.6 1.0 Frequency Residual 0.1 2.4 0.0 0.9 1.2 -0.1 0.8 0.0 -0.1 0.0 0.1 0.2 0.3 1 2 3 4 5 6 7 8 9 10 11 12 13 14 15 16 275 350 500 750 0.14 0.16 0.18 0.20 0.6 0.9 1.2 1.5 Residual Observation Order Fig 8 Residual plots for mean Ra Fig 10 Response Main effects plot of Means of Ra @ IJTSRD | Available Online @ www.ijtsrd.com | Volume – 2 | Issue – 3 | Mar-Apr 2018 Page: 754
International Journal of Trend in Scientific Research and Development (IJTSRD) ISSN: 2456-6470 ANOVA OF S/N RATIOS Main Effects Plot for SN ratios Data Means Analysis of Variance Speed Feed DOC 1 Source DF Adj SS Adj MS F-value P-value Mean of SN ratios 0 SPEED 3 8.836 2.945 1.47 0.315 -1 FEED 3 45.214 15.071 7.50 0.019 -2 DOC 3 10.983 3.661 1.82 0.243 -3 Error 6 12.055 2.009 275 350 500 750 0.14 0.16 0.18 0.20 0.6 0.9 1.2 1.5 Signal-to-noise: Smaller is better Total 15 77.089 Fig 11 Response Main effects plot of SN ratios of Ra Table 7: Anova of S/N ratios of Ra Selection of Optimum Level of Parameters It is clear from the responses above that the Surface finish improves with increase in speed indicated by the trend in graph where as the increase in feed results in poor surface finish, the change in DOC gives an ambiguous result. The least variation and the optimal design are obtained by means of the S/N ratio. Higher the S/N ratio, more stable the achievable quality (Tosun et al., 2004). Figure 11,shows the S/N ratio plots for Ra. It is clear from Figure 11, highest S/N ratio First level of Speed (750 rpm), Fourth level of Feed (0.14 mm/rev), second level of DOC (1.2mm) Therefore, the optimal setting of process parameters which yield maximum surface finish is A1B4C2. ANALYSIS OF VARIANCE: ANOVA OF MEAN Analysis of Variance Source DF Adj SS Adj MS F-value P-value SPEED 3 0.2202 0.07341 1.31 0.354 FEED 3 0.8826 0.29419 5.26 0.041 DOC 3 0.2591 0.08638 1.54 0.297 Error 6 0.3357 0.05595 Total 15 1.6976 Table 6: Anova of Means Of Ra 8)EXPERIMENTAL RESULTS FOR NYLON Table 8Results of experiment with Nylon Std. order Speed rpm Feed mm/rev DoC mm Ra µm Rt µm Rz µm 1 2 3 4 5 6 7 8 9 10 11 750 750 750 750 500 500 500 500 350 350 350 0.2 0.18 0.16 0.14 0.2 0.18 0.16 0.14 0.2 0.18 0.16 1.5 1.2 0.9 0.6 1.2 1.5 0.6 0.9 0.9 0.6 1.5 0.457938 0.434235 0.316669 0.29107 0.438975 0.387777 0.379244 0.369763 0.402947 0.393466 0.434235 3.984058 3.777844 2.755021 2.53231 3.819086 3.373664 3.299427 3.216941 3.505641 3.423155 3.777844 3.297151 3.126491 2.280018 2.095705 3.160623 2.791998 2.73056 2.662296 2.90122 2.832956 3.126491 @ IJTSRD | Available Online @ www.ijtsrd.com | Volume – 2 | Issue – 3 | Mar-Apr 2018 Page: 755
International Journal of Trend in Scientific Research and Development (IJTSRD) ISSN: 2456-6470 12 13 14 15 16 350 275 275 275 275 0.14 0.2 0.18 0.16 0.14 1.2 0.6 0.9 1.2 1.5 0.375452 0.449405 0.440872 0.432339 0.42665 3.266432 3.909821 3.835584 3.761346 3.711855 2.703254 3.235714 3.174276 3.112838 3.07188 Result Analysis and Discussions Effect Roughness (Ra) of Process Parameters On Surface Residual Plots for MEAN1 Main Effects Plot for Means Data Means Normal Probability Plot Versus Fits 99 0.04 Speed Feed DOC 90 0.02 0.44 Residual Percent 0.00 50 0.43 -0.02 10 0.42 -0.04 1 Mean of Means -0.050 -0.025 0.000 Residual 0.025 0.050 0.30 0.35 0.40 0.45 0.41 Fitted Value 0.40 Histogram Versus Order 0.04 4 0.39 0.02 3 Frequency 0.38 Residual 0.00 2 0.37 -0.02 1 -0.04 0.36 0 -0.04 -0.03 -0.02 -0.01 Residual 0.00 0.01 0.02 0.03 1 2 3 4 5 6 7 8 9 10 11 12 13 14 15 16 275 350 500 750 0.14 0.16 0.18 0.20 0.6 0.9 1.2 1.5 Observation Order Fig 14 Response Main effects plot of Means of Ra Fig 12 Residual plots for mean Ra Residual Plots for SNRA1 Main Effects Plot for SN ratios Data Means Normal Probability Plot Versus Fits 99 Speed Feed DOC 1.0 9.0 90 0.5 Residual Percent 50 0.0 8.5 Mean of SN ratios 10 -0.5 1 -1.0 -0.5 0.0 0.5 1.0 7 8 9 10 Residual Fitted Value 8.0 Histogram Versus Order 1.0 3 7.5 0.5 Frequency Residual 2 0.0 1 7.0 -0.5 275 350 500 750 0.14 0.16 0.18 0.20 0.6 0.9 1.2 1.5 0 -0.8 -0.4 0.0 Residual 0.4 0.8 1 2 3 4 5 6 7 8 9 10 11 12 13 14 15 16 Signal-to-noise: Smaller is better Observation Order Fig 15 Response Main effects plot of SN ratios of Ra Fig 13 Residual plots for S/N ratios of Ra It can be seen from Figure 12 and 13 that the residuals follow an approximately straight line in normal probability plot and approximate symmetric nature of histogram indicates that the residuals are normally distributed. Residuals possess constant variance as they are scattered randomly around zero in residuals versus the fitted values. Since residuals exhibit no clear pattern, there is no error due to time or data collection order. It is clear from the responses above that the Surface finish improves with increase in speed indicated by the trend in graph where as the increase in feed results in poor surface finish, the change in DOC gives an ambiguous result. @ IJTSRD | Available Online @ www.ijtsrd.com | Volume – 2 | Issue – 3 | Mar-Apr 2018 Page: 756
International Journal of Trend in Scientific Research and Development (IJTSRD) ISSN: 2456-6470 4.The optimal level of parameters are as follows for Nylon First level of Speed (750 rpm), Fourth level of Feed (0.14 mm/rev), Fourth level of DOC (0.6 mm). ANALYSIS OF VARIANCE: ANOVA OF MEAN Analysis of Variance Source DF Adj SS Adj MS F- value P- value 5.The Nylon shows better overall results and it is recommended for use. SPEED 3 0.008170 0.002723 2.35 0.171 6.Speed of 750 rpm and 500 rpm are found to be effective and optimal for best results of Surface finish. FEED 3 0.011352 0.003784 3.27 0.101 DOC 3 0.007521 0.002507 2.17 0.193 REFERENCES: Error 6 0.006941 0.001157 1.Amitabh “Manufacturing Science”, East-West Press, Pvt. Ltd., New Delhi, 1993 Ghosh and Ashok Malik, Total 15 0.03398 Table 9 Anova of Means of Ra 2.D.C. Montgomery, “Design and Analysis of Experiments”, Fifth Edition, John Wiley and Sons, 1997 ANOVA OF S/N RATIOS Analysis of Variance Source DF Adj SS Adj MS F-value P- 3.D.D.L. Chung, Review-Materials for Vibration Damping, Journal of Material Science 36, Kluwer Academic Publisher., 2001. value SPEED 3 4.583 1.5276 2.40 0.167 4.Wenhai Fu, D.D.L. Chung, “Vibration Reduction Ability of Polymers, Polymethylmethacrylate Polytetrafluoroethylene”, Polymers & Polymer Composites, Vol. 9, No. 6, 2001. FEED 3 5.911 1.9703 3.09 0.111 Particularly DOC 3 4.057 1.3524 2.12 0.199 and Error 6 3.821 0.6369 Table 10 Anova of S/N ratios of Ra 5.Dr. investigation of tool condition monitoring” International Journal of Engineering Science and Technology (IJEST) Vol. 4, Aug 2012 PrateshJayaswal, Nidhi Gupta“ An Selection of Optimum Level of Parameters The least variation and the optimal design are obtained by means of the S/N ratio. Higher the S/N ratio, more stable the achievable quality (Tosun et al., 2004). Figure 15,shows the S/N ratio plots for Ra. It is clear from Figure 15, highest S/N ratio First level of SPEED (750 rpm), Fourth level of FEED (0.14 mm/rev), Fourth level of DOC (0.6 mm) Therefore, the optimal setting of process parameters which yield maximum surface finish is A1B4C4 6.K.G.Nikam, S.S. Kadam, “Optimization of Surface Roughness of EN8 Steel by Changing Cutting parameters and Insert Geometry in Turning Process”, International Journal of Science and Research, Volume 3 Issue 11, Nov 2014. 7.S. S. Abuthakeer, P. V. Mohanram, G. Mohankumar, “Prediction and Control of Cutting Tool Vibration in Cnc Lathe with Anova and Ann”, International Journal of Lean Thinking, Volume 2, Issue 1,June 2011. CONCLUSIONS 1.Design of Experiment using Taguchi method was done to optimize the parameters for best surface finish 8.K. Adarsh Kumar, Ch. Ratnam, BSN Murthy, B. Satish Ben, K. Raghu Ram Mohan Reddy, “Optimization of surface roughness in face turning operation in machining of En-8”, International Journal of Engineering Science & Advanced Technology, Volume-2, Issue-4, Aug 2012 2.The Surface finish is observed to improve with application of Nylon liner. 3.The optimal level of parameters are as follows for PTFE to obtain optimal surface finish First level of Speed (750 rpm), Fourth level of Feed (0.14 mm/rev), Second level of DOC (1.2mm). @ IJTSRD | Available Online @ www.ijtsrd.com | Volume – 2 | Issue – 3 | Mar-Apr 2018 Page: 757