Download
1 / 8
80 likes | 101 Vues
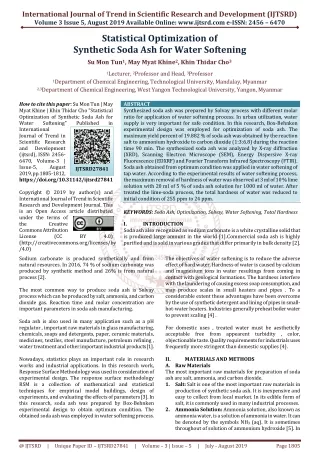
Synthesized soda ash was prepared by Solvay process with different molar ratio for application of water softening process. In urban utilization, water supply is very important for safe condition. In this research, Box Behnken experimental design was employed for optimization of soda ash. The maximum yield percent of 19.882 of soda ash was obtained by the reaction salt to ammonium hydroxide to carbon dioxide 1 3 6.8 during the reaction time 90 min. The synthesized soda ash was analyzed by X ray diffraction XRD , Scanning Electron Microscope SEM , Energy Dispersive X ray Fluorescence EDXRF and Fourier Transform Infrared Spectroscopy FTIR . Soda ash obtained from optimum condition was applied in water softening of tap water. According to the experimental results of water softening process, the maximum removal of hardness of water was observed at 3 ml of 10 lime solution with 20 ml of 5 of soda ash solution for 1000 ml of water. After treated the lime soda process, the total hardness of water was reduced to initial condition of 255 ppm to 24 ppm. Su Mon Tun | May Myat Khine | Khin Thidar Cho "Statistical Optimization of Synthetic Soda Ash for Water Softening" Published in International Journal of Trend in Scientific Research and Development (ijtsrd), ISSN: 2456-6470, Volume-3 | Issue-5 , August 2019, URL: https://www.ijtsrd.com/papers/ijtsrd27841.pdf Paper URL: https://www.ijtsrd.com/engineering/chemical-engineering/27841/statistical-optimization-of-synthetic-soda-ash-for-water-softening/su-mon-tun<br>

E N D
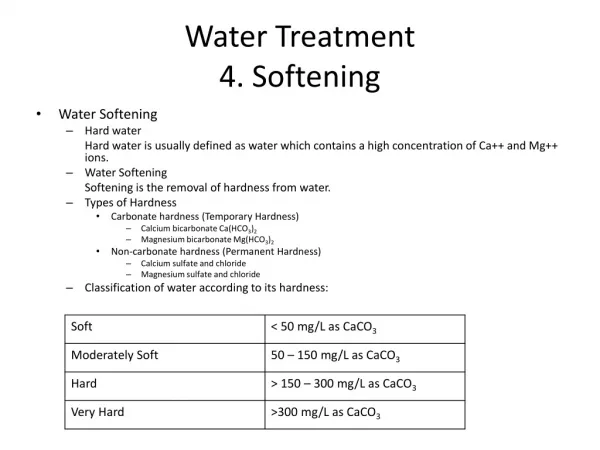
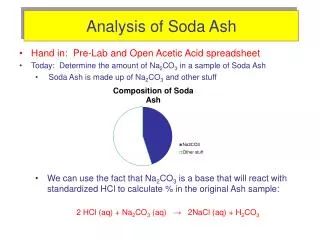
International Journal of Trend in Scientific Research and Development (IJTSRD) Volume 3 Issue 5, August 2019 Available Online: www.ijtsrd.com e-ISSN: 2456 – 6470 Statistical Optimization of Synthetic Soda Ash for Water Softening Su Mon Tun1, May Myat Khine2, Khin Thidar Cho3 1Lecturer, 2Professor and Head, 3Professor 1Department of Chemical Engineering, Technological University, Mandalay, Myanmar 2,3Department of Chemical Engineering, West Yangon Technological University, Yangon, Myanmar How to cite this paper: Su Mon Tun | May Myat Khine | Khin Thidar Cho "Statistical Optimization of Synthetic Soda Ash for Water Softening" International Journal of Trend in Scientific Research and Development (ijtsrd), ISSN: 2456- 6470, Volume-3 | Issue-5, August 2019, pp.1805-1812, https://doi.org/10.31142/ijtsrd27841 Copyright © 2019 by author(s) and International Journal of Trend in Scientific Research and Development Journal. This is an Open Access article distributed under the terms of the Creative Commons Attribution License (CC (http://creativecommons.org/licenses/by /4.0) Sodium carbonate is produced synthetically and from natural resources. In 2016, 74 % of sodium carbonate was produced by synthetic method and 26% is from natural process [2]. The most common way to produce soda ash is Solvay process which can be produced by salt, ammonia, and carbon dioxide gas. Reaction time and molar concentration are important parameters in soda ash manufacturing. Soda ash is also used in many application such as a pH regulator , important raw materials in glass manufacturing, chemicals, soaps and detergents, paper, ceramic materials, medicines, textiles, steel manufacture, petroleum refining , water treatment and other important industrial products[1]. Nowadays, statistics plays an important role in research works and industrial applications. In this research work, Response Surface Methodology was used in consideration of experimental design. The response surface methodology RSM is a collection of mathematical and statistical techniques for empirical model buildings, design of experiments, and evaluating the effects of parameters [3]. In this research, soda ash was prepared by Box-Behnken experimental design to obtain optimum condition. The obtained soda ash was employed in water softening process. ABSTRACT Synthesized soda ash was prepared by Solvay process with different molar ratio for application of water softening process. In urban utilization, water supply is very important for safe condition. In this research, Box-Behnken experimental design was employed for optimization of soda ash. The maximum yield percent of 19.882 % of soda ash was obtained by the reaction salt to ammonium hydroxide to carbon dioxide (1:3:6.8) during the reaction time 90 min. The synthesized soda ash was analyzed by X-ray diffraction (XRD), Scanning Electron Microscope (SEM), Energy Dispersive X-ray Fluorescence (EDXRF) and Fourier Transform Infrared Spectroscopy (FTIR). Soda ash obtained from optimum condition was applied in water softening of tap water. According to the experimental results of water softening process, the maximum removal of hardness of water was observed at 3 ml of 10 % lime solution with 20 ml of 5 % of soda ash solution for 1000 ml of water. After treated the lime-soda process, the total hardness of water was reduced to initial condition of 255 ppm to 24 ppm. KEYWORDS: Soda Ash, Optimization, Solvay, Water Softening, Total Hardness I. INTRODUCTION Soda ash also recognized as sodium carbonate is a white crystalline solid that is produced large amount in the world [1].Commercial soda ash is highly purified and is sold in various grades that differ primarily in bulk density [2]. Published in IJTSRD27841 BY 4.0) The objectives of water softening is to reduce the adverse effect of hard water. Hardness of water is caused by calcium and magnesium ions in water resultings from coming in contact with geological formations. The hardness interfere with the laundering of causing excess soap consumption, and may produce scales in small heaters and pipes . To a considerable extent these advantages have been overcome by the use of synthetic detergent and lining of pipes in small- hot-water heaters. Industries generally preheat boiler water to prevent scaling [4] . For domestic uses , treated water must be aestheticlly acceptable free from appearent turbidity , color, objectionable taste. Quality requirements for industrials uses frequently more stringent than domestic supplies [4]. II. MATERIALS AND METHODS A.Raw Materials The most important raw materials for preparation of soda ash are salt, ammonia, and carbon dioxide. 1.Salt:Salt is one of the most important raw materials in production of synthetic soda ash. It is inexpensive and easy to collect from local market. In its edible form of salt, it is commonly used in many industrial processes. 2.Ammonia Solution:Ammonia solution, also known as ammonia water, is a solution of ammonia in water. It can be denoted by the symbols NH3 (aq). It is sometimes throughout of solution of ammonium hydroxide [5]. In @ IJTSRD | Unique Paper ID – IJTSRD27841 | Volume – 3 | Issue – 5 | July - August 2019 Page 1805
International Journal of Trend in Scientific Research and Development (IJTSRD) @ www.ijtsrd.com eISSN: 2456-6470 this research, 25% of ammonia solution was used as raw material in soda ash preparation. It can be purchased from local market. 3.Carbon Dioxide:Carbon dioxide is a colorless gas with a density about 60% higher than that of dry air. Carbon dioxide consists of carbon atom covalently doubled bonded to one oxygen atoms [6]. In this research, it was used as a raw material in preparation of soda ash. B.Preparation of Raw Salt Salt analysis was carried out to determine the specification of salt before purification. The raw salt composition was shown in Table. I and analyzed by EDTA titration method [7], Complex metric titration method [8] and AOAC method [9]. TABLEI.COMPOSITION OF RAWSALTSOLUTION Specification ppm Total Hardness 448 Total Alkalinity 90 Complexometric Titration Calcium 4 Magnesium 23.04 According to the analytical results, salt purification process was carried out by sedimentation process. The (300) gm of raw salt was mixed with (1000) ml of water. And then, it was stirred until the salt was completely dissolved. After that, it was settled to separate the clear solution and sediment. When the insoluble particles were settled, the clear solution was passed through the filter to remove the impurities. Finally, the filtrate was evaporated to 100 ံC, to obtain the According to this experimental procedure, the preliminary experiments were conducted at molar ratio of 1:1:1,1:3:3 and 1:6:6 of salt to ammonium hydroxide to carbon dioxide gas. The experimental procedure for preparation of soda ash was shown in Figure .1. Methods EDTA Titration AOAC AOAC clean salt. C.Preparation of Synthetic Soda Ash by Solvay process The sodium chloride (25) gm was weighed and mixed with the 25 %( w/w) of ammonia solution. And then; the mixture was stirred for a few minutes until all sodium chloride was completely dissolved. After that, when the carbon dioxide gas was passed through the solution and the reaction time was noted. The carbonation reaction was shown in equation 1[10]. NaCl + NH4 OH + CO2 NaHCO3 + NH4Cl The reaction was proceeded until the significant amount of precipitates were started to form round about 1 hr. After 15 minutes, the precipitate of sodium bicarbonate was formed. And then, 15 minutes period was over, the reactor was put into the ice bath and cooled for 1 hr. The cooled precipitated sodium bicarbonate was decanted into the conical flask by passing the clean funnel with whatman filter paper. And then precipitates were washed with cooled distilled water to remove unreacted salt and ammonium chloride. And then, it was calcined in muffle furnace at a temperature about 200ံC, carbon dioxide and Figure.1. Preparation of Synthesized Soda Ash III. According to the preliminary experiments, the yield percent of soda ash was described in Table (II). Moreover, statistical designs were considered to provide the optimization of soda ash. TABLEII.YIELD% OF SODAASHFROMPRELIMINARY EXPERIMENTS Molar Ratio of NaCl: NH4OH : CO2 1 1:1:1 2 1:3:3 3 1:6:6 According to the yield percent of soda ash from preliminary experiments, independent variables and levels were considered and selected for design of experiment. The levels for each variable were shown in Table III. The experimental results were analyzed by ANOVA and the general equation which satisfied the statistical optimization was second order polynomial equation which was described as follow. Y = β?+ ∑ β? ??? x?+ ∑ β?? ??? x??+ ∑ [3] RESULTS AND DICUSSIONS (1) Experiment No Reaction time(min) Yield % 90 90 90 9.72% 19.63% 16.9% water vapor was driven off. The calcinations reaction was shown in equation 2 [10]. 2NaHCO3 Na2CO3 + H2O + CO2 The calcined soda ash was ground with motor and pestle and finally soda ash was obtained. (2) β?? x?x?+ ε(3) ? ? ∑ ??? ????? @ IJTSRD | Unique Paper ID – IJTSRD27841 | Volume – 3 | Issue – 5 | July - August 2019 Page 1806
International Journal of Trend in Scientific Research and Development (IJTSRD) @ www.ijtsrd.com eISSN: 2456-6470 Where, Y is the predicated response of the yield % of soda ash, xi, xj are the independent variables,β?,β?,β??,β?? are the regression coefficient of intercept, linear, quadratic and interaction effects respectively and ε is the random error [3]. TABLEIIIINDEPENDENTVARIABLESANDLEVELS FOR BOX-BEHNKENDESIGN The experimental runs generated with yield percent of soda ash were shown in table (IV). The analysis of variance for the experimental results was shown in table (V). Level (0) 4.5 7.5 135 180 Variables Symbols (-1) 3 3 90 (1) 6 12 Ammonium Hydroxide (mol) Carbon Dioxide (mol) Reaction Time (min) X1 X2 X3 TABLEIVBOX-BEHNKENDESIGNMATRIX,EXPERIMENTALYIELD% AND PREDICTEDYIELD%OFSODAASH No Run No X1 X2 X3 Experimental Yield % 1 1 -1 0 1 2 2 0 -1 1 3 3 0 1 -1 4 4 -1 0 -1 5 5 1 0 1 6 6 -1 1 0 7 7 1 1 0 8 8 -1 -1 0 9 9 0 0 0 10 10 1 -1 0 11 11 1 0 -1 12 12 0 0 0 13 13 0 0 0 14 14 0 1 1 15 15 0 -1 -1 Predicted Yield % 9.42 6.47 1.83 19.88 17.92 2.46 -0.10 6.50 4.34 -1.98 0.33 4.34 4.34 4.46 1.97 9.60 6.60 1.70 22.12 15.68 0.36 0.20 6.62 4.34 0.12 0.16 4.04 4.64 6.40 0.04 TABLEV.ANALYSIS OF VARIANCEFORYIELD% OF SODAASH DF SS Adj MS F value Regression 9 532.768 59.196 linear 3 88.892 29.631 Square 3 237.690 79.230 Interaction 3 206.187 68.729 Error 5 26.841 5.368 Lack of fit 3 26.661 8.887 Pure Error 2 0.180 0.090 Yield % = 129.3 - 28.68 X1 + 3.21 X2 - 62.7 X3 + 1.241 X12 - 0.2673 X22 + 8.46 X32 + 0.219 X1X2+ 6.23 X1X3 - 0.138 X2X3 Source P value 0.008 0.048 0.006 0.009 - 0.01 R2 R2adj 86.57% 11.03 5.52 14.76 12.80 - 98.74 - 95.20 % (4) F-value and P-value were used to check the significance of the model. According to the ANOVA table , the P-value of the model was less than 0.05, which described that it was a significant model. Based on 95 % confidence level , the model was confirmed to be significant as the computed F value , (11.03) was much higher than that the theoretical F value ,F0.05:(9,5)(4.77). The high value of R2 and R2adj representing the high degree of correlation between the experimental yield % and predicted yield %. The coefficient of determinations (R2) was 95.20 % which indicated that the model was significantly effected and represented the real relationship among the parameters.So ,it can be said a fitted model [11] . The optimum value of 19.882 % was obtained at molar ratio of salt to ammonium hydroxide to carbon dioxide 1:3: 6.8 and reaction time 1.50 hr. When this optimization was validated with the experiment, it gave percent conversion of yield percent of 19 %.It can be found that error percent of 4.4 which was acceptable within the range of 95 % confidence level. D.Characterizations of Soda Ash The products were analyzed by X-ray diffraction (XRD), Scanning Electron Microscopy (SEM), Energy Dispersive X- rays Fluorescence (EDXRF), and Fourier Transform-Infrared Spectroscopy (FTIR). 1.X-ray diffraction (XRD) The XRD patterns of soda ash from experiment 1, experiment 2, expriment 3 and optimum condition of soda ash from Box- Behnken experimental design was shown in Figure. 2 .They were compared to standard soda ash. According to the XRD patterns, experiment 1 , experiment 2 and experiment 3 have thirteen characteristic peaks. However the soda ash which prepared by optimum condition of Box-Behnken experimental design was more clear and favorable.It has thirteen characteristics peaks and observed at angle 2 ?(27.188) , (29.953), (34.021), (33.082), (34.354), (35.055), (37.736), (39.705), (41.215), (41.460), (53.423), (56.874), (62.419) were corresponding to (201), (002), (020), (-202), (-112), (310), (112), (202), (400), (- @ IJTSRD | Unique Paper ID – IJTSRD27841 | Volume – 3 | Issue – 5 | July - August 2019 Page 1807
International Journal of Trend in Scientific Research and Development (IJTSRD) International Journal of Trend in Scientific Research and Development (IJTSRD) @ www.ijtsrd.com www.ijtsrd.com eISSN: 2456-6470 221), (222), (402) and (-601).The highest intensities peaks of soda ash from optimum condition was occurred at 2 37.736) and 2 ? (29.953). According to the XRD product was said to soda ash. hest intensities peaks from optimum condition was occurred at 2 ?( (29.953). According to the XRD patterns, the Optimal Condition ptimal Condition Optimum Condition Optimum Condition Figure. 5. SEM image of Soda Ash from Experiment 3 Soda Ash from Experiment 3 Experiment Experiment - 3 Experiment Experiment -3 Experiment Experiment -2 Experiment Experiment - 2 Experiment Experiment -1 Experiment xperiment -1 Standard soda ash soda ash Figure.6 SEM image of Soda Ash from Optimum Condition Condition ray Fluorescence (EDXRF) Quantitative results of soda ash were analyzed by using rays Fluorescence (EDXRF). According to results, carbon percent from experiment (1) , experiment (2) and experiment (3) were 92.64% , 93.73% and 92.53 % respectively . Sodium percent from experiment (1), experiment (2) and experiment (3) were 7.07 % , 6.08% and 7.27% respectively. According to the experimental results, the optimnum condition of soda ash was analyzed by Fourier Transform Infread Spetroscopy (FTIR). SEM image of Soda Ash from Optimum Figure.2. XRD patterns of Synthetic Soda Ash 2. XRD patterns of Synthetic Soda Ash 3.Energy Dipersive X-ray Fluorescence (EDXRF) Quantitative results of soda ash were analyzed by using Energy Dipersive X-rays Fluorescence (EDXRF). According to the EDXRF results, carbon percent from experiment (1) , experiment (2) and experiment (3) were 92.64% , 93.73% and 92.53 % respectively . Sodium percent from experiment (1), experiment (2) and experiment (3) were 7.07 % , 6.08% and 7.27% respectively. According to t results, the optimnum condition of soda ash was Fourier Transform Infread Spetroscopy (FTIR). 4.Fourier Transform Infrared Spectroscopy (FTIR) The optimum condition of soda ash pepared by Box experimental design was analyzed by Fourier Transform Infrared Spectroscopy .The spectra was recorded in the range (500- 4000 cm -1) . According to the infrared spectrum of soda ash , the stretching bonds of (O approximately 3500 cm-1 and 3000 cm have been attributed to hydroxyl group.The stretching bond of (C-O) was occurred at 1454.38 cm of (C-CL) was occurred at 858.38 cm impurities in the sample.The infrared spectrum of soda ash from optimum condition is nearly the same as soda ash [11]. 2.Scanning Electron Microscopy (SEM) In this study ,the morphology of synthetic soda ash were determined by Sacnning Electron Microscopy (SEM). SEM images of soda ash from expermient 1, 2 and 3 were shown in Fig. 3,4 and 5. According to the experiment 1 and experiment 2 were rod shape and they were aggregated to each other. The SEM image from experiment 3 was cylindrical shape.The morphology of image of soda ash from optimum condition was shown in Fig.6. It was more aggregate and fine than experiment 1, experiment 2 and 3. According to the SEM images , the shapes of soda ash samples were generally in they were formed as crystalline structure. Some of them were aggregated and some were scattered. were aggregated and some were scattered. Scanning Electron Microscopy (SEM) In this study ,the morphology of synthetic soda ash were by Sacnning Electron Microscopy (SEM). The SEM images of soda ash from expermient 1, 2 and 3 were shown in Fig. 3,4 and 5. According to the SEM images, experiment 1 and experiment 2 were rod shape and they were aggregated to each other. The SEM image from experiment 3 was cylindrical shape.The morphology of SEM image of soda ash from optimum condition was shown in more aggregate and fine than experiment 1, experiment 2 and 3. According to the SEM images , the Fourier Transform Infrared Spectroscopy (FTIR) soda ash pepared by Box-Behnken experimental design was analyzed by Fourier Transform Infrared Spectroscopy .The spectra was recorded in the ) . According to the infrared spectrum of soda ash , the stretching bonds of (O-H) were observed at and 3000 cm-1respectively and have been attributed to hydroxyl group.The stretching bond occurred at 1454.38 cm -1 .The stretching bond occurred at 858.38 cm-1 that is due to the ample.The infrared spectrum of soda ash from optimum condition is nearly the same as the standard nerally in rod shape and structure. Some of them 85 Figure.3. SEM image of Soda Ash from Experiment 1 Figure.3. SEM image of Soda Ash from Experiment 1 T % Wavelength (cm Wavelength (cm-1) Figure.7. Infrared Spectrum of Standard Soda Ash[1 Figure.7. Infrared Spectrum of Standard Soda Ash[1 Figure.4. SEM image of Soda Ash from Experiment 2 Figure.4. SEM image of Soda Ash from Experiment 2 @ IJTSRD | Unique Paper ID – IJTSRD2 27841 | Volume – 3 | Issue – 5 | July - August 2019 August 2019 Page 1808
International Journal of Trend in Scientific Research and Development (IJTSRD) @ www.ijtsrd.com eISSN: 2456-6470 MgSO4 + Ca(OH)2 Lime- soda softening Removal of Carbonate hardness with lime Ca2+ + 2HCO3- + Ca (OH)2 Mg2+ + 2HCO3 + 2Ca(OH)2 [13] Removal of non-carbonate hardness with soda ash and lime Ca2+ + 2Cl- +Na2CO3 CaCO3 + 2Na+ +2Cl- (11) Ca2+ + SO42- + Na2CO3 CaCO3 + 2Na+ + SO42- (12) [13] Mg2+ + 2Cl- + Ca(OH)2 Mg(OH)2 + Ca2++ 2Cl- (13) [13] Mg2++ SO42-+ Ca(OH) Mg(OH)2 +Ca2++ SO42- (14) [13] Recarbonation for pH Control CO32- + CO2+ H2O 2HCO23- (15) In this research , water soft ening process was carried out by various dosage of lime and soda ash.Experiment (I)was carried out by single-stage lime-softening process. Experiment (II) was carried out by synthesized soda ash. Experiment (III) was carried out by water softening by using both lime and synthesized soda ash. Experiment (IV) was carried out by water softening by using both lime and commercial soda ash. 1.Procedure of Water Softening with Lime In experiment I , raw water (100) ml was taken to treat with 10 % lime solutuion (Ca(OH)2). And then , it was stirred by magnetic stirrer with 500 rpm. After that it was settled for 10 min. The lime treated water was passed through the filter paper and pH was measured before and after filtration. According to this experiment, when the lime dosage was increased, the pH of water was increased from initial condition to pH 9. On the other hand, total hardness was decreased from initial condition of 255 ppm to 229, 200, 242 ppm respectively. According to the experimental results, the optimum condition was observed at 0.3 ml of lime for 100 ml of sample water. The effect of various dosage of lime vs total hardness and pH was shown in Figure 8. CaSO4 + Mg(OH) (8) [4] 2CaCO3 + 2H2O (9) [13] 2CaCO3 + Mg(OH)2 + H2O (10) [13] [13] Figure.8. Infrared Spectrum of Soda Ash from Optimum Condition E.Application of Soda Ash According to the analytical results of the synthetic soda ash , it was confirmed as soda ash. It was applied in water softening process for removal of total harhness of water. Water sample was taken from the laboratory of Chemical Engineering Department from West YangonTechnological University Campus, Hlaing Tharyar Township, Yangon Region.Water analysis was carried out by APHA standard methods. The charaterization of raw water was shown in Table(VI). TABLE(VI).Characterization of Raw Water No Specifications 1 Total Hardness(ppm) 2 Total Alkalinity(ppm) 3 Calcium(ppm) 4 Magnesium(ppm) 5 Sulfate(ppm) 6 Chloride(ppm) 7 Iron(ppm) 8 pH F.Water Softening 1.Precipitatives Softening Precipitative softening uses lime (Ca(OH)2) and soda ash (Na2CO3) to remove calcium and magnesium ions from solution. Lime added to water reacts first with free carbon dioxide forming a calcium carbonate precipitate .The lime reacts with free carbon dioxide forming a calcium bicarbonate present . In both of these equation one equivalent of lime reacts with free carbon dioxide forming a calcium carbonate precipitate. The lime reacts with any calcium bicarbonate present. In both of these equations, one equivalent of lime combines with one equivalent of either CO2 or Ca(HCO3)2 . CO2 + Ca(OH)2 CaCO3 + H2O (4) Ca(HCO3)2 + Ca(OH)2 2CaCO3 + 2H2O (5) Since magnesium precipitates as Mg(OH)2 Mg (HCO3)2 + Ca(OH)2 MgCO3 + CaCO3 + 2H2O (6) [4] MgCO3 + Ca (OH)2 Mg (OH)2 + CaCO3 (7) [4] Value 255 85 47 4.37 43.1 400 28 7.9 [4] [4] Figure.8. Effect ot of Total Hardness and pH with various dosage of Lime Solution @ IJTSRD | Unique Paper ID – IJTSRD27841 | Volume – 3 | Issue – 5 | July - August 2019 Page 1809
International Journal of Trend in Scientific Research and Development (IJTSRD) @ www.ijtsrd.com eISSN: 2456-6470 According to this graph, when lime dosage was increased, pH was steadily increased. However, lime dosage was exceeded over the required level, hardness of water was returned to increase . According to this graph , only lime solution can not reduced the total hardness significantly. 2.Procedure of Water Softening Process With Synthesized Soda Ash In experiment (II) , raw water (100) ml was taken to treat with 5 % synthesized soda ash solution . And then it was stirred by magnetic stirrer with 500 rpm. After that , it was settled for 10 min and passed through a filter paper. The soda ash treated water was analyzed by EDTA titration method to know the removal efficiency of total hardness. According to the experimental results , hardness of water was effected by various dosage of soda ash.When the dosage was increased , the pH of water was significantly increased. So , the hardness and pH of water were inversely proportional according to the dosage of soda ash. However, the dosage of synthesized soda ash was exceeded over the required level , hardness level of water was increased significantly. The effect of synthesized soda ash vs total hardness and pH was shown in Figure.9. According to the experiment, lime and various dosage of synthesized soda ash was effectively reduced the water hardness. Maximum removal percent of hardness of water was observed at 0.3 ml of lime and 2 ml of synthesized soda ash. The effect of both lime and soda ash dosage vs pH and total hardness was shown in Fig. 10. Figur.10. Effectof Lime-Soda Dosage by Synthesized Soda Ash According to this graph , hardness of water was dramatically decreased but pH of water was increased. When the dosage of was increased over the required level, the hardnesslevel of water was slightly increased. 4.Procedure of Water Softening Using Both Lime and Commercial Soda Ash In experiment IV, lime-soda softening process was carried out using the commercial grade soda ash to reduce the hardness of water. The procedure was the same as using the lime and various synthesized soda ash. According to the results, water softening by using both lime and commercial soda ash dosage effectively reduced the water hardness. The maximum removal of hardness of water was observed at 0.3 ml of lime and 2ml of commercial soda ash. The effect of lime and soda ash dosage on pH and total hardness was shown in Figure 11. Figure.9. Effect of Total Hardness and pH with Various Dosage of Synthesized Soda Ash Solution According this graph, pH level was sharply raised when the dosage was increased. The hardness of water was significantly decreased from initial condition of 255 ppm to 171 ppm. However, hardness level was returned to increase when the dosage was increased. 3.Procedure of Water Softening Using Both Lime and Synthesized Soda Ash In experiment (III ) , water sample was treated by using both lime and synthesized soda ash. According to the lime process, 0.3 ml of lime was taken as optimum condition because which removed the hardness than other dosage. According to the lime dosage, the pH level of water was raised; the bicarbonates ions were converted to carbonate concentration. Due to the increase in carbonate concentration, precipitates of calcium carbonate were formed. The remaining calcium cannot be removed by simple adjustment of pH. So, soda ash solution was added by varying the dosage to precipitates the remaining calcium. In lime-soda treatment, the pH level was raised by addition of lime while sodium carbonate was added to reduce residual carbonate hardness. The treated water was passed through the filter paper, and then it was analyzed by EDTA titration method. Figur11.Effect of lime and various dosage of commercial soda ash According to this graph, hardness of water was dramatically decreased but pH of water was increased. When the dosage was increased over the required level, the hardness level of water was slightly increased. @ IJTSRD | Unique Paper ID – IJTSRD27841 | Volume – 3 | Issue – 5 | July - August 2019 Page 1810
International Journal of Trend in Scientific Research and Development (IJTSRD) @ www.ijtsrd.com eISSN: 2456-6470 5.Jar Testing Firstly, one liter of sample water was taken and added to each of the beakers of gang-mixer system. The mixers in each beaker were allowed to set a mixing rate of 150 rpm. Next, 5% of commercial grade sodium carbonate solution was added into the first beaker. And then, 5% of synthesized soda ash solution was added into the second beaker and allowed to mix with 150 rpm. According to the lime-soda softening process, the optimum condition of 3 ml of lime solution was added into the third and fourth beakers. After 10 minutes, the beakers were allowed to settle. Following the settling period, the samples were collected from each beaker and filtered. The pH levels were measured for adjusting the optimum range. After that, 5% synthesized soda ash solution was added into lime treated water by varying dosage. The mixers in each beaker were allowed to set up the 150 rpm. After 10 minutes, the beakers were allowed to settle for 10 minutes. After settling, the samples were filtered. The pH was measured before and after filtration. And then it was passed through by carbon dioxide gas to obtain the acceptable pH range of (6.5- 8.5). Finally, the treated waters were measured pH and total hardness. According to the jar testing results, lime-soda softening process was more effectively reduced the hardness of water than only synthesized soda ash dosage. Water softening by using both synthesized soda ash dosage and lime is more effective. According to the lime-soda softening process, the optimum condition for one liter water was observed at 3 ml of lime and 20 ml of synthesized soda ash. And then, the treated water from the optimum condition was passed through by carbon dioxide to obtain acceptable pH range of 6.5 ~ 8.5. Finally, it was measured to total hardness, total alkalinity, calcium, magnesium, sulfate, chloride and iron. The result of treated water by jar test was shown in Table VII. The Specifications of treated water was shown in Table VIII. Table VII. JAR Testing Results 5%Soda Ash Solution (ml) Volume of Sample Water (ml) 1000 1000 1000 1000 Hardness Removal % 27.45 31.72 90.59 89.80 10% lime Solution Settling Tim(min) Total Hardness Run No pH Synthesized Commercial 1 2 3 4 - - 3 3 20 - 20 10 - 10 10 10 10 9 9 9.5 9 185 175 24 26 20 - -- TABLE VIIISPECIFICATION OF TREATED WATER Specifications Raw Water Value Treated Water Value Total Hardness(ppm) 255 Total Alkalinity (ppm) 85 Calcium(ppm) 47 Magnesium(ppm) 4.37 Sulfate(ppm) 43.1 Chloride(ppm) 400 Iron(ppm) 28 pH 7.9 No 1 2 3 4 5 6 7 8 24 240 9.02 0.2 45.2 370 < 6.5 According to the experimental results, the concentration of raw water and the treated water were different. Lime-soda softening process was reduced the hardness from initial concentration of 255 pm to 24 ppm. However, the total alkalinity was increased from initial condition of 85 ppm to 240 ppm according to the lime dosage. Calcium, magnesium and iron were dramatically reduced from initial concentrations because of lime and soda ash dosage. Sulfate was slightly increased from initial concentration of 43.1 to 45.2 ppm. Chloride was slightly reduced from 400 ppm to 370 according to lime-soda dosage. Before carbonation, pH of treated water is 9.5; it was reduced to pH 6.5 by passing carbon dioxide gas. It was within the acceptable level. The initial pH of raw water is 7.9.The final pH of treated water was 6.5. IV. CONCLUSIONS In this study, the soda ash is prepared synthetically by Solvay process by the use of Box-Behnken experimental design. The maximum yield percent of 19.882% was obtained with the reaction salt to ammonium hydroxide to carbon dioxide ratio of 1:3:6.8 during reaction time 90 minutes. According to the XRD patterns, SEM images and FTIR result, the optimum condition which prepared by Box- Behnken experimental design is said to soda ash and applied in water softening process. Water softening was carried out by lime softening, softening by synthesized soda ash, softening by commercial soda ash and lime-soda softening process. According to the experimental results, lime softening process cannot adequately reduce the hardness level. Softening by synthesized and commercial soda ash can reduce the hardness level of water. However, the lime-soda process can effectively reduce the hardness level of water. The initial characteristics of raw water is total hardness of 255 ppm, total alkalinity of 85 ppm, calcium of 47 ppm , magnesium of 4.37 ppm , sulfate of 43.1 ppm , chloride of 400 ppm , iron of 28 ppm. The initial pH is 7.9. After lime-soda treatment, the total hardness of 24, total alkalinity of 240, Calcium of 9.02, Magnesium of 0.2, Sulfate of 45.2%, Chloride of 270, Iron of < 0.1 and pH of 6.5 are obtained. @ IJTSRD | Unique Paper ID – IJTSRD27841 | Volume – 3 | Issue – 5 | July - August 2019 Page 1811
International Journal of Trend in Scientific Research and Development (IJTSRD) @ www.ijtsrd.com eISSN: 2456-6470 ACKNOWLEDGEMENT The author would like to express her thanks to all professors and all lecturers of Chemical Ennginering Department, West Yangon Technological University for giving the opportunity to carry out this reseasrch. And also the author is deeply gratitude to professors for their kind advice and systematic guidance . Finally, the author is particularly indebted to Chairman of Green Myanmar Environmental Services for financial support and lab facility for preparing this research. RFERENCES [1]T. Madima , “ Manufcturing of Synthetic Sol da Ash,” M.S.c thesis,University of the Cape, South Africa, Feb.2009 Chemical Engineering , Yangon Technological University [5]Housecroft, C.E and Sharpe, A.G. 2004. Inorganic Chemistry. 2nd edition. Prentice Hall. P187 [6]Air Products and Chemicals (APC), Inc,2009 . “Carbon Dioxide”Product Stewardship Summary [7]M.C.RAND, A.E.GREENBERG, M. J. TARAS , “Standards Methods For the Examination of Water and Waste Water,” 14 th edition [8]Dr. G. W.Latimer, Jr, “Officials Methods of Analysis ofAOAC International , ” 20th edition, 2016 [9]ESEPA- European Soda Ash Procedure Association , “Process BREF For Soda Ash” ,March 2004. [2]K..E McCaleb , TheBiography of a Chemical Economic Handbook Report ,Chemical Information Services, Stanford Research Institute, Melno- Park ,Calif. 94025 , Nov. 1971 [10]R.A.Meyers (Ed.), Encylopedia of Analytical Chemistry, pp.10815-10837, 2000 [11]Anonymous ,”Sodium Carbonate, Database of ART- FT_IR spectra of lisa_Chem_ut.ee>IR_spectra>paint> paint>fillers [3]R. H. MyersandD. C. Montgomery, “Response Surface Methodoloy,” 3rd Edition,2008 various materials< [4]Aung Myint Soe , “ ChT-2024, Introduction to Chemical Technology” Lecture Note, 2003, Department ot [12]Dipa Dey,Amanda Herzog, Vidya Srinivaszn, “ Chemical Precpitation: “Water Softening” , ENE806, May 2 ,2007 @ IJTSRD | Unique Paper ID – IJTSRD27841 | Volume – 3 | Issue – 5 | July - August 2019 Page 1812