Download

1 / 5
50 likes | 71 Vues
Safety and welfare measures are inevitable to any organization where workers are involved. An organization's Responsibility to its Employees extends beyond the payment of wages for their services. The Employer's Safety and Welfare on and off the job within the Organization is the vital concern of the Employer. The data used in the study was Primary data collected using a Structured Questionnaire. Secondary data was collected from company records and the Internet. The Simple Random Sampling method was followed. Conclusions were drawn based on the analysis of data collected from the employees in various grades. The Sample size taken for the study is 102. Statistical tools applied are Simple Percentage, and Chi Square analysis for analyzing the data. Suggestions were provided for improving the overall facilities on Employee safety and welfare programs. A. G. Mythili | R. Sharmitha "A Study on Employee Safety and Welfare Measures with Special Reference to Cotton Industries in Coimbatore District" Published in International Journal of Trend in Scientific Research and Development (ijtsrd), ISSN: 2456-6470, Volume-3 | Issue-6 , October 2019, URL: https://www.ijtsrd.com/papers/ijtsrd29235.pdf Paper URL: https://www.ijtsrd.com/management/hrm-and-retail-business/29235/a-study-on-employee-safety-and-welfare-measures-with-special-reference-to-cotton-industries-in-coimbatore-district/a-g-mythili<br>

E N D
International Journal of Trend in Scientific Research and Development (IJTSRD) Volume 3 Issue 6, October 2019 Available Online: www.ijtsrd.com e-ISSN: 2456 – 6470 A Study on Employee Safety and Welfare Measures with Special Reference to Cotton Industries in Coimbatore District A. G. Mythili1, R. Sharmitha2 1Assistant Professor, 2PG Scholar 1,2Dr. SNS Rajalakshmi College of Arts and Science, Coimbatore, Tamil Nadu, India ABSTRACT Safety and welfare measures are inevitable to any organization where workers are involved. An organization’s Responsibility to its Employees extends beyond the payment of wages for their services. The Employer’s Safety and Welfare on and off the job within the Organization is the vital concern of the Employer. The data used in the study was Primary data collected using a Structured Questionnaire. Secondary data was collected from company records and the Internet. The Simple Random Sampling method was followed. Conclusions were drawn based on the analysis of data collected from the employees in various grades. The Sample size taken for the study is 102. Statistical tools applied are Simple Percentage, and Chi-Square analysis for analyzing the data. Suggestions were provided for improving the overall facilities on Employee safety and welfare programs. KEYWORDS: employee safety and welfare facilities. How to cite this paper: A. G. Mythili | R. Sharmitha "A Study on Employee Safety and Welfare Measures with Special Reference to Cotton Industries in Coimbatore District" International Journal of Trend in Scientific Research and Development (ijtsrd), ISSN: 2456-6470, Volume-3 | Issue-6, October 2019, pp.733-737, URL: https://www.ijtsrd.com/papers/ijtsrd29 235.pdf Copyright © 2019 by author(s) and International Journal of Trend in Scientific Research and Development Journal. This is an Open Access article distributed under the terms of the Creative Commons Attribution License (CC (http://creativecommons.org/licenses/by /4.0) Published in IJTSRD29235 BY 4.0) INTRODUCTION Employee Welfare is the term including various Services, benefits, and facilities offered to Employees by the Employers. Welfare measures need not be monetary but in any kind/form. This includes items such as Bonus, Transportation, Medical Insurance and food. It also includes monitoring of working conditions, creation of industrial harmony through Infrastructure for Health, Industrial Relation and Insurance against Diseases. Though such generous benefits the employer makes life worth living for employees. Welfare includes anything that is done for the comfort and improvement of employees and is provided over and above the wages. Welfare helps in keeping the morale and motivation of the employees high so as to retain the employees for a longer duration. Employee Safety refers to the act of protecting the physical well being of the Employee. It includes the Risk of accidents caused due to machinery, fire or diseases. In nutshell, it is said to be as anything that is done for the Intellectual, Physical, Moral and Economic Betterment of the Workers, whether by Employers, by Government or by other agencies, over and above what is laid down by law or what is normally expected of the contractual benefits for which workers have bargained. REVIEW OF LITERATURE Dr. K. Nithyavathi (2016) conducted a study on Safetyand Welfare Measures of the Employees in the Textile Industry in Tirupur District with the objective to know the Perception of the employees regarding Safety and welfare measures. The Researcher collected Primary data from 150 Respondents, by Interview Schedule method. She applied the Percentage analysis and Chi-square Test for analyzing the data. After analyzing the data, she concluded that Necessary compensation must be provided in the case of unexpected accidents that take place at the two basic factors: Technical and Human. Hence, it is suggested to provide a healthy and safe environment for the betterment of both Employees and the Organization. T.Sabarirajan, T. Meharrajan, B.Arun(2016) conducted a study on Welfare Measures and their Impact on Textile Mills with reference to Salem District” with the objective to find out the Satisfaction level of the employees and the impact of welfare measures on quality of work-life among Employees. The Researcher collected Primary data from 250 Respondents using the Sampling Technique. He applied statistical tools like Chi-square, ANOVA and Percentage analyses to analyze the data. After analyzing the data he concluded that the satisfaction level of the employees at the areas of Trade union activities, Safety and welfare measures, Work atmosphere, Promotional and Recreational facilities, and Medical facilities are Satisfactory. Hence, it is suggested to have further betterment in the future. @ IJTSRD | Unique Paper ID – IJTSRD29235 | Volume – 3 | Issue – 6 | September - October 2019 Page 733
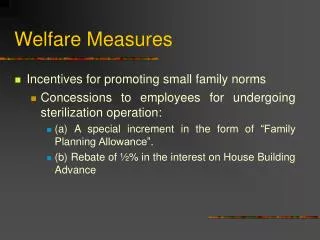
International Journal of Trend in Scientific Research and Development (IJTSRD) @ www.ijtsrd.com eISSN: 2456-6470 ?To analyze the Safety programs of the employees those are provided by the company. ?To provide certain suggestions based on the findings to improve the welfare and safety facilities provided by the company. HYPOTHESIS Objective 2: Analyze the Safety measures of the Employees. ?Ho: There is no relationship between Gender and Safety of the Employees. ?H1: There is a relationship between Gender and Safety of the Employees. DATA COLLECTION METHOD Data collection methods are an integral part of the research design. The task of the data collection begins after a research problem has been defined and research design checkout. While deciding about the method of data collection to be used for the study the researches should keep in mind two types of data viz, primary data and secondary data. Primary data collection ?It refers to the data observed or collected directly from first hand. ?The questionnaire method is used to collect data from respondents. Secondary data collection ?It refers to the statistical method which is not originated by the investigator himself but obtained from someone else records. Sample ?The sample is the true representation of the population by studying the sample we can predict the behavior of the population. The sample size used in the research was 102 samples. Sampling procedure ?The sampling procedure adopted in the present study is random sampling. TOOLS USED FOR THE STUDY ?Data analysis was done using Simple percentage analysis, Chi-square Test to analyze the data. PERCENTAGE ANALYSIS Percentage analysis is mainly used to determine the distribution of respondents coming under different categories. It is expressed in percentages mainly facilitate standardization and comparison between two or more series of data. Percentages are used to describe the relationship. Formula Number of respondents x100 Total number of respondents CHI-SQUARE ANALYSIS The Chi-square Test is an important test amongst the several tests of significance adopted by the statisticians. Chi-square is a statistical measure used in sampling analysis for comparing a theoretical variance. It is calculated using the SPSS 17.0 package by choosing Analyze=======? Non- Parametric Test==========? Chi-Square Test. Uttam Kumar and Dr. J. K. Panda (2015) suggested a Study on Employee Welfare Measures With Special Reference To Mahanadi Coalfield Ltd, Indi with the objective to find out whether welfare activities contribute to the Productivity and Profitability of the Organization. The Researcher collected Primary data from 80 Respondents which conducts personal Interviews from the Human Resource Department. He applied Percentage analysis to analyze the data. After analyzing the data, he concluded that welfare activities contribute to the Productivity and Profitability of the Organization. Hence, it is suggested that MCL must concentrate and improve the dissatisfaction level of Employees in terms of welfare activities to enhance the Productivity of the Organization. S. Divyabharathi& Rp. Nivethiga (2017) conducted a study on Employee Welfare Schemes in Lear Automotive Pvt Ltd, Chennaiwith the objective to find out the existing welfare measures and its impact upon the worker's health and productivity. The Researcher collected Primary data from 100 respondents using Random Sampling Technique. He used Percentage analysis to analyze the data. After analyzing the data she concluded hat employees were highly satisfied with the quality and hygiene of food, drinking water, and Transport facilities. Further, it is suggested that the organization must concentrate on Social security which will help to improve Job Satisfaction. Indumadhi.R & Kamaraj .S (2012) conducted a Study on Quality of Work Life among Workers with Special Reference to Textile Industry in Tirupurwith the objective to assess the quality of work-life among workers and the factors affecting the quality of work life. The Researcher collected Primary data from 60 workers using a convenient sampling technique. He used a Simple percentage Analysis and Chi- Square Test to analyze the data. After analyzing the data he concluded that workers were not much satisfied with the relation and co-operation with workers and also the Salary. Hence, it is recommended to improve safety measures and necessary training programs for effective performance. STATEMENT OF THE PROBLEM Every employee in every organization is facing many problems regarding safety for the women employees as well as for men in several areas. Even though the government has announced several measures for the employees but as a general don’t know whether the company is providing welfare activities or not and the employees are satisfied are not. So, the researcher aims to study the safety and their welfare measure of the cotton industry. RESEARCH METHODOLOGY Research is derived from the French word “research” i.e. re+search which means to seek again. Research can be defined as the search for knowledge or any systematic investigation to establish facts. The Methods, Tools, Techniques used in the process of Research can be termed as the Research Methodology. OBJECTIVES OF THE STUDY ?To study the existing welfare facilities provided to the employees. ?To examine the Employees satisfaction with the present welfare facilities. @ IJTSRD | Unique Paper ID – IJTSRD29235 | Volume – 3 | Issue – 6 | September - October 2019 Page 734
International Journal of Trend in Scientific Research and Development (IJTSRD) @ www.ijtsrd.com eISSN: 2456-6470 DATA ANALYSIS AND INTERPRETATIONS The data collected through various sources have been analyzed in the following pages. TABLE-1 SHOWING AGE OF THE RESPONDENTS NO.OF RESPONDENTS 18-25 years 51 26-30 years 27 31-40 years 16 41-50 years 03 51-60 years 05 TOTAL 102 Source: primary data INTERPRETATION The above table shows that 50% of them are below 25 years, 276.47% of them are below 30 years, 15.68% of them are below 40 years, 2.94% of them are below 50 years, and 4.90% of them are below 60 years. TABLE-2 SHOWING GENDER OF THE RESPONDENT GENDER NO. OF. RESPONDENTS PERCENTAGE MALE 38 FEMALE 64 TOTAL 102 Source: primary data INTERPRETATION The above table shows that 37.25% of the Employees are Male and 62.74% of them are Female. TABLE-3 SHOWING MONTHLY INCOMES OF THE RESPONDENTS NO.OF RESPONDENTS 5000-10000 10 10001-20000 58 20001-30000 18 30001-40000 16 TOTAL 102 Source: primary data INTERPRETATION The above table shows that 9.80% of the Employees earn Income below Rs.10000, 56.86% of them are below 20000, 17.64% of them are below 30000, 15.68% of them are below 40000. TABLE-4 SHOWING OPINIONS ON PRESENT WELFARE FACILITIES NO. OF. RESPONDENTS Highly Satisfied Satisfied Neutral Dissatisfied Highly Dissatisfied Total 102 Source: primary data INTERPRETATION From the above Table, it shows that 0.98% of the employees are highly satisfied, 50% of the employees are satisfied with the present welfare facilities that are provided by the company, 33.33% of them are Neutral, 15.68% of them are dissatisfied. TABLE-5 SHOWING WORKING HOURS WORKING HOURS RESPONDENTS Highly Satisfied 05 Satisfied 43 Neutral 41 Dissatisfied 13 Highly Dissatisfied Total 102 Source: primary data INTERPRETATION From the above Table, it shows that 4.90% of the Employees are Highly Satisfied, 42.15% of them are Satisfied, 40.19% of them are Neutral, 12.74% of them Dissatisfied. TABLE-6 SHOWING SECURITIES NO. OF. RESPONDENTS Highly Satisfied Satisfied Neutral Dissatisfied Highly Dissatisfied Total 102 Source: primary data INTERPRETATION From the above Table, it shows that 55.88% of them are satisfied, 33.33% of them are Neutral, 10.78% of them are dissatisfied. TABLE-7 SHOWING VENTILATION AND AIR CONDITIONER FACILITIES NO. OF. RESPONDENTS Highly Satisfied Satisfied Neutral Dissatisfied Highly Dissatisfied Total 102 Source: primary data INTERPRETATION From the above Table, it shows that 18.62% of the Employees are Highly Satisfied, 42.15% of them are satisfied, 31.37% of them are Neutral, 7.84% of them are dissatisfied. TABLE-8 SHOWING FIRST-AID FACILITIES FIRST AID FACILITIES RESPONDENTS Highly Satisfied Satisfied Neutral Dissatisfied Highly Dissatisfied Total 102 Source: primary data NO. OF. PERCENTAGE PERCENTAGE % 50 26.47 15.68 2.94 4.90 99.99 AGE 4.90 42.15 40.19 12.74 0 0 99.98 PERCENTAGE (%) 0 55.88 33.33 10.78 0 99.99 SECURITY 37.25 62.74 99.99 0 57 34 11 0 INCOME PERCENTAGE 9.80 56.86 17.64 15.68 99.98 VENTILATION PERCENTAGE 19 43 32 08 0 18.62 42.15 31.37 7.84 0 99.98 OPINION PERCENTAGE 1 51 34 16 0 0.98 50 33.33 15.68 0 99.99 NO. OF. PERCENTAGE (%) 60.78 30.39 8.82 0 0 99.99 62 31 09 0 0 @ IJTSRD | Unique Paper ID – IJTSRD29235 | Volume – 3 | Issue – 6 | September - October 2019 Page 735
International Journal of Trend in Scientific Research and Development (IJTSRD) @ www.ijtsrd.com eISSN: 2456-6470 INTERPRETATION From the above Table, it shows that 60.78% of the Employees are Highly Satisfied, 30.39% of them are satisfied, and 8.82% of them are Neutral. TABLE-9 SHOWING BONUSES NO. OF. RESPONDENTS Highly Satisfied Satisfied Neutral Dissatisfied Highly Dissatisfied Total Source: primary data INTERPRETATION From the above Table, it shows that 40.19% of the Employees are Highly Satisfied, 48.03% of them are satisfied, and 11.76% of them are Neutral. TABLE-10 SHOWING RESTROOM FACILITIES NO. OF. RESPONDENTS Highly Satisfied Satisfied Neutral Dissatisfied Highly Dissatisfied Total 102 Source: primary data INTERPRETATION From the above Table, it shows that 52.94% of the Employees are satisfied, 39.21% of them are Neutral, and 7.84% of them are Neutral TABLE-11 SHOWING LEAVE APPROACH LEAVE APPROACH RESPONDENTS Highly Satisfied Satisfied Neutral Dissatisfied Highly Dissatisfied Total Source: primary data INTERPRETATION From the above Table, it shows that 7.84% of the Employees CHI-SQUARE TEST FREQUENCIES are satisfied, 21.56% of them are Neutral, 44.11% of them are dissatisfied, and 26.47% are Highly Dissatisfied. TABLE-12 SHOWING DRINKING WATER DRINKING WATER RESPONDENTS Highly Satisfied Satisfied Neutral Dissatisfied Highly Dissatisfied Total 102 Source: primary data INTERPRETATION From the above Table, it shows that 3.92% of the Employees are Highly Satisfied, 60.78% of them were satisfied, 26.47% were Neutral, and 8.82% were dissatisfied. TABLE-13 SHOWING WORK SHIFTS WORK SHIFTS RESPONDENTS Highly Satisfied Satisfied Neutral Dissatisfied Highly Dissatisfied Total Source: primary data INTERPRETATION From the above Table, it shows that 3.92% of the Employees are Highly Satisfied, 60.78% of them were satisfied, 26.47% were Neutral, and 8.82% were dissatisfied. CHI-SQUARE ANALYSIS To find out the Relationship between the Gender and the Security of the Employees towards the Safety measures AIM: To test the Hypothesis from the given data using Chi- square Analysis NULL HYPOTHESIS There is no relationship between the Gender and the Security of the Employees towards the Present Welfare facilities provided by the cotton industry. ALTERNATIVE HYPOTHESIS There is a relationship between the Gender and the Security of the Employees towards the Present Welfare facilities provided by the cotton industry. NO. OF. PERCENTAGE 4 62 27 09 0 3.92 60.78 26.47 8.82 0 99.99 BONUS PERCENTAGE 41 49 12 0 0 102 40.19 48.03 11.76 0 0 99.98 NO. OF. PERCENTAGE 2 27 44 25 04 102 1.90 26.47 43.13 24.50 3.92 99.92 RESTROOM PERCENTAGE 0 54 40 08 0 0 52.94 39.21 7.84 0 99.99 NO. OF. PERCENTAGE 0 08 22 45 27 102 0 7.84 21.56 44.11 26.47 99.98 DESCRIPTIVE STATISTICS Mean Std. Deviation Minimum Maximum 1.62 .488 2.78 .991 SECURITY Observed N Expected N Residual 52 25.5 31 25.5 8 25.5 11 25.5 102 N GENDER SECURITY 102 102 1 2 2 5 B C D E 26.5 5.5 -17.5 -14.5 Total @ IJTSRD | Unique Paper ID – IJTSRD29235 | Volume – 3 | Issue – 6 | September - October 2019 Page 736
International Journal of Trend in Scientific Research and Development (IJTSRD) @ www.ijtsrd.com eISSN: 2456-6470 TEST STATISTICS GENDER SECURITY 5.647 1 ..881 1.000c .030 .055 Chi-square Of Asymp. Sig. Monte carlo.sig sig. 98% confidence interval Lower bound Upper bound 48.980b 3 .881 1.000c .30 .044 Hence, the P (value) is greater than 0, 05, (ie) 1.000, we reject Null Hypothesis and accept Alternative Hypothesis (H1) FINDINGS, SUGGESTIONS, CONCLUSION FINDINGS ?Majority of 50% of the Respondents are below 30 years ?Majority of 62.74% of the Respondent are Female ?Majority of the Respondents Income is below Rs.20000 ?Majority of 50% of the Respondents are Satisfied with the present Welfare facilities ?Majority of 42.15% of the Respondents are Satisfied with the present Working hours of the Organization ?Majority of 55.88% of the Respondents are Satisfied with the Sentiment Security Measures provided by the Company ?Most of 42.15% of the Respondents are Satisfied with the Ventilation and Air Conditioner facilities ?Most of the Employees of 60.78% are Highly Satisfied with the First Aid facilities that are offered by the Company ?Majority of 48.03% of the Respondents are Highly Satisfied with the Bonus facilities ?Majority of 52.94% of the Respondents are satisfied with the Rest Room facilities. ?Majority of 44.11% of the Respondents are Dissatisfied with the Leave Approach. ?Majority of 60.78% of the Respondents are satisfied with the drinking water facilities. ?Majority of 43.13% of the Respondents shared Neutral Experience towards work shifts ?There is a Relationship between the Gender and Security of the Respondents towards the Safety Measures SUGGESTIONS ?The Responses of the Employees regarding the level of Satisfaction of workers are clustered in the satisfactory region. The management may take necessary steps to convert these into Highly Satisfactory. ? The Leave Approach methods can be Improved for the Betterment of the Employees ? It is better to have Non-Problematic committee within the organization that ensures the Employees especially Female Employees to Get Rid of the Problems ? Alternative Rewards can be provided for the Upliftment in their Careers. ? Canteen Facilities with good Nutritious food can be provided to the Employees. CONCLUSION The study reveals that the majority of employees are satisfied with the working conditions and welfare facilities. Employee’s satisfactory level can be enhanced by improving the facilities regarding dust and fumes control, Leave Encashment, purified water facilities, cleanliness in the canteen and quality of food in the canteen. The separate labor welfare facilities can improve welfare facilities through regular Inspection. This Committee can also hear the needs of the employees for further improvements in the safety and welfare facilities. REFERENCES [1]Gupta, C.B., ―Human Resource Management‖, Sultan Chand, 1999 [2]Prasad, L.M, ―Human Resource Management‖, Sultan Chand & Sons, 2005 [3]Kothari C.R, ―Research Methodology‖, New Delhi, Vikas Publishing House, 1967 [4]Tripathi, P.C., ―Personnel Management‖, Bombay, Asra Publishing House, 1967 WEBSITE ?www.chrmglobal.com/Articles/183/1/Quality-of-Work- Life ?www.citehr.com ?www.tradeget.com ?www.ibef.org ?www.economywatch.com ?www.indialine.com @ IJTSRD | Unique Paper ID – IJTSRD29235 | Volume – 3 | Issue – 6 | September - October 2019 Page 737