Download
1 / 24
240 likes | 245 Vues
Despite the Global effort that have been intensified greatly, especially over the past two decades, the incidence of tuberculosis is in increase with about 2 billion infected individuals WHO, 2014 . This work sorts to add to the available knowledge of the effects anti tuberculosis drugs have on various physiological systems with specific interest on the hematological parameters and serum protein level. This study was carried out using 24 male wistar rats weighing within the range of 150 200 g. These animals were randomly separated into four groups of eight rats each. One of these groups is the control group fed with just feed and water and the other two groups labeled group1 and group 2 are the experimental groups receiving an administration of 22.5mg kg and 45mg kg respectively of the FCD anti tb drug solution used for this study. After 21 days of administration of the drug solution at the specified dosage, blood sample was collected and the sample was analyzed to obtain some hematological parameters and the serum protein this includes, total protein and serum albumin , then the serum globulin was calculated. The hematological parameters that were obtained include RBC count, TWBC count, Hb estimation, PCV and then the hematological indices were calculated using formula given by Ochei and Kolhatkar, 2000. The result obtained from sample analysis was statistically analyzed by one way ANOVA using SPSS v.20.0. The statistical result was insignificant p 0.05 in most of the variables investigated except for the following that were significant p 0.05 RBC count for groups 1 and 2 p value = 0.000 and 0.008 respectively , MHC of group 2 p values= 0.005 , MCV of groups 1 and 2 p values= 0.001 and 0.008 respectively and serum protein level of group 2 p value= 0.030 . Okonkwo, C. O. J | Maduka, S. O | Orji, E. I "Effect of A Standard Anti-Tuberculosis Regimen on Hematological Parameters and Serum Protein Level in Male Wistar RATS" Published in International Journal of Trend in Scientific Research and Development (ijtsrd), ISSN: 2456-6470, Volume-2 | Issue-2 , February 2018, URL: https://www.ijtsrd.com/papers/ijtsrd10691.pdf Paper URL: http://www.ijtsrd.com/medicine/physiology/10691/effect-of-a-standard-anti-tuberculosis-regimen-on-hematological-parameters-and-serum-protein-level-in-male-wistar-rats/okonkwo-c-o-j<br>

E N D
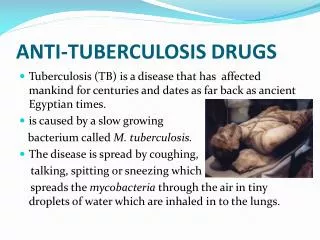
International Research Research and Development (IJTSRD) International Open Access Journal Tuberculosis Regimen on Hematological Parameters and Serum Protein Level in Male Wistar RATS International Journal of Trend in Scientific Scientific (IJTSRD) International Open Access Journal ISSN No: 2456 ISSN No: 2456 - 6470 | www.ijtsrd.com | Volume 6470 | www.ijtsrd.com | Volume - 2 | Issue – 2 Effect of A Standard Anti Parameters and Serum Protein Level in Male Wistar R Parameters and Serum Protein Level in Male Wistar R Effect of A Standard Anti-Tuberculosis Regimen on Hematological Okonkwo, C. O. J Maduka, S. Maduka, S. O Department of Human Physiology, Faculty of Basic Medical Sciences, College of Medicine, Azikiwe University, Nnewi Campus, Okofia, Anambra State, Nigeria Department of Human Physiology, Faculty of Basic Medical Sciences, College of Medicine, Nnamdi , Nnewi Campus, Okofia, Department of Human Physiology, Faculty of Basic Medical Sciences, College of Medicine, Nnamdi Azikiwe University, Nnewi Campus, Okofia, Department of Human Physiology, Faculty of Basic Medical Sciences, College of Medicine, Azikiwe University, Nnewi Campus, Okofia, Anambra State, Anambra State, Nigeria Orji, E. I siology, Faculty of Basic Medical Sciences, Nnamdi Azikiwe University, Nnewi Campus, Department of Human Phy College of Medicine, College of Medicine, Nnamdi Azikiwe University, Nnewi Campus, Okofia, Anambra State, Nigeria Department of Human Physiology, Faculty of Basic Medical Sciences, ABSTRACT Despite the Global effort that have been intensified greatly, especially over the past two decades, the incidence of tuberculosis is in increase with about 2 billion infected individuals (WHO, 2014). This work sorts to add to the available knowledge of the effects anti-tuberculosis drugs have on various physiological systems with specific interest on the hematological parameters and serum protein level. This study was carried out using 24 male wistar rats weighing within the range of 150-200 g. These animals were randomly separated into four groups of eight rats each. One of these groups is the control group (fed with just feed and water) and the other two groups (labeled group1 and group 2) are the experimental groups receiving an administration of 22.5mg/kg and 45mg/kg respectively of the FCD anti tb drug solution used for this study. After 21 days of administration of the drug solution at the specified dosage, blood sample was collected and the sample was analyzed to obtain some hematological parameters and the serum protein (this includes, total protein and serum albumin), then the serum globulin was calculated. Despite the Global effort that have been intensified greatly, especially over the past two decades, the ncidence of tuberculosis is in increase with about 2 billion infected individuals (WHO, 2014). The hematological parameters that were obtained include; RBC count, TWBC count, Hb estimation, PCV and then the hematological indices were calculated using formula given by Ochei & Kolhatkar, The hematological parameters that were obtained include; RBC count, TWBC count, Hb estimation, PCV and then the hematological indices were calculated using formula given by Ochei & Kolhatkar, 2000. The result obtained from sample analysis was statistically analyzed by one SPSS v.20.0. The statistical result was insignificant (p > 0.05) in most of the variables investigated except for the following that were significant (p < 0.05): RBC count for groups 1 and 2 (p 0.008 respectively), MHC of group 2 (p 0.005), MCV of groups 1 and 2 (p 0.008 respectively) and serum protein level of group 2 (p-value= 0.030). 1.1. BACKGROUND This work sorts to add to the available knowledge of tuberculosis drugs have on various physiological systems with specific interest on the matological parameters and serum protein level. This study was carried out using 24 male wistar rats The result obtained from sample analysis was atistically analyzed by one-way ANOVA using SPSS v.20.0. The statistical result was insignificant (p > 0.05) in most of the variables investigated except for the following that were significant (p < 0.05): RBC count for groups 1 and 2 (p-value = 0.000 and 0.008 respectively), MHC of group 2 (p-values= 0.005), MCV of groups 1 and 2 (p-values= 0.001 and 0.008 respectively) and serum protein level of group 2 200 g. These animals were randomly separated into four groups of eight rats each. One of these groups is the control (fed with just feed and water) and the other two groups (labeled group1 and group 2) are the experimental groups receiving an administration of 22.5mg/kg and 45mg/kg respectively of the FCD anti- tb drug solution used for this study. After 21 days of istration of the drug solution at the specified dosage, blood sample was collected and the sample was analyzed to obtain some hematological parameters and the serum protein (this includes, total protein and serum albumin), then the serum globulin Despite the Global effort that have been intensified cially over the past two decades, the incidence of tuberculosis is in increase with about 2 billion infected individuals (WHO, 2014). Despite the Global effort that have been intensified greatly, especially over the past two decades, the incidence of tuberculosis is in increase with about 2 billion infected individuals (WHO, 2014). Tuberculosis is an airborne disease that usually affects the lungs leading to severe coughing, fever, and chest pains (Cosmas & Gagneux, 2009). Tuberculosis was osmas & Gagneux, 2009). Tuberculosis was Tuberculosis is an airborne disease that usually affects the lungs leading to severe coughing, fever, and chest @ IJTSRD | Available Online @ www.ijtsrd.com @ IJTSRD | Available Online @ www.ijtsrd.com | Volume – 2 | Issue – 2 | Jan-Feb 2018 b 2018 Page: 1689
International Journal of Trend in Scientific Research and Development (IJTSRD) ISSN: 2456-6470 declared a global emergency in 1993. In that year an estimated 7–8 million cases and 1.3–1.6 million deaths occurred (WHO, 1993). Till date, the disease still puts a strain on public health, being only second to HIV/AIDS in causing high mortality rates (Fogel, 2015). The disease disproportionately affects the poorest persons in both high-income and developing countries (WHO, 2012). TB is spread most commonly when people with pulmonary TB expel MTB from their lungs (WHO, 2013). The dimension of the problem is largest in sub-Sahara Africa and south East Asia. In 2011, there were 8.7 million new cases of active tuberculosis worldwide (13% of which involved co infection immunodeficiency virus [HIV]) and 1.4 million deaths, including 430,000 deaths among HIV-infected patients (WHO, 2012). In 2013, there were 9.0 million new cases of TB and 1.5 million died from the disease (Ning et al., 2015). The classic clinical features of pulmonary tuberculosis include chronic cough, sputum production, appetite loss, weight loss, fever, night sweats, and hemoptysis (Lawn & Zumla, 2012). Extra pulmonary tuberculosis occurs in 10 to 42% of patients, depending on race or ethnic background, age, presence or absence of underlying disease, genotype of the M. tuberculosis strain, and immune status (Caws et al., 2008). Extra pulmonary tuberculosis can affect any organ in the body, has varied and protean clinical manifestations, and therefore requires a high index of clinical suspicion (Zumla et al., 2013). The single use of anti-TB drug may result in the rapid development of resistance or failure of treatment (WHO, 2003). Therefore, WHO (2010) recommended several regimens available for the treatment of tuberculosis. Typically, the standard anti- TB therapy lasts for six (6) months (Jain et al., 2008) and is divided into two phases (lines) of treatment. The initial treatment of TB with first-line anti-TB medications (rifampicin, isoniazid, ethambutol and pyrazinamide) is to render cases non-infectious and halt cycle of transmission in the community (Ning et al., 2015) and it lasts for two (2) months. Then during the final four (4) months, they continue with rifampin and isoniazid (Zumla et al., 2013). However, this regimen often causes serious adverse drug reactions, which may result in discontinuing the scheduled treatment (Ali, 2012). Adverse effects of anti-TB therapy are potentiated by multiple drug regimens such as HRZE. All these four drugs are potentially hepatotoxic independently, combination their toxic effects are enhanced in a synergistic manner (Ali, 2012). Mycobacteria are agile in developing resistance to single chemotherapeutic agents. As a consequence, effective therapy of mycobacterial infections requires a prolonged course (months to years) of multiple drugs. Issues of patient compliance and drug toxicity are important, as are drug interactions, especially in patients being treated concurrently for HIV and tuberculosis infection (Brunto et al., 2006). Hematology refers to the study of the numbers and morphology of the cellular elements of the blood – the red cells (erythrocytes), white cells (leucocytes), and the platelets (thrombocytes) and the use of these results in the diagnosis and monitoring of disease (Merck Manual, 2012).It has been reported that, ingestion of drugs can alter the normal hematological values (Ajagbonna et al., 1999). They are good indicators of the physiological status of animals (Etim et al., 2014). Therefore, hematological parameters could be an important tool in the assessment of deleterious effect of drugs (Yakubu et al., 2007). Several previous studies have investigated the biological variations of hematologic parameters (Sennels et al., 2011). Some parameters, such as hemoglobin or reticulocytes, have been demonstrated to exhibit hour-to-hour, day-to-day, or seasonal intraindividual fluctuation (Zhang et al., 2013). Hematological abnormalities have been associated with tuberculosis (Al-Omar et al., 2009). Blood plasma proteins play roles in the maintenance of colloid osmotic pressure, as a rapid substitute for indispensable amino acids, assuring glucose through gluconeogenesis, in transport of minerals and hormones, in build of enzymes and immune system in the organism. Therefore, blood plasma proteins have an exceptional significance maintenance. Plasma protein levels display reasonably predictable changes in inflammation, malignancy, infarction, burns, and chemical injury (O’Connell et al., 2005). 1.2. AIM AND OBJECTIVES with the human in homeostasis response trauma, to acute necrosis, Researches have been carried out on the effects of anti- tuberculosis drugs on various physiologic systems (Bulatovic et al., 2002; Awofeso, 2008; Ning et al., 2015) but much have not been mentioned on the when given in @ IJTSRD | Available Online @ www.ijtsrd.com | Volume – 2 | Issue – 2 | Jan-Feb 2018 Page: 1690
International Journal of Trend in Scientific Research and Development (IJTSRD) ISSN: 2456-6470 effect of anti-tuberculosis drugs on the hematological parameters and serum protein level. The specific objectives of this study are to evaluate: The influence of anti-tuberculosis drugs on the hematological parameters. The influence of anti-tuberculosis drugs on the total and differential serum protein level. 1.3. STATEMENT OF PROBLEM antibacterial agents do not penetrate the cell walls of mycobacteria, and a portion of mycobacteria can reside inside macrophages, permeability barrier that effective agents must cross. M. tuberculosis targets macrophages which are important effector cells in the immune system, as its preferred habitat. Whereas resting macrophages fail to harm M. tuberculosis, activated macrophages can control the growth of the microbe, although sterile eradication is seldom achieved. Several different T- cell populations are required for the successful control of the pathogen. This dynamic interplay underlying protection is the reason for the long-term persistence of M. tuberculosis (Atomsa et al., 2014). adding another TB causes about 2 million deaths annually among 2 billion infected individuals (WHO, 2014). A recent report on the incidence in Nigeria shows there is a prevalence rate of 19.5% (Amilo et al., 2013). Nigeria represents a large population (ranking 4th) of nations with most T.B infection incidence and hence users of anti-T.B drugs. 1.4. SIGNIFICANCE OF STUDY Epidemiology There were 8.7 million new cases of active tuberculosis worldwide and 1.4 million deaths in 2011 (WHO, 2012) representing a slight decrease from peak numbers in the mid-2000s. In 2013, there were 9.0 million new cases of TB and 1.5 million died from the disease (Ning et al., 2015). An estimated of 310,000 cases of multidrug-resistant tuberculosis, caused by organisms resistant to at least isoniazid and rifampin, were among patients who were reported to have tuberculosis in 2011. More than 60% of these patients were in China, India, the Russian Federation, Pakistan, and South Africa (Zignol et al., 2012). A total of 84 countries have reported cases of extensively drug-resistant tuberculosis, a subset of multidrug-resistant tuberculosis with added resistance to all fluoroquinolones plus any of the three injectable antituberculosis drugs, kanamycin, amikacin, and capreomycin (Zumla et al., 2013). Sub-Saharan Africa has the highest rates of active tuberculosis per capita, driven primarily by the HIV epidemic (WHO, 2012). The absolute number of cases is highest in Asia, with India and China having the greatest burden of disease globally (WHO, 2012). In the United States and most Western European countries, the majority of cases occur in foreign-born residents and recent immigrants from countries in which tuberculosis is endemic (Abubakar et al., 2011). Tuberculosis infection is in the increase worldwide and especially in Sub-Saharan Africa (Nigeria inclusive). To this effect, WHO have set a goal to eradicate TB infection from the surface of the earth by year, 2050 (WHO, 2010). There is therefore need to investigate the possible state of various systems in the body during and after receiving anti-TB treatment. To this effect, this study is highlighted to evaluate the hematological state, and also the level of serum protein following Anti-TB treatment using animal model. 2.1. Tuberculosis and Anti-tuberculosis Regimen 2.1.1. Tuberculosis In 1882, a German physician and scientist, Robert Koch discovered the Mycobacterium tuberculosis. Entering the 21st century, tuberculosis, the causative agent of tuberculosis (TB), remains a major cause of morbidity and mortality worldwide. TB causes 1.9 million deaths annually among a pool of infected individuals close to 2 billion people (Bulatovic et al., 2002).Tuberculosis is an airborne disease that usually affects the lungs leading to severe coughing, fever, and chest pains (Cosmas & Gagneux, 2009). A number of characteristics of mycobacteria make these diseases chronic and necessitate prolonged treatment. Mycobacteria grow slowly and may be dormant in the host for long periods; thus, they are relatively resistant to the effects of antibiotics (Brunto et al., 2006). Many Mycobacterium Multidrug Resistance Multidrug resistant TB (MDR TB), defined as resistance to at least isoniazid and rifampicin, has been spreading rapidly in recent years. In 2012, 3.6% of newly diagnosed and 20% of retreatment cases was estimated to have MDR TB globally with noticeable geographical variations in prevalence (Seyoum et al., @ IJTSRD | Available Online @ www.ijtsrd.com | Volume – 2 | Issue – 2 | Jan-Feb 2018 Page: 1691
International Journal of Trend in Scientific Research and Development (IJTSRD) ISSN: 2456-6470 2014). Various reports demonstrated that, in Africa, resistance to one or more anti-TB and MDR-TB ranges from 3% to 37.3% (Mitike et al., 1997) and 1.4% to 11.6% (Glynn et al., 2005), respectively. Besides, extensively drug resistant TB (XDR-TB) has been reported by 92 countries and about 9.6% of MDRTB patients have XDRTB globally. Therefore, the rapid spread of MDRTB and XDRTB especially in new TB patients is challenging the effectiveness of TB control programs in many low income countries (Lin et al., 2004). combination, or with other medicines. The single use of drug may result in the rapid development of resistance or failure of treatment. Several regimens are available for the treatment of tuberculosis. Depending on the duration of treatment or in the case of resistance, individual drugs may be omitted from the protocol. Below is a table of available anti-tuberculosis drugs and their year of first usage; Table 2.1: Anti-tuberculosis drugs available 2.1.2. Anti-tuberculosis Regimen Anti-tuberculosis drugs Streptomycin Para-amino salicylate Date first used 1945 1946 The single use of anti-TB drug may result in the rapid development of resistance or failure of treatment (WHO, 2003). Therefore, WHO (2010) recommended several regimens available for the treatment of tuberculosis. In most developing countries, the preferred regimen for successful treatment that prevents acquired resistance and enhances efficacy involves two phases: an initial (or intensive) phase followed by continuation phase. WHO (2010) recommended standard drugs as first line anti- tuberculosis (anti-TB) therapy involved (HRZE): isoniazid (H), rifampicin (R), pyrazinamide (Z) and ethambutol (E) received as a fixed dose combination suspension according to the body weight. However, this regimen often causes serious adverse drug reactions, which may result in discontinuing the scheduled treatment (Ali, 2012). Thiacetazone Isoniazid Pyrazinamide Cycloserine Capreomycin Ethambutol Rifampicin Rifapentine Adopted from: Jain et al., 2008 1946 1952 1952 1955 1960 1963 1967 1999 List Combination (FDC) of WHO-UN Approved Fixed-Dosage rifampicin+ isoniazid: 60mg +30mg dispersible rifampicin+ isoniazid+ 60mg+30mg+150mg dispersible rifampicin +isoniazid: 150mg+75mg tablet rifampicin+ isoniazid+ 150mg+75mg+275mg tablet. rifampicin+ isoniazid+ ethambutol: 150mg+75mg+400mg+275mg tablet. pyrazinamide: Rifampicin has bactericidal activity against M. tuberculosis by inhibiting bacterial DNAdependent RNA polymerase (Houston & Fanning, 1994). Isoniazid is a prodrug activated by bacterial catalase- peroxidase (KatG) and kills actively growing tubercle bacilli by inhibiting the biosynthesis of mycolic acids which are major components of cell wall of M. tuberculosis (Timmins & Deretic, 2006). The other prodrug, pyrazinamid, is activated by bacterial pyrazinamidinase which is only active in acidic conditions (pH: 5.5). The active metabolite is pyrazinoic acid that inhibits fatty acid synthesis in M. tuberculosis (Zimhony et al., 2000). This drug is used in the initial two months of treatment to reduce the duration of therapy, and is not used alone (Eminzade et al., 2008). Ethambutol inhibits the synthesis of some metabolites in actively growing M. tuberculosis, causing impairment of cell metabolism, arrest of multiplication, and cell death (Eminzade et al., 2008). Drugs are not used solely in the treatment of tuberculosis. Instead, the first line drugs are used in ethambutol: pyrazinamide+ Two other FDCs that are available under GDF Quality Assurance policy are: rifampicin+ isoniazid: 60mg+60mg dispersible rifampicin +isoniazid: 150mg+150mg tablet 2.1.2.1. Isoniazid Fig.2.1: Structure of Isoniazid @ IJTSRD | Available Online @ www.ijtsrd.com | Volume – 2 | Issue – 2 | Jan-Feb 2018 Page: 1692
International Journal of Trend in Scientific Research and Development (IJTSRD) ISSN: 2456-6470 Drug mutations occur in the target gene (inhA) and in the activating enzyme KatG. Isoniazid (isonicotinic acid hydrazide, or INH) is the most active drug for the treatment of tuberculosis caused by susceptible strains (Craig & Stitzle, 2004) and is therefore considered the primary drug for the chemotherapy of tuberculosis (Brunto et al., 2006). resistance mechanism: Resistance inhA: Specific mutations in, or over expression of, the target inhA gene generate organisms with increased MICs (Minimal inhibitory concentrations) for INH and ethambutol (ETA), with MICs at least 5 times higher than WT (Vilcheze et al., 2006). KatG: INH is a prodrug activated hemoprotein, KatG. Mutations in the katG gene lead to high-level resistance (200× MIC) and ~50% of INH-resistant clinical isolates carry such a mutation, often S315T (Cohen-Gonsaud et al., 2002). INH- resistant mutants with changes in the genes ahpC (alkyl hydroperoxide reductase), kasA (Mdluli et al., 1996) and ndh (NADH dehydrogenase) have also been observed (Lee et al., 2001). Chemistry Generic and additional names: isonicotinic acid hydrazide; isonicotinylhydrazine; INH; rimitsid; tubazid Molecular formula: C6H7N3O Molecular weight: 137.14 Derivatives: Isoniazid Isoniazid 4- pyridinecarboxylic (sulfomethyl) Isoniazid methanesulfonate sodium (derivative) Formulation and optimal human dosage: 5 mg/kg for adults, 10 - 20 mg/kg for children. Adult dosing generally, 300 mg capsule administered orally, once daily; or 15 mg/kg up to 900 mg/day, two or three times/week, ideally dose administered one hour before or two hours after a meal. Concomitant administration of pyridoxine (B6) recommended for malnourished patients, adolescents, and those predisposed to neuropathy (e.g. diabetic). It can also be given intramuscularly or intravenously [DrugBank]. isonicotinoylhydrazine; by catalaseperoxidase 4- aminosalicylate acid 2- Spectrum of activity: INH is a bactericidal agent active against organisms of the genus Mycobacterium, specifically M. tuberculosis, M. bovis and M. kansasii. INH is bactericidal to rapidly-dividing mycobacteria, but is bacteristatic if the mycobacterium is slow- growing. INH is highly specific, being active against only a subset of the mycobacteria and largely ineffective against other microorganisms; this is in part due to several unusual aspects of metabolism, exemplified in M. tuberculosis, including unusually high KatG activity and a defective drug efflux mechanism (Zhang, 2003). Basic Biology Information Drug target/mechanism: Isoniazid (INH) is a prodrug activated hemoprotein, KatG. INH inhibits InhA, a nicotinamide adenine dinucleotide (NADH)- specific enoyl-acyl reductase involved in fatty acid synthesis. (Vilch`eze et al., 2006) reported that transfer of inhA mutant gene, S94A, into wild-type (WT) Mycobacterium tuberculosis was sufficient to confer resistance to INH and ethambutol (ETA), demonstrating that this is the target for INH. Prior to the above publication some controversy had existed over the precise mode of action of this target, in part due to the difference in the INH susceptibility of M. tuberculosis and M. smegmatis, and the presence of INH conferring mutations in a number of other genes, for example kasA (Mdluli et al., 1996). The crystal structures of M. tuberculosis InhA and the related enzyme MabA are both solved (Cohen-Gonsaud et al., 2002). by catalase-peroxidase Pharmacokinetics : Isoniazid is readily absorbed from the gut and is widely distributed to tissues, including the cerebrospinal fluid (CSF), and into macrophages where it kills intracellular tubercle bacilli. It undergoes acetylation in the liver. The half-life of isoniazid is less than 80 minutes in fast acetylators and more than 140 minutes in slow acetylators. Approximately 50–70% of a dose is excreted in the urine within 24 hours as a metabolite or free drug. Abnormally high and potentially toxic concentrations of isoniazid may occur in patients who are both slow acetylators and have renal impairment. carrier protein (ACP) Drug Interaction: Isoniazid undergoes hepatic metabolism by CYP450s. metabolism of several anticonvulsants, including phenytoin and carbamazepine, causing toxic concentrations of these drugs in some patients (Ritter et al., 2008). It inhibits the @ IJTSRD | Available Online @ www.ijtsrd.com | Volume – 2 | Issue – 2 | Jan-Feb 2018 Page: 1693
International Journal of Trend in Scientific Research and Development (IJTSRD) ISSN: 2456-6470 oSolubility: Freely soluble in chloroform and DMSO; soluble in ethyl acetate, methanol, tetrahydrofuran; slightly soluble in acetone, water, carbon tetrachloride [Merck Index] Adverse Effect: These include; oRestlessness, insomnia and muscle twitching. oSensory peripheral neuropathy, observed more commonly in slow acetylators, and prevented by supplemental pyridoxine. oStability: Very stable in DMSO; rather stable in water [Merck Index]. oBiochemical significant in 1% of patients, and rarely progresses to hepatic necrosis. hepatitis, which is clinically oFormulation and optimal human dosage: 300 mg tablets. Dose 10 mg/kg, in a single daily administration, not to exceed 600 mg/day, oral or intravenously. Rifampicin Basic Biology Information oDrug inhibits the essential rpoB gene product β-subunit of DNA dependent RNA polymerase activity, acting early in transcription (Wehrli et al., 1968). It is thought to bind to the β-subunit, close to the RNA/DNA channel, and physically blocks the transit of the growing RNA chain after 2-3 nucleotides have been added. In Mycobacterium tuberculosis bactericidal action may come from the triggering of apoptosis via activation of the “suicide gene module” mazEF (Engelburg-Kulka et al., 2004). target/mechanism: Rifampicin (RIF) Fig. 2.2: Structure of Rifampicin Rifampicin is a bactericidal antibiotic drug of the rifamycin group. It is a semisynthetic compound derived from streptomyces spp that is used as a first line drug for the treatment of tuberculosis (TB) worldwide (Eminzade et al., 2008). oDrug Interaction: Rifampicin markedly induces a wide range of hepatic microsomal CYP450 enzymes, thereby accelerating the metabolism of many commonly used drugs. Clinically important interactions associated with reduced concentration and therapeutic failure are common, and include: Rifampicin morphological aberrations in the liver due to the fact that the liver is the main detoxifying site for these antitubercular drugs (Santhosh et al., 2007). produces many metabolic and ocorticosteroids; owarfarin; osex unreliable); oimmunosuppressants (including ciclosporin, tacrolimus, sirolimus leading to graft rejection); ooral hypoglycaemic drugs (e.g. glibenclimide, gliburide); oanticonvulsants (phenytoin, carbamazepine); oHIV protease inhibitors. Adverse Effect: Large doses of rifampicin produce toxic effects in about one-third of patients: oafter a few hours influenza- like symptoms, flushing and rashes; oabdominal pain; steroids (rendering oral contraception Chemistry Generic 5,6,9,17,19,21-hexahydroxy-23-methoxy- 2,4,12,16,18,20,22-heptamethyl-8-[N-(4-methyl-1- piperazinyl)formimidoyl]-2,7 (epoxypentadeca[1,11,13]trienimino)naphth b]furan-1,11(2H)-dione-21-acetate; rifaldazine; rifamycin and Additional Names: o[2,1- rifampicin; AMP; R/AMP oMolecular formula: C43H58N4O12 oMolecular weight: 822.94 oDerivatives: Rifapentine, rifalazil, rifabutin @ IJTSRD | Available Online @ www.ijtsrd.com | Volume – 2 | Issue – 2 | Jan-Feb 2018 Page: 1694
International Journal of Trend in Scientific Research and Development (IJTSRD) ISSN: 2456-6470 ohepatotoxicity – hepatitis and cholestatic jaundice. It is important to monitor hepatic transaminases, particularly in patients at high risk of liver dysfunction (e.g. alcoholics). Serious liver damage is uncommon. othrombocytopenia (rare); oUrine and tears become orangey-pink. Ethambutol outer layer. LAM appears to be attached to the cell membrane via phosphatidyl-inositol (Deng et al., 1995). Efficacy in humans: ETH is described as “fourth drug” for empiric treatment of tuberculosis (Peloquin et al., 1999). ETH is used as an adjunct in the treatment of pulmonary tuberculosis especially in cases of suspected drug resistance. ETH should not be used alone due to the real risk of resistant mutants. ETH plus INH or streptomycin (STR) have both been recommended [FDA label]. In a human clinical study in 100 patients ETH appeared to lack sterilizing activity and may inhibit sterilizing activities of other TB drugs at least in the first 14 days of treatment (Jindani et al., 2003). When used as the primary drug in an intermittent regimen ETH-treated patients exhibited a high relapse rate (Mitchison, 2004). Fig 2.3: Structure of Ethambutol This is the D-isomer of ethylenediiminodibutanol. It inhibits some strains of Mycobacterium tuberculosis, but other organisms are completely resistant. Resistance to ethambutol develops slowly and the drug often inhibits strains that are resistant to isoniazid or streptomycin (Ritter et al., 2008). Drug resistance mechanism: Mutations in M. tuberculosis embA or embB resulted in MICs of10 50 mg/ml although embB mutations may be more common (Belanger et al., 1996). One of the most common mutations in M. tuberculosis is Met306 in embB, which is often replaced by isoleucine, leucine or valine (Ramaswamy et al., 2000). Resistance can be transferred through expression of M. tuberculosis ETH- resistant embB gene in a wild-type recipient (Ramaswamy et al. 2000). Mutants in multiple emb genes may have even higher MICs. ETH mutants (~25% in some studies) with no changes in the emb genes have also been identified.4 Stepwise mutations appear to occur, no cross-resistance with other TB agents has been observed [FDA label]. Chemistry Generic and additional names: Ethambutol; (+)-2,2_- (ethylenediimino)di-1- butanol; d- N,N_ bis(1-hydroxymethylpropyl)ethylenediami ne; EMB Molecular formula: C10H24N2O2 Molecular weight: 204.31 Solubility: Dihydrochloride: Soluble in water, DMSO; sparingly soluble in ethanol; difficult to dissolve in acetone and chloroform [Merck Index]. Spectrum of activity: ETH is effective against actively growing microorganisms of the genus Mycobacterium, including M. tuberculosis. Nearly all strains of M. tuberculosis and M. kansasii as well as a number of strains of the M. avium complex (MAC) are sensitive to ETH. Basic Biological Information Drug target/mechanism: It inhibits bacterial cell wall synthesis and is bacteriostatic (Ritter et al., 2008). Ethambutol (ETH) inhibits arabinosyl transferases involved in cell-wall biosynthesis; in Mycobacterium smegmatis two polymers seem to be directly affected, arabinogalactan (AG) and lipoarabinomannan (LAM). AG forms part of the mucolyl-AG peptidoglycan layer which anchors the peptidoglycan layer to the lipid- mycolic acid Animal toxicity: LD50 in mice (g/kg): 2.8 orally [Merck Index]. Oral rat LD50: 4 g/kg. In rhesus monkeys given high doses over several months neurological signs were observed and the severity of these was proportional to drug concentrations in serum [FDA label]. @ IJTSRD | Available Online @ www.ijtsrd.com | Volume – 2 | Issue – 2 | Jan-Feb 2018 Page: 1695
International Journal of Trend in Scientific Research and Development (IJTSRD) ISSN: 2456-6470 Pharmacokinetics: Ethambutol is well absorbed (75–80%) from the intestine. The plasma half-life is five to six hours. Because ethambutol is 80% excreted unchanged in the urine, it is contraindicated in renal failure (Ritter et al., 2008). Chemistry Generic and additional names: Pyrazinamide; pyrazinoic acid amide; pyrazine carboxylamide Molecular formula: C5H5N3O Molecular weight: 123.11 Adverse Effect Derivatives: Mannich bases also active (Sriram et al., 2006). Morphazinamide; pyrazinamide These include: retrobulbar neuritis with scotomata and loss of visual acuity occurs in 10% of patients on high doses. The first signs are loss of red–green perception. Prompt withdrawal of the drug may be followed by recovery. Testing of colour vision and visual fields should precede initiation of high-dose treatment, and the patient should be regularly assessed for visual disturbances; Solubility: Soluble in chloroform, methylene chloride; less soluble in benzene; sparingly soluble in water [Merck Index] Formulation and optimal human dosage: 500 mg tablets available. Dose 20-25 mg/kg daily, or 50-70 mg/kg three times a week. Pyrazinamide is also available as part of fixed dose combinations with other TB drugs such as isoniazid and rifampicin (Rifater is an example). rashes, pruritus and joint pains; nausea and abdominal pain; Basic Biology Information confusion and hallucinations; Drug target/mechanism: The mechanism of action of pyrazinamide (PZA) is poorly understood: pyrazinoic acid (POA), the active moiety of PZA, has been shown to inhibit various functions at acid pH in Mycobacterium tuberculosis (Boshoff et al., 2002). Experimental evidence suggests that PZA diffuses into M. tuberculosis and is converted into POA by pyrazinamidase (PZAase); the in vitro susceptibility of a given strain of the organism corresponds to its PZAase activity. PZAase is also called nicotinamidase and metabolizes both PZA and nicotinamide. Once converted, a portion of the POA exits the cell and, providing the media pH is acidic, on protonation re-enters as protonated POA, which may help to disrupt membrane potential (Zhang & Mitchison 2003). An inefficient efflux system causes protonated POA to diffuse in at a faster rate than the efflux of POA. In fact, resperine an inhibitor of a multidrugresistant efflux pump can sensitize the cells to PZA (Zhang et al., 2003). The accumulation of POA and protonated POA lowers the intracellular pH to a suboptimal level that may inactivate many pathways including fatty acid synthase and membrane transport function. However it is widely accepted that POA may not have a specific target, but rather that cellular acidification causes inhibition of major processes (Zhang & Mitchison, 2003). Weak acids such as benzoic acid, UV and respiratory chain inhibitors (e.g. sodium azide) enhance the action of peripheral neuropathy Pyrazinamide Fig.2.4: Structure of Pyrazinamide Pyrazinamide is a bactericidal drug which is well tolerated as oral therapy. Because of its ability to kill bacteria in the acid intracellular environment of a macrophage, it exerts its main effects in the first two to three months of therapy. Pyrazinamide is most active against slowly or intermittently metabolizing organisms, but is inactive mycobacteria. Resistance to pyrazinamide develops quickly if used as monotherapy. Pyrazinamide should be avoided if there is a history of alcohol abuse, because of the occurrence of hepatitis. against atypical @ IJTSRD | Available Online @ www.ijtsrd.com | Volume – 2 | Issue – 2 | Jan-Feb 2018 Page: 1696
International Journal of Trend in Scientific Research and Development (IJTSRD) ISSN: 2456-6470 hyperuricaemia and gout; PZA (Wade & Zhang, 2006). Continuing studies on individual targets such as the nicotinic acid pathway may lead to alternate proposals. biochemical approximately 5–15% of patients); hepatitis (in Drug resistance mechanism: No target-specific mutants have been isolated to date. PZA-resistant mutations are usually found in the converting enzyme PZAase (Davies et al., 2000). The mutations are unusually throughout the gene, but there are three areas of clustered mutations around amino acids 3-71, 61- 85 and 132- 142 sideroblastic anaemia (rare); hypoglycaemia (uncommon). located, Blood spread and Hematological Parameters Blood Blood consists of a protein-rich fluid known as plasma, in which are suspended cellular elements: white blood cells, red blood cells, and platelets. The normal total circulating blood volume is about 8% of the body weight (5600 ml in a 70-kg man). About 55% of this volume is plasma (Barrett et al., 2010). Blood serves numerous functions, including the transport of respiratory gases, nutritive molecules, metabolic wastes, and hormones (Fox, 2011). (Scorpio et al., 1997). A crystal structure of PZAase is now available from Pyrococcus horikoshii and, although it only shares 37% identity with the M. tuberculosis enzyme, it may help in understanding the PZAase mutations in M. tuberculosis (Du et al., 2001). Labeled PZA accumulates, probably as POA, inside sensitive but not resistant M. tuberculosis, presumably because of the lack of the converting enzyme (Zhang & Mitchison, 2003). A small number of PZA mutations occur outside the pncA gene (coding for PZAase) but these have not been characterized (Scorpio et al., 1997). Components of Blood Plasma: is a straw-colored liquid consisting of water and dissolved solutes. The major solute of the plasma in terms of its concentration is Na +. In addition to Na +, plasma contains many other ions, as well as organic molecules such as metabolites, hormones, enzymes, antibodies, and other proteins. Spectrum of activity: PZA is presumed to be specific for Mycobacterium species, exerting its antibacterial properties under specific conditions (acidic pH). PZAase is widely distributed in bacteria yet efficacy of PZA is limited to M. tuberculosis and few other organisms. All bovine mycobacterial strains lack PZase activity due to a point mutation in the pncA gene (Zhang & Mitchison, 2003). Red Blood Cells: The red blood cells (erythrocytes) carry hemoglobin in the circulation. They are biconcave disks that are manufactured in the bone marrow. In mammals, they lose their nuclei before entering the circulation. Pharmacokinetics: Pyrazinamide is converted by an amidase in the liver to pyrazinoic acid. This then undergoes further xanthineoxidase acid. Pyrazinamide is well absorbed, and has a t1/2 of 11–24 hours. Pyrazinamide and its metabolites are excreted via the kidney, and renal failure necessitates dose reduction. It crosses the blood–brain barrier concentrations almost equal to those in the plasma, and is a drug of first choice in tuberculous meningitis. White Blood Cells: The white blood cells also called Leukocytes are the mobile units of the body’s protective system (Guyton & Hall, 2006). They are formed partially in the bone marrow (granulocytes and monocytes and a few lymphocytes) and partially in the lymph tissue (lymphocytes and plasma cells). After formation, they are transported in the blood to different parts of the body where they are needed. The real value of the white blood cells is that most of them are specifically transported to areas of serious infection and inflammation, thereby providing a rapid and potent defense against infectious agents. metabolism hydroxypyrazinoic by to to achieve CSF Adverse Effect: These include: Platelets: granulated bodies that aggregate at sites of vascular injury. They lack nuclei and are 2–4μm in diameter. There are about 300,000/μL of circulating blood, and Platelets (thrombocytes) are small, flushing, rash and photosensitivity; nausea, anorexia and vomiting; @ IJTSRD | Available Online @ www.ijtsrd.com | Volume – 2 | Issue – 2 | Jan-Feb 2018 Page: 1697
International Journal of Trend in Scientific Research and Development (IJTSRD) ISSN: 2456-6470 they normally have a half-life of about 4 days. The megakaryocytes, giant cells in the bone marrow, form platelets by pinching off bits of cytoplasm and extruding them into the circulation. Thrombocytes have been described as the most abundant blood cells after erythrocytes (Vazques & Guerrero, 2007). Differential white blood cell count (WBC-D): WBC-D, also known as leukocyte numerical parameters, has been widely accepted and used by clinicians and is generally considered to yield clinically useful information in health and disease state (Xu, 2015). Hematological Parameters Hematology refers to the study of the numbers and morphology of the cellular elements of the blood – the red cells (erythrocytes), white cells (leucocytes), (thrombocytes) and the use of these results in the diagnosis and monitoring of disease (Merck Manual, 2012). Hematological parameters that are related to the blood and blood forming organs (Bamishaiye et al., 2009). Blood act as a pathological reflector of the status of exposed animals to toxicant and other conditions (Olafedehan et al., 2010). Hematological parameters are good indicators of the physiological status of animals (Etim et al., 2014). Hematological parameters such as red (RBC) and white blood cell (WBC) counts and hemoglobin (Hb) concentration are tightly regulated traits with high clinical relevance. Values outside normal ranges are diagnostic for disorders, including cancer, immune diseases, and cardiovascular disease (Lin et al., 2007). Packed Cell Volume (PCV): Packed cell volume (PCV) is the proportion of blood occupied by RBCs, expressed in percentage. It is the volume of RBCs packed at the bottom of a hematocrit tube when the blood is centrifuged Sembulingam, 2012). and the platelets (Sembulingam & parameters are those Hemoglobin concentration: the purpose of estimating hemoglobin is to determine the oxygen carrying capacity of the blood (Ochei & Kolhatkar, 2000). The results help in detecting diseases which cause deficiency or excess of hemoglobin. Mean Cell Volume (MCV): MCV is the average volume of a single RBC and it is expressed in cubic microns (cu μ). Normal MCV is 90 cu μ (78 to 90 cu μ). When MCV is normal, the RBC is called normocyte. When MCV increases, the cell is known as a macrocyte and when it decreases, the cell is called microcyte. In pernicious anemia and megaloblastic anemia, the RBCs are macrocytic in nature. In iron deficiency anemia the RBCs are microcytic (Sembulingam & Sembulingam, 2012). Evaluation determination of the total erythrocyte count (RBC), total white blood cell count (WBC), hematocrit (PCV), hemoglobin concentration (Hb), erythrocyte indices (MCV, MCH, MCHC), white blood cell differential count and the evaluation of stained peripheral blood films (Campbell, 2004). of the hemogram involves the Mean Corpuscular Hemoglobin (MCH): this indicates the weight of hemoglobin in a single red blood cell and is expressed in pictograms. Red blood Cell Count (RBC): Increase in the RBC count is known as polycythemia. It occurs in both physiological and pathological conditions (Sembulingam & Sembulingam, 2012). Decrease in RBC count occurs in the following physiological Conditions; pressures, during sleep, pregnancy. Mean Corpuscular Hemoglobin Concentration (MCHC): this denotes the concentration per 100ml of packed red. hemoglobin PLASMA/SERUM PROTEINS High barometric Plasma proteins constitute 7% to 9% of the plasma (Fox, 2011). The three types of proteins are albumins, globulins, and fibrinogen. Albumins account for most (60% to 80%) of the plasma proteins and are the smallest in size. They are produced by the liver and provide the osmotic pressure needed to draw water from the surrounding tissue fluid into the capillaries. This action is needed to maintain blood volume and pressure. Globulins are grouped into three subtypes: alpha globulins, beta globulins, and gamma globulins. The alpha and beta globulins are produced Total White blood Cell Count (WBC): Leukocytosis is the increase in total WBC count. Leukocytosis occurs in both physiological and pathological conditions. Leukopenia is the decrease in total WBC count. The term leukopenia is generally used for pathological conditions only (Sembulingam & Sembulingam, 2012). @ IJTSRD | Available Online @ www.ijtsrd.com | Volume – 2 | Issue – 2 | Jan-Feb 2018 Page: 1698
International Journal of Trend in Scientific Research and Development (IJTSRD) ISSN: 2456-6470 by the liver and function in transporting lipids and fat- soluble vitamins. Gamma globulins are antibodies produced by lymphocytes (one of the formed elements found in blood and lymphoid tissues) and function in immunity. Fibrinogen, which accounts for only about 4% of the total plasma proteins, is an important clotting factor produced by the liver (Fox, 2011). During the process of clot formation (described later in this section), fibrinogen is converted into insoluble threads of fibrin. Thus, the fluid from clotted blood, called serum, does not contain fibrinogen but is otherwise identical to plasma. nutritional disorders. Elevated levels of total protein can indicate dehydration, infection, cancer and Waldenstroms’s disease. Low levels are associated with liver disease, glomerulonephritis, malnutrition and Nephrotic Syndrome. Serum Albumin Serum albumin is an abundant multifunctional non- glycosylated, negatively charged plasma protein, with ascribed ligand- binding and transport properties, antioxidant functions, and enzymatic activities (Quinlan et al., 2005). It is the most abundant protein found in plasma from midgestation until death, accounting for approximately one half the plasma protein mass (Burtis et al., 2013). Approximately, 60% of the total body albumin is in the extravascular space and it has no carbohydrate side chains but is highly soluble in water due to its high net negative charge at physiological pH (Burtis et al., 2013). Serum is the clear straw-colored fluid that oozes from blood clot. When the blood is shed or collected in a container, it clots. In this process, the fibrinogen is converted into fibrin and the blood cells are trapped in this fibrin forming the blood clot. After about 45 minutes, serum oozes out of the blood clot (Sembulingam & Sembulingam, measurement of protein is done on serum, which is the fluid that remains after plasma has clotted, thus removing fibrinogen and most clotting factors. Serum protein is involved in the maintenance of water between the blood and tissues through osmotic pressure (Faulkner & Meites, 1982). Serum Globulin 2012). The The globulin fraction includes hundreds of serum proteins including carrier complement, and immunoglobulins (Walker et al., 1990). Most of these are synthesized in the liver, although the immunoglobulins are synthesized by plasma cells. Globulins are divided into four groups by electrophoresis. The four fractions are α1, α2, β and γ, depending on their migratory pattern between the anode and the cathode. Increases in the globulin fraction usually result from an increase in immunoglobulins, but there can be an increase in other proteins in pathologic states that have characteristic electrophoretic pattern. proteins, enzymes, Total Protein Total protein is a biochemical test for measuring the total amount of protein in blood plasma or serum. Total protein test measures the total amount of two classes of proteins found in the fluid portion of your blood; albumin and globulin. Proteins are important parts of all cells and tissues. For example, albumin helps prevent fluid from leaking out of blood vessels. Globulins are important part of your immune system. CHAPTER 3 MATERIALS AND METHODS The test is often done to diagnose nutritional problems: kidney disease or liver disease. If total protein is abnormal further test must be done to identify the specific problem. The reference range for total protein is 60- 85mg/dl or 6 – 8.5g/dl. Concentrations below the reference range usually reflect a low albumin concentration, for instance in liver disease or acute infection. Concentrations above reference range are found in Paraproteinaenia, Hodgken’s lymphoma or leukaemia. Animals Adult male wistar rats (Rattus norvegicus) weighing 120-180g were purchased from an animal farm in Enugu, Nigeria and kept to acclimatize for period of thirty (30) days. The animals were housed in the animal house of Nnamdi Azikiwe University College of Health Sciences, Okofia, Nnewi, Nigeria. In the animal house the animals were housed in a well aerated plastic cage, fed with a standard animal feed (Top feed Nigeria Limited) and supplied with clean drinking water ad libitum. The guidelines of National Institute of Health (NIH) for the care of laboratory animals were properly adhered to. Clinical Significance: Total Protein test measures the total amount of protein in the biood. Measurements obtained by this method are used in the diagnosis and treatment of a variety of diseases involving the liver, kidney and bone marrow as well as other metabolic or @ IJTSRD | Available Online @ www.ijtsrd.com | Volume – 2 | Issue – 2 | Jan-Feb 2018 Page: 1699
International Journal of Trend in Scientific Research and Development (IJTSRD) ISSN: 2456-6470 B.Group 2: First experimental group administered with high dosage (45 mg/kg b.wt.) of drug solution orally for twenty one (21) days. C.Group 3: Second experimental group administered with low dosage (22.5 mg/kg b.wt.) of drug solution orally for twenty one (21) days. The dosage was adjusted every week according to any change in body weight to maintain similar dose per kg body weight of rat over the entire period of the experiment. Preparation of Stock Solution The tablets of the anti-T.B regimen mention above were ground into fine powder. Using a micro-scale weighing balance 1g of the powdered drugs was mixed in 50ml of water. The concentration of the above solution is 20mg/ml. Collection of Sample Blood samples were collected from the animals through both cardiac and ocular puncture. Cardiac puncture was carried out using syringe and needle while ocular puncture was done using capillary tubes. The blood sample from each animal was emptied partly into an EDTA bottle and partly into a plain bottle. Before the sample collection the animals were anesthetized using chloroform. Estimation of Hematological Parameters The following haematologic parameters were carried out on EDTA anticoagulated blood samples collected from the animals: Red blood cell (RBC) count, Hemoglobin (Hb) estimation, Packed Cell Volume (PCV), Total white blood cell (TWBC) count, Differential white blood cell count; neutrophils, lymphocytes, eosinophils, monocytes and basophils. Mean cell volume (MCV), mean corpuscular hemoglobin (MCH) and hemoglobin concentration (MCHC) were calculated as outlined in Ochei and Kolhatkar (2000). All the experiments were done using the methods described by Ochei and Kolhatkar (2000). RED BLOOD CELL COUNT Red blood cell count was done using hemocytometer method. Procedure: Using the RBC Thoma pipette, mixed blood was aspirated into the capillary tube of the pipette slightly above the point marked 0.5. Equipments Plastic cage Feeding trough water container Syringe and needle Cannula Plastic bottle Electronic weighing balance EDTA (Ethylene Diamine Tetra Acetate) bottle Plain bottle Hand gloves Test tubes Capillary tubes Plasticine Micro-hematocrit centrifuge Hematocrit reader Hemacytometer Cotton gauze Microscope Dissection kit Pipette Spectrophotometer Timer Drugs and Chemicals A.A card of Fixed Dose Combination (FDC) of anti- tuberculosis drugs (manufactured by Sandoz Private Limited, India) was purchased from a pharmaceutical shop in Onitsha, Anambra State Nigeria. Each tablet of the FDC contains: Rifampicin (150 mg), Pyrazinamide (400mg) Hydrochloride (275mg). Isoniazid and (75mg), Ethambuthol B.Drabkin’s reagent (KCN/L) C.Chloroform D.RBC diluent (Hayen’s fluid) E.WBC-diluting fluid F.Leishman’s stain G.Total protein reagent H.Total protein standard I.Normal saline Experimental Design Twenty four (24) experimental animals were divided into three (3) groups of eight (8) rats each as detailed below: A.Group 1: Normal control rats (fed with normal diet). mean corpuscular @ IJTSRD | Available Online @ www.ijtsrd.com | Volume – 2 | Issue – 2 | Jan-Feb 2018 Page: 1700
International Journal of Trend in Scientific Research and Development (IJTSRD) ISSN: 2456-6470 The outside of the pipette was wiped off using gauze and the content of the pipette was adjusted to exactly the point of 0.5 mark by tapping the tip of the pipette with gloved finger. The pipette was held horizontally and the dipped into the diluting fluid. Using a careful but constant suction, the diluting fluid was drawn into the pipette to reach the top mark above the bulb. The pipette was then removed from the diluting fluid and held horizontally. The pipette was held in the horizontal position in between the thumb and the middle finger covering both ends with either the thumb or the middle finger. A clean neubauer counting chamber was brought and properly covered using the cover slip. The tip of the pipette containing the well mixed blood was the placed at the edge of the covered counting chamber and the blood flowed in by the process of capillary action. Before placing on the microscope the counting chamber was allowed to rest for about a minute or two so the fluid will be evenly distributed. Then it was viewed 40× objective magnification, the central square of five squares was viewed and it is yet divided into 5 squares 1 mm2. The cells in the 5 1mm2 squares at 40× objective magnification were counted. Calculations was then done with: The outside of the pipette was wiped off using gauze and the content of the pipette was adjusted to exactly the point of 0.5 mark by tapping the tip of the pipette with gloved finger. The pipette was held horizontally and the dipped into the diluting fluid. Using a careful but constant suction, the diluting fluid was drawn into the pipette to reach the top mark (11.0 mark) above the bulb. The pipette was then removed from the diluting fluid and held horizontally. The pipette was held in the horizontal position in between the thumb and the middle finger covering both ends with either the thumb or the middle finger. A clean neubauer counting chamber was brought and properly covered using the cover slip. The tip of the pipette containing the well mixed blood was the placed at the edge of the covered counting chamber and the blood flowed in by the process of capillary action. Before placing on the microscope the counting chamber was allowed to rest for about a minute or two so the fluid will be evenly distributed. The counting chamber was then properly mounted on the microscope and the counting chamber is viewed at 10× objective magnification. At this magnification 5 squares were seen (4 at the edges and 1 at the center) but the 4 squares the edges were used to the TWBC count. Each of these cells has an area of 4mm2 and the cells in each of these squares were counted. After the counting the cells contained in each of the 4 squares, calculations were done thus: DIFFERENTIAL WHITE BLOOD CELL COUNT The procedure described by ochei and kolhatkar (2000) was used for this experiment. Procedure: A small drop of EDTA anticoagulated blood, about 2 mm in diameter, about 1 cm from the end of the slide was place on a clean dry slide. TOTAL COUNT WHITE BLOOD CELL The total white blood cell count was done manually using the hemocytometer method. Procedure: Using the WBC Thoma pipette, mixed blood was aspirated into the capillary tube of the pipette slightly above the point marked 0.5. @ IJTSRD | Available Online @ www.ijtsrd.com | Volume – 2 | Issue – 2 | Jan-Feb 2018 Page: 1701
International Journal of Trend in Scientific Research and Development (IJTSRD) ISSN: 2456-6470 The slide was then held firmly to the opposite direction by the thumb and fore finger and then kept on the laboratory bench. One end of the capillary tubes was sealed with plasticine. The filled tubes were then placed in the microhematocrit centrifuge and spun for 5 minutes at 12,000g. A second slide was then placed on the drop and held there until the blood has spread across it and it was then drawn slowly over the length of the first slide, being held at an angle of 450. The spun tubes were then place in a hematocrit reader and the PCV values were recorded. 3.7.5. HEMOGLOBIN CONCENTRATION The blood smear formed was allowed to air dry. The Hb concentration was estimated using the cyanmethemoglobin method The blood smear was then covered completely with Leishman stain and allowed to rest for about 2 minutes. Procedure: 0.02 ml of blood was added to 5 ml of Drabkin’s solution in a test tube. After the 2 minutes the stain was diluted with about twice its quantity of distilled water after which the slide was left for about 10 minutes. This was done using a pipette until the slide was almost flooded. The contents of the test tube were well mixed and allowed to stand for 10 minutes. The slide was then washed with water from a slow running tap after which the slide was left to air dry. The absorbance was read colorimetrically, using the black drabkin’s solution to zero the colorimeter. The slide containing the blood smear was then mounted on the microscope for observation. The absorbance of the standard was also read in the same way. The Hb concentration was then calculated thus: The blood smear was observed using a low power (10×) magnification so as to identify a counting area, where the cell are clearly separated and well distributed. reading of test × reading of standard 100 white blood cells of different types were counted form 5 different counting areas of the blood smear, using the morphological appearance of the different types of white blood cells as a guide. concentration of standard 4 3.7.6 RED BLOOD CELL INDICIES The three RBC Indices were calculated with formulars enumerated below: The number of each type of white blood counted was then recorded as the percentage of that type of white blood cell present in the smear. PACKED CELL VOLUME (PCV) The Microhematocrit Method. PCV was estimated by the Procedure: Plain capillary tubes were used to collect EDTA anticoagulated blood to two third full of the tubes. @ IJTSRD | Available Online @ www.ijtsrd.com | Volume – 2 | Issue – 2 | Jan-Feb 2018 Page: 1702
International Journal of Trend in Scientific Research and Development (IJTSRD) ISSN: 2456-6470 The contents of the test tubes were mixed well and allowed to stand for 10 minutes at room temperature. The absorbance was read at 640 nm(red filter), setting the zero with blank. The calculation of serum albumin(g/dl) was done using the formula: 3.8. PROTEIN LEVEL ESTIMATION OF SERUM The methods used for estimating the serum protein level was as stated by Ochei and Kolhatkar (2000). 3.8.1 TOTAL SERUM PROTEIN The Biuret method was used total serum protein. for the estimation of Procedure: The blood sample for this test was collected using a plain bottle, so that at the event of coagulation serum can be collected. 5 test tubes labeled A, B, C, D, and E (for easy identification) was set up for this experiment. 5.0 ml working biuret reagent and 0.05 ml of serum was put into test tube A. 0.05 ml of serum and 5.0 ml of tartarate iodide solution was put into test tube B. Test tube C contained 5.0 ml of working biuret reagent and 0.05 ml of standard protein. Test tube D contained 5.0 ml of tartarate iodide solution and 0.05 ml of standard protein. Test tube E contained 5.0 ml of working solution and 0.05 ml of distilled water. The contents of the individual test tubes were mixed well and left at room temperature for 10 minutes. After the 10 minutes the absorbance (Ab) was read at 540 nm, setting the zero with the blank. The total protein (g/dl) was calculated thus: 3.8.3. SERUM GLOBULIN The Serum globulin level was gotten by subtracting the value of Serum albumin level from the Total serum protein level. CHAPTER 4 RESULTS At the end of the experiment, the results obtained were presented below. 4.1. Effect of Anti-tuberculosis Regimen on Hematological Parameters 4.1.1. Effect on Red blood corpuscle (RBC) There was a significant (p < 0.05) increase of 59.52% (326.75 ± 11.90) and 41.03% (288.88 ± 24.11) in group two and group three respectively when compared to group one (control) (204.83 ± 20.36). Table 4.1: Effect of Anti-Tb regimen on RBC Count Groups N RBC (million/ cu mm) Mean ± SEM GROUP 1 (CONTROL) GROUP 2 6 204.83 ± 20.36 8 326.75 ± 11.90 3.8.2. SERUM ALBUMIN The Bromocresol Green (BCG) method was used for estimating the serum albumin level. Procedure: GROUP 3 8 288.88 ± 24.11 Three test tubes A, B and C were set up for the experiment. Test tube A contained 5.0 ml of BCG reagent and 0.05 ml of serum. Test tube B contained 5.0 ml of BCG reagent and 0.05 ml of albumin standard. Test tube C contained 5.0 ml of blank reagent and 0.05 ml of distilled water. @ IJTSRD | Available Online @ www.ijtsrd.com | Volume – 2 | Issue – 2 | Jan-Feb 2018 Page: 1703
International Journal of Trend in Scientific Research and Development (IJTSRD) ISSN: 2456-6470 Fig 4.2: Shows Effect of Anti-Tb Regimen on TWBC Count N= 22; *= P< 0.05 4.1.3: Effect on Differential White Blood Cell Count Fig. 4.1: Shows Effect of Anti-Tb Regimen on RBC Count. 4.1.3.1: Neutrophil Group two recorded a 6.45% decrease when compared to the control group whereas group three recorded a 40.32% increase when compared to the control group, though these changes are insignificant (p > 0.05). N= 22; *= P< 0.05 4.1.2 : Effect on Total White Blood Cell (TWBC) Count Group two had a 10.88% increase of TWBC when compared to the group one(control), whereas group three recorded a 9.9 % decrease. But, the increase and decrease of TWBC recorded by groups two and three respectively are both non significant (p > 0.05). 4.1.3.2: Eosinophil There were 200% and 150% increases respectively of groups two and three compared to the control group. Though these increase insignificant (p > 0.05). are both statistically Table 4.2: Effect of Anti-Tb Regimen on TWBC Count 4.1.3.3: Lymphocytes TWBC (billion/L) Groups N There were 0.32% and 5.85% insignificant (p > 0.05) increases in groups two and three respectively when compared to the control group. Mean ± SEM GROUP1 (CONTROL) 6 12.22 ± 2.24 4.1.3.4: Monocytes GROUP 2 8 13.55 ± 2.09 Groups two and three recorded a 2.6% and 47.4% increase and decrease respectively, though these changes were statistically insignificant (p > 0.05). GROUP 3 8 11.01 ± 1.53 @ IJTSRD | Available Online @ www.ijtsrd.com | Volume – 2 | Issue – 2 | Jan-Feb 2018 Page: 1704
International Journal of Trend in Scientific Research and Development (IJTSRD) ISSN: 2456-6470 Table 4.3: Effect of anti-tb regimen on D-WBC Count GRO UPS N DIFFERENTIAL WBC EOSI NOP HIL (%) MEAN ± SEM NEUT ROPH IL (%) MEAN ± SEM LYMP HOCY TES (%) MEAN ± SEM MON OCYT ES (%) MEAN ± SEM GROUP 1 (CONTROL) GROUP 2 GROUP 3 6 15.50 ± 1.31 0.50 ± 0.34 79.00 ± 2.92 5.00 ± 1.71 8 8 14.50 ±1.13 21.75 ± 3.26 1.50 ± 0.50 1.25 ± 0.59 78.75 ± 1.31 74.38 ± 3.36 5.13 ± 1.71 2.63 ± 0.78 Fig. 4.4: shows Effect of Anti-Tb Regimen on PCV N= 22; *= P< 0.05 4.1.5: Effect on Hemoglobin (Hb) Concentration There was a 4.69% increase in group two and 2.85% increase in group three when respectively compared to the control group. But these increase in Hb estimation recorded in group two and group three are both no significant (p > 0.05). Table 4.5: Effect of Anti-Tb Regimen on Hb Estimation Fig. 4.3: shows the effect of anti-tb regimen on differential white blood cell count N= 22; *= P< 0.05 4.1.4: Effect on Packed Cell Volume (PCV) There were insignificant (P > 0.05) 2.11% and 3.05% decreases in the PCV of groups two and three respectively. Table 4.4: Effect of Anti-Tb Regimen on PCV GROUPS N PCV (L/L) Mean ± SEM Groups N Hb GROUP 1 (CONTROL) GROUP 2 6 0.3933 ± 0.0099 Estimation 8 0.3850 ± 0.0085 Mean ± SEM GROUP 3 8 0.3813 ± 0.0092 6 GROUP 1 (CONTROL) 11.95 ± 0.41 GROUP 2 8 12.51 ± 0.16 GROUP 3 8 12.29 ± 0.50 @ IJTSRD | Available Online @ www.ijtsrd.com | Volume – 2 | Issue – 2 | Jan-Feb 2018 Page: 1705
International Journal of Trend in Scientific Research and Development (IJTSRD) ISSN: 2456-6470 N= 22; *= P< 0.05 4.1.7: Effect on Mean Corpuscular Hemoglobin Concentration (MCHC) There were 8.45 % and 6.61% insignificant (p >0.05) increases in the MCHC of groups two and three when compared to the control group. Table 4.7: Effect of Anti-Tb Regimen on MCHC Groups N MCH (pg/cell) Fig. 4.5: Shows the effect of Anti-Tb Regimen on Mean ± SEM Hb estimation. GROUP 1 (CONTROL) 6 30.41 ± 0.96 N= 22; *= P< 0.05 GROUP 2 8 32.98 ± 1.01 4.6: Effect on Mean Corpuscular Hemoglobin (MCH) GROUP 3 8 32.42 ± 1.49 The calculation of the MCH showed that there was a 25.81% insignificant (p > 0.05) decrease in group two and 38.71% significant (p < 0.05) decrease in group three when compared to the control group respectively. Table 4.6: Effect of Anti-Tb Regimen on MCH Groups N MCH (pg/cell) Mean ± SEM 6 GROUP 1 (CONTROL) 0.62 ± 0.083 8 GROUP 2 0.46 ± 0.052 Fig. 4.7: Shows the effect of anti-tb regimen on MCHC. GROUP 3 8 0.38 ± 0.023 N= 22; *= P< 0.05 4.1.8: Effect on Mean Corpuscular Volume (MCV) There were 41.67 % and 31.86 % decreases in the MCV of groups two and three respectively when compared to the control group. These decreases were both significant (p < 0.05). Fig. 4.6: Shows the effect of Anti-Tb regimen on MCH @ IJTSRD | Available Online @ www.ijtsrd.com | Volume – 2 | Issue – 2 | Jan-Feb 2018 Page: 1706
International Journal of Trend in Scientific Research and Development (IJTSRD) ISSN: 2456-6470 Table 4.8: Effect of Anti-Tb Regimen on MCV Groups N MCH (pg/cell) Mean ± SEM GROUP 1 (CONTROL) 6 2.04 ± 0.26 GROUP 2 8 1.19 ± 0.05 GROUP 3 8 1.39 ± 0.13 Table 4.9: Effects of Anti-Tb Regimen on Serum Protein Level * Groups N Total Prot ein Serum Albu min Serum Globu lin (g/L) (g/L) (g/L) Mean ± SEM Mean ± SEM Mean ± SEM GROUP 1 6 58.50 ± 34.83 23.67 1.09 ± 0.79 ± 0.76 (CONTROL) GROUP 2 8 59.88 ± 1.54 36.25 ± 0.92 23.63 ± 1.05 Fig. 4.8: Shows the effect of anti-tb regimen on the MCV N= 22; *= P< 0.05 4.4.2: Effect of Anti – tuberculosis Regimen on Serum Protein Level There were 2.36% and 3.42% insignificant (p> 0.05) increases in the total protein level of groups two and three when compared to the control group. Also groups two and three recorded 4.08% insignificant (p >0.05) increase and 7.67% significant (p < 0.05) increase respectively in their albumin level. In contrast, groups two and three recorded 0.17% and 2.83% insignificant (p > 0.05) decreases in the level of globulin when compared with the control group. GROUP 3 8 60.50 ± 0.66 37.50 ± 0.57 23.00 ± 0.91 Fig. 4.9: Shows the effect of anti-tb regimen on serum protein level. @ IJTSRD | Available Online @ www.ijtsrd.com | Volume – 2 | Issue – 2 | Jan-Feb 2018 Page: 1707
International Journal of Trend in Scientific Research and Development (IJTSRD) ISSN: 2456-6470 indices (Molecular corpuscular hemoglobin (MCH), Molecular corpuscular hemoglobin concentration (MCHC), and Molecular cell volume (MCV)). Then, the levels of the serum total protein, albumin and globulin were also estimated. When taking a closer look at concurrent therapy of antibiotics, a defined drop in WBC count is therefore expected ( Demler, 2011) but there were no significant changes in the total and differential WBC counts, though the duration of study might have contributed to this. The RBC count showed a significant increase for the two experimental groups when compared to the control group and this is contrary to the expected outcome of bone marrow suppression which was reported as an adverse effect of the usage of rifampicin (Ritter et al., 2008). Though there is a possibility that this effect of bone marrow suppression and the resultant suppression of formation of blood cellular elements can occur at a higher dosage of rifampicin (a constituent of the administered FDC anti-tb regimen) and possibly prolonged duration because: N= 22; *= P< 0.05 5.1: Discussion Till date, tuberculosis still puts a strain on public health, being only second to HIV/AIDS in causing high mortality rates (Fogel, 2015). The absolute number of cases is highest in Asia but Sub-Saharan Africa has the highest rates of active tuberculosis per capita, driven primarily by the HIV epidemic (WHO, 2012). A recent report on the incidence in Nigeria shows there is a prevalence rate of 19.5% (Amilo et al., 2013), and Nigeria ranked the fourth country with highest tuberculosis burden amongst 22 high- burdened tuberculosis nations (Olarewaju et al., 2014) . To this effects WHO is making all effort to eradicate tuberculosis infection from the surface of the earth by year 2050 (WHO, 2010), hence a great effort is being put into the production of drugs and formulation of regimens that will aid this objective. Amongst the available and WHO recommended regimens are: rifampicin+ isoniazid: 60mg +30mg dispersible rifampicin+ isoniazid+ 60mg+30mg+150mg dispersible rifampicin +isoniazid: 150mg+75mg tablet rifampicin+ isoniazid+ 150mg+75mg+275mg tablet. rifampicin+ isoniazid+ ethambutol: 150mg+75mg+400mg+275mg tablet. Sequel to the formulation of these regimens, research works (Bulatovic et al., 2002; Awofeso, 2008; Ning et al., 2015) have been carried out to investigate the possible effects these drugs might have on various physiological systems. In this present study, a fixed-combination dosage anti- tuberculosis regimen (rifampicin + isoniazid + pyrazinamide + ethambutol: 150mg + 75mg + 400mg + 275mg) was administered orally at two different dosage to the experimental animals and its effect on the hematological parameters and serum protein level was investigated. The hematological parameters investigated included; Red blood cell count (RBC), Total White blood cell count (TWBC), Differential White blood cell (neutrophils, eosinophils, monocytes) counts, Packed cell volume (PCV), hemoglobin estimation (Hb) and Hematological pyrazinamide: Firstly, a look at the fig. 4.2 shows that even though the RBC of groups 2 significantly against the control group, the increase in group 3 which was given a higher dosage of the drugs (45 mg/kg) decreased when compared to group 2( administered 22.5 mg/kg of drugs). Secondly, fig. 4.3 shows a decrease in the TWBC of groups 2 and 3 when compared to the control group inasmuch as these decreases were insignificant. and increased ethambutol: pyrazinamide+ The significant decreases in the MCV of groups 2 and 3 when compared to the control group whereas only group 3 had a significant increase in the MCH. The reason for the changes above can be attributed to the increase in the RBC count. hematological indices calculated showed There were no significant changes in the levels of the serum proteins except for the level of serum albumin of group 3, where a significant increase was recorded when compared against group 1(control). The major factor that leads to increased albumin level is acute dehydration and it is said to have no clinical significance (Burtis et al., 2013). lymphocytes and @ IJTSRD | Available Online @ www.ijtsrd.com | Volume – 2 | Issue – 2 | Jan-Feb 2018 Page: 1708
International Journal of Trend in Scientific Research and Development (IJTSRD) ISSN: 2456-6470 Onyenekwe C, Ifeanyi Chukwu M.(2013). Haematologic Indices in Pulmonary Tuberculosis with or without HIV Co-Infection in South Eastern Nigeria. Advances in life sciences and technology. 11(1). 5. 2: CONCLUSION The FDC anti-tuberculosis regimen used in this present study has shown no significant effect on the White blood cell count or on the red blood cell parameters except the increased RBC count. Though, when the changes in the RBC count of the groups 2 and 3 are compared it is observed that there is a significant reduction in the group (group 3) administered with the higher dosage (45 mg/kg) of the anti-tuberculosis drugs. With this I believe that at a higher dosage or prolonged period of administration (of anti- tuberculosis drugs), beyond what was used for this present study the RBC count might record a decrease. The increase in the serum albumin concentration of experimental animals following the administration of 45 mg/kg of anti-tuberculosis drugs might be an indicator that the drugs lead to dehydration. 7)Atomsa D, Abebe G, Sewunet T. (2014). Immunological markers parameters among newly diagnosed tuberculosis patients at Jimma University Specialist Hospital. Ethio J. health. 24(4):311-318. and hematological 8)Awofeso N. (2008). Anti-tuberculosis medication side – effects constituent major factors for poor adherence to tuberculosis treatment. Bull Word Health Organ. 86(6). 9)Bamishaiye, E. I., Muhammad, N. O., & Bamishaiye, O. M. (2009). Haematological parameters of albino rats fed on tigernuts (Cyperus esculentus) tuber oil meal- based diet. The International Journal of Nutrition and Wellness, 10(1). 5.3: RECOMMENDATION The treatment of tuberculosis infection in human lasts for a minimum of 6 months but this study lasted for only a period of 28 days; I recommend therefore that this same study be carried at a longer duration because duration of study might have played a significant role in the results obtained. 10)Barrett K, Brooks H, Boitano S, Barman S. (2010). Ganong’s Review of Medical Physiology. 23rd ed. 11)Belanger A.E, Besra G.S, Ford M.E, Mikusiva K, Belisle J.T, Brennan P.J, Inamine J.M. (1996). The embAB genes of Mycobacterium avium encode an arabinosyl transferase involved in cell wall arabinan biosynthesis that is the target for the antimycobacterial drug ethambutol. Proc Natl Acad Sci USA 93, 11919 24. REFERENCES 1)Abubakar I, Lipman M, Anderson C, Davies P, Zumla A. (2011).Tuberculosis in the UK —time to regain control. BMJ; 343:d4281. 2)Aderemi O.K, Oluwatosin A. (2015). Biochemical changes in blood and tissues of Wistar rats following administration of anti-tuberculosis drugs. Afr. J. Biochem. Res. 9(4): 67-72. 12)Boshoff H.I, Mizrahi V, Barry C.E,III. (2002). Effects of pyrazinamide on fatty acid synthesis by whole mycobacterial cells and purified fatty acid synthase I. J Bacteriol 184, 2167 72. 3)Ajagbonna O.P, Onifade K.I, Suleiman U. (1999).Hematological and biochemical changes in rats given extract of Calotropis procera. Sokoto J Vet Sci. 1:36-42. 13)Brunto L, Lazo J, Parker K. (eds). (2006). The pharmacological basis of therapeutics. 11th ed. 10(3). 14)Bulatovic V, Wengenack N, Uhl J, Hall L, Roberts G, Cockerill R. III, Rusnak F. (2002). Oxidative stress increases susceptibility of mycobacterium tuberculosis Antimicrob. Agents Chemother. 4(9): 2765-2771. 4)Ali Z.Y. (2012).Biochemical evaluation of some natural products against toxicity induced by anti- tubercular drugs in rats. New York science journals 5(10): 69-80. to isoniazid. 5)Al-Omar I.A, Al-Ashban R.M, Shah A.H.(2009). Hematological abnormalities in Saudis suffering from pulmonary tuberculosis and their response to the treatment. Research journal of pharmacology. 3(4):78-85. 15)Burtis C.A, Ashwood E.R, Bruns D.E. (2013). Tietz Fundamentals of Clinical Chemistry. 6th ed. 16)Campbell T.W. (2004). Hematology of lower vertebrates. In: Proceedings of the 55th Annual Meeting of the American College of Veterinary 6)Amilo G. I, Meludu S.C, Ele P.U, Ezechukwu C, @ IJTSRD | Available Online @ www.ijtsrd.com | Volume – 2 | Issue – 2 | Jan-Feb 2018 Page: 1709
International Journal of Trend in Scientific Research and Development (IJTSRD) ISSN: 2456-6470 Pathologists (ACVPC) & 39th Annual Meeting of the American Society of Clinical Pathology (ASVCP). USA. anti- tuberculosis drugs in experimental animals. Nutrition and metabolism:5(8). 29)Engelburg-Kulka H, Sat B, Reches M, Amitai S, Hazan R. (2004). Bacterial programmed cell death systems as targets for antibiotics. Trends Microbiol 12(2): 66 - 70. 17)Caws M, Thwaites G, Dunstan S, Hawn T, Lan N, Thuong N. (2008). The influence of host and bacterial genotype on the development of disseminated disease tuberculosis. PLoS Pathog.4(3):e1000034. with Mycobacterium 30)Etim N.A, William E.M, Akpabio U, Offiong E.A. (2014). Hematological parameters and factors affecting their values. Agricultural Science. 2(1): 37-47. 18)Cohen-Gonsaud M, Ducasse S, Hoh F, Zerbib D, Labesse G, Quemard A. (2002). Crystal structure of MabA from Mycobacterium tuberculosis, a reductase involved in long-chain fatty biosynthesis. J Mol Biol, 320: 249 - 261. 31)Faulkner W.R, Meites S. (1982). Selected methods for small clinical chemistry laboratory. American Association for Clinical Chemistry. Washington DC. 305-311. acid 19)Cosmas I, Gagneux S. (2009) The past and future of tuberculosis research. (10):e1000600. PLoS Pathog;5 32)Food and Drug Adminstration Label, 2002. 33)Fogel N. (2015). Tuberculosis: A disease without boundaries. j.tube. 95(5), 527 - 531. 20)Craig pharmacology with clinical application. 5th edition. Lippincott Williams and Wilkins. C.R, Stitzel R.E. (2004). Modern 34)Fox S.I. (2011). Human physiology. 12th ed. Mc Graw Hill, New York. 21)Dacie J.V, Lewis S.M. (1984), “Practical haematology”, 6th Edition, Medical Division of Longman Group Ltd. pp. 470-474. 35)Glynn J, Crampin A.C, Traore H, Yates M, Mwaungulu F, Ngwira B, Chaguluka S, Mwafulirwa D, Floyd S, Murphy C, Drobniewski F, Fine P. (2005). Mycobacterium tuberculosis Beijing genotype, Northern Malawi,” Emerging Infectious Diseases. 11(1): 150–153. 22)Dacie J.V, Lewis S.M. (1991). Practical haematology (7th ed.). Edinburgh:ELBS with Churchill Livingstone. pp. 37-85. 23)Davies A, Billington O, McHugh T, Mitchison D, Gillespie S. (2000). Comparison of phenotypic and genotypic methods susceptibility. J Clin Microbiol. 38(10): 3686 - 3688. 36)Guyton A.C, Hall J.E. (2006). Text book of Medical Physiology. 11th ed. for pyrazinamide 37)Houston S, Fanning A. (1994). Current and potential treatment of tuberculosis. Drugs, 48(5): 689-706. 24)Demler T.L, Trigoboff E. (2011). Are clozapine blood dyscrasia associated with concomitant medications? Innov Clin Neurosci. 8:35-41. 38)Jain S, Lamichhane G, Nimmagadda S, Pomper M, Bishai W. (2008). Antibiotic treatment of tuberculosis: Old problems, New solutions. Microb. 3(6): 285 – 292. 25)Deng L, Mikusova K, Robuck K.G, Scherman M, Brennan P.J, McNeil M.R. (1995). Recognition of multiple effects of ethambutol on metabolism of mycobacterial cell envelope. Antimicrob Agents Chemother 39: 694 - 701. 39)Jindani A, Dore C, Mitchison D. (2003). Bactericidal and sterilizing antituberculosis drugs during the first 14 days. Am J Respir Crit Care Med. 167(10): 1348 - 1354. activities of 26)Drug Bank Database. 27)Du X, Wang W, Kim R, Yakota H, Nguyen H, Kim S. (2001). Crystal structure and mechanism of catalysis of Pyrococcus horikoshii. Biochemistry. 40(47): 14166 - 14172. 40)Lawn S, Zumla A. (2012). Diagnosis of extrapulmonary tuberculosis using the Xpert® MTB/RIF assay. Eur. Respir. 10(6): 631 – 635. a pyrazinamidase from 41)Lee A, Teo A, Wong S. (2001). Novel mutations in ndh in isoniazidresistant Mycobacterium tuberculosis isolates. 28)Eminzade S, Uras F, Izzettin F.V. (2008). Silymarin protects liver against toxic effects of Antimicrob Agents @ IJTSRD | Available Online @ www.ijtsrd.com | Volume – 2 | Issue – 2 | Jan-Feb 2018 Page: 1710
International Journal of Trend in Scientific Research and Development (IJTSRD) ISSN: 2456-6470 Chemother. 45(7): 2157 -2159. and treatment. 2014(2014), 5. 42)Lin J, A. N.Sattar A.N, Puckree T. (2004). An alarming rate of drug-resistant tuberculosis at Ngwelezane Hospital in Northern KwaZulu Natal, South Africa, International Tuberculosis and Lung Disease. 8(5):568–573. 52)Peloquin C, Bulpitt A, Jaresko G, Jelliffe R, Childs J, Nix Pharmacokinetics of ethambutol under conditions, with food, and with antacids. Antimicrob Agents Chemother 43(3): 568 - 572. D. (1999). fasting Journal of 43)Lin J. P., O'Donnell C. J., Jin L., Fox C., Yang Q., Cupples L.A. ( 2007). Evidence for linkage of red blood cell size and count: Genome-wide scans in the Framingham Heart Study. Am. J. Hematol. 82(7): 605–610. 53)Quinlan G, Martin G, Evans T. (2005). Albumin: Biochemical Properties and Therapeutic Potential. Hepatology. 41(6): 1211 – 1219. 54)Ramaswamy S, Amin A, Goksel S, Stager C, Dou S, El Sahly H, Moghazeh S, Kreiswirth B, Musser J. (2000). Molecular genetic analysis of nucleotide polymorphisms Rats following chronic administration of aqueous extract of Fadogia agrestis stem. Pharmacog Mag . 3: 34 - 38. 44)Mdluli K, Slayden R, Zhu Y, Ramaswamy S, Pan X, Mead D, Crane D, Musser J, Barry C, III. (1998). Inhibition of a M. tuberculosis b-ketoacyl ACP synthase by isoniazid. Science. 280(5369): 1607 - 1610. 55)Ritter J, Lewis L, Mant T, Ferro A. (2008). A Textbook of Clinical Therapeutics. 5th Edition. 45)Merck Manual (2012). Haematologic reference ranges. Mareck Veterinary Manual. Retrieved from http://www.merckmanuals.com/. Pharmacology and 56)Santhosh S, Sini, T, Anandan R, Mathew P. (2007). Hepatoprotective activity of chitosan against isoniazid and rifampicin- induced toxicity in experimental rats. Eur. Jor. of pharm. 572(1): 69-73. 46)Mitchison D. (2004). Antimicrobial therapy of tuberculosis: justification recommended treatment regimens. Semin Respir Crit Care Med 25(3): 307 - 315. for currently 47)Mitike G, Kebede D, Yeneneh H. (1997). Prevalence of antituberculosis drug resistance in Harar Tuberculosis Centre, Ethiopia. East African Medical Journal. 74(3): 158–161. 57)Scorpio A, Lindholm-Levy P, Heifets L, Gilman R, Siddiqi S, Cynamon M, Zhang Y. (1997). Characterization of pyrazinamide – resistant tuberculosis. Antimicrob Agents Chemother. 41(3): 540 - 543. pnc A mutations Mycobacterium in 48)O’Connell T.X, Horita T.J, Kasravi B. (2005). Understanding and interpreting serum protein electrophoresis. Am. Fam. Physician. 71(1): 105 – 112. 58)Sembulingam K, Sembulingam P. (2012). Essentials of Medical Physiology. 6th ed.. 49)Ochei J, Kolhatkar A. (2000). Medical laboratory science theory and practical. Tata McGraw. 6th ed. 59)Sennels H, Jrgensen H, Hansen A, Goetze J, Fahrenkrug J. (2011). Diurnal variation of hematology parameters in healthy young males: the Bispebjerg study of diurnal variations. Scand J Clin Lab Invest. 71(7): 532–541. 50)Olafedehan C, Obun A, Yusuf M, Adewumi O, Oladefedehan A, Awofolaji A, Adeniji A. (2010). Effects of residual cyanide in processed cassava peal meals on haematological and biochemical indices of growing rabbits (p.212). Proceedings of 35th Annual Conference of Nigerian Society for Animal Production. 60)Seyoum B, Demissie M, WorkuA, Bekele S, Aseffa A. (2014). Prevalence and Drug Resistance Patterns of Mycobacterium tuberculosis among New Smear Positive Tuberculosis Patients in Eastern Ethiopia. Tuberculosis Research 2014(2014): 7. Pulmonary and Treatment. 51)Olarewaju S, Olanrewaju O, Folorunso E, Babatunde A, Temitayo-Oboh A, Abdulsalam S, Oluwatoyin A.(2014). of Tuberculosis Patients Registered at DOTS Centre in Ogbomoso, Southwestern Nigeria: A 4- Year Retrospective Study. Tuberculosis research 61)Sriram D, Yogeeswari P, Reddy S. (2006). Synthesis of pyrazinamide Mannich bases and its antitubercular properties. Bioorg Med Chem Lett. 16(8): 2113 - 2116. Treatment Outcome @ IJTSRD | Available Online @ www.ijtsrd.com | Volume – 2 | Issue – 2 | Jan-Feb 2018 Page: 1711
International Journal of Trend in Scientific Research and Development (IJTSRD) ISSN: 2456-6470 62)Ning Lampinen J, Coblenz-Korte A. (2015). Analytical and clinical performance of Abbott RealTime MTB, an assay for detection of Mycobacterium tuberculosis in pulmonary specimens. Tuberculosis. 95(5): T, Frank A, Pahalawatt V, tuberculosis report. Geneva. 74)World Health Organization (2013). Global tuberculosis report. Geneva. 75)World Health Organization (2014). Global tuberculosis control: surveillance, planning and financing. Geneva. 613 – 619. 63)Timmins GS, Deretic V. (2006). Mechanism of action of isoniazid. Mol Microbiol, 62(5), 1220- 1227. 76)Xu D. (2015). Clinical Applications of Leukocyte Morphological Parameters. Int J Pathol Clin Res, 1:002. 64)Vazques G, Guerrero G. (2007). Characterization of blood cells and hematological parameters in Cichlasoma dimerus (Teleostei, Perciformes). Tissue and cell. 39(3): 151-160. 77)Yakubu M, Akanji M, Oladiji A. (2007). Haematological evaluation in male albino. Rats following chronic administration of aqueous extract of Fadogia agrestis stem. Pharmacog Mag. 3:34-8. 65)Vilch`eze C, Wang F, Arai M, Hernando M, Colangeli R, Kremer L, Weisbrod T, Alland D, Sacchettini J, Jacobs W. jr. (2006). Transfer of a point mutation in MT inhA resolves the target for isoniazid. Nat Med. 12: 1027 - 1029. 78)Zhang P, Tang H, Chen K, Xu D. (2013). Biological variations of hematologic parameters determined by UniCel DxH 800 Hematology Analyzer. Arch Pathol Lab Med. 137. 1106- 1110. 66)Wade M, Zhang Y. (2004). Anaerobic incubation conditions enhance pyrazinamide activity against Mycobacterium tuberculosis. J Med Microbiol. 53: 769 - 773. 79)Zhang Y, Mitchison D. (2003). The curious characteristics of pyrazinamide: a review. Int J Tuberc Lung Dis 7(1): 6 - 21. 67)Wade M, Zhang Y. (2006). Effects of weak acids, UV and proton motive force inhibitors on pyrazinamide activity against Mycobacterium tuberculosis in vitro. J Antimicrob Chemother. 58: 936 - 941. 80)Zhang Y, Wade M, Scorpio A, Zhang H, Sun Z. (2003). Mode of action of pyrazinamide: disruption of Mycobacterium membrane transport and energetics by pyrazinoic acid. J Antimicrob Chemother. 52(5): 790 - 795. tuberculosis 68)Walker H, Hall W, Hurst J. (1990). Clinical Methods: The History, Physical, and Laboratory Examination. 3rd ed. Butterworth. 81)Zhang Y. (2003). Isoniazid. In: Rom WN, Garay SM (editors), Tuberculosis, Philadelphia, PA: Lippincott Williams & Wilkins, pp. 739 58. 2nd edition. 69)Wehrli W, Knusel F, Schmid K, Staehelin M. (1968). Interaction of rifamycin with bacterial RNA polymerase. Proc Natl Acad Sci. 61(2): 667 - 673. 82)Zignol M, van Gemert W, Falzon D, Sismandis C, Glaziou P, Floyd K, Raviglione M. Surveillance of anti-tuberculosis drug resistance in the world: an updated analysis, 2007-2010. Bull World Health Organ. 90(2): 111D- 119D. (2012). 70)World Health Organization (1993). WHO declares tuberculosis a global Sozial-und Präventivmedizin/ Preventive Medicine. 38(4):251–252. emergency. Social and 83)Zimhony D, Cox J, Welch J, Wilcheze C, Jacobs W. (2000). Pyrazinamide inhibits the eucaryotic- like fatty acid synthetase mycobacterium tuberculosis. Nature Medicine, 6:1043-1047. I (FASI) of 71)World Health Organization (2003). World Health Organization Global Tuberculosis Programme. Treatment of Tuberculosis: Guidelines for National Programmes, 3rd ed. Geneva. 84)Zumla A, Raviglione M, Hafner R, Reyn (2013). Current concepts. Tuberculosis. n engl j med 368: 745 – 755. 72)World Health Organization (2010). Treatment of tuberculosis: guidelines – 4th ed. World Health Organization – Geneva. 73)World Health Organization (2012). Global @ IJTSRD | Available Online @ www.ijtsrd.com | Volume – 2 | Issue – 2 | Jan-Feb 2018 Page: 1712