Download
1 / 7
70 likes | 73 Vues
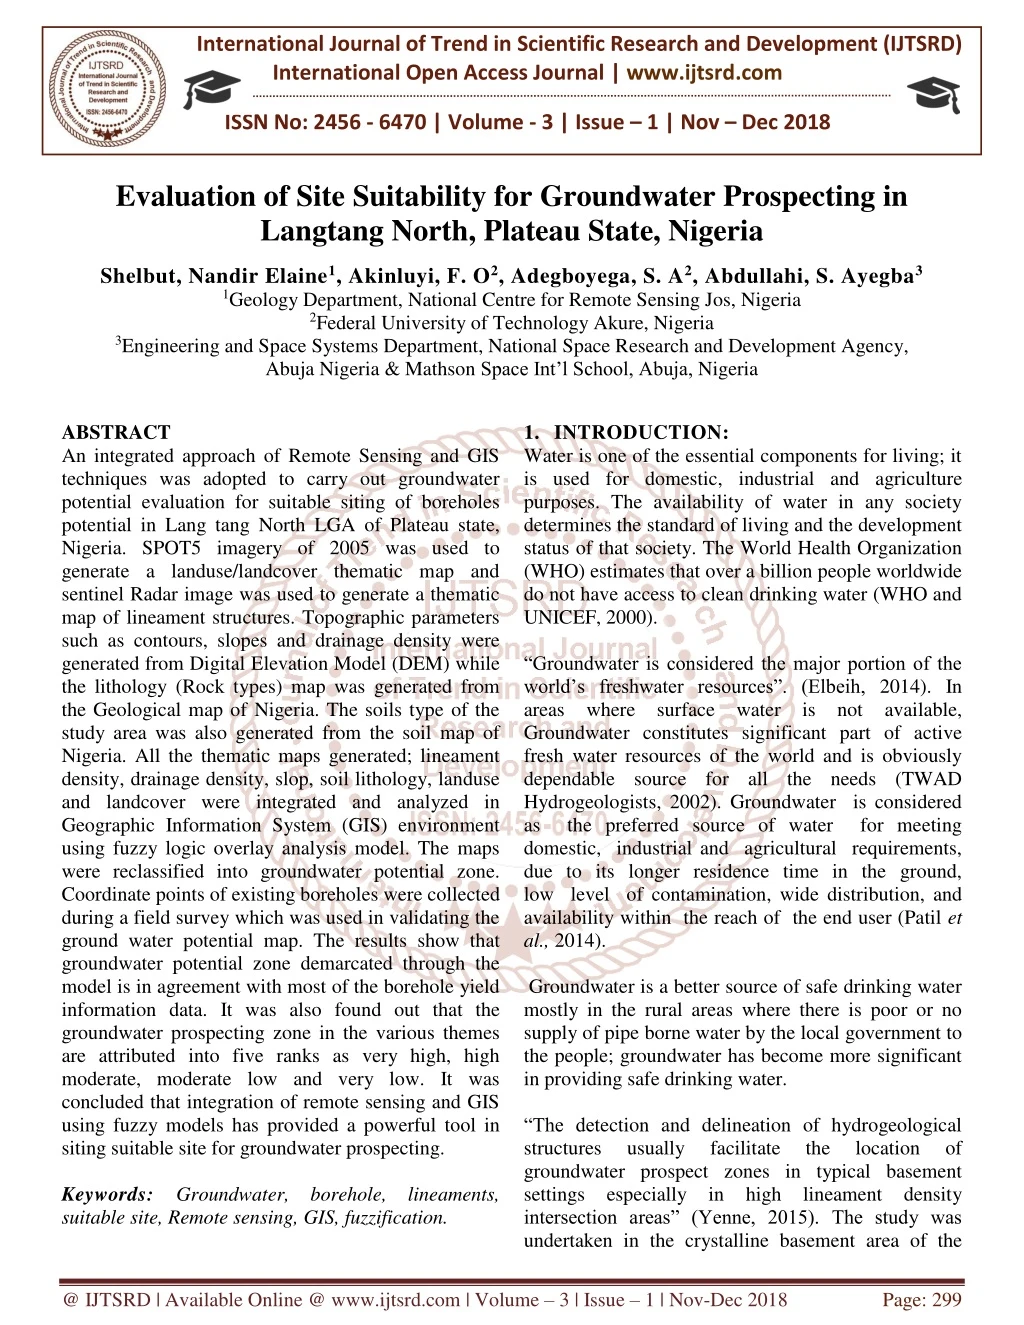
An integrated approach of Remote Sensing and GIS techniques was adopted to carry out groundwater potential evaluation for suitable siting of boreholes potential in Lang tang North LGA of Plateau state, Nigeria. SPOT5 imagery of 2005 was used to generate a landuse landcover thematic map and sentinel Radar image was used to generate a thematic map of lineament structures. Topographic parameters such as contours, slopes and drainage density were generated from Digital Elevation Model DEM while the lithology Rock types map was generated from the Geological map of Nigeria. The soils type of the study area was also generated from the soil map of Nigeria. All the thematic maps generated lineament density, drainage density, slop, soil lithology, landuse and landcover were integrated and analyzed in Geographic Information System GIS environment using fuzzy logic overlay analysis model. The maps were reclassified into groundwater potential zone. Coordinate points of existing boreholes were collected during a field survey which was used in validating the ground water potential map. The results show that groundwater potential zone demarcated through the model is in agreement with most of the borehole yield information data. It was also found out that the groundwater prospecting zone in the various themes are attributed into five ranks as very high, high moderate, moderate low and very low. It was concluded that integration of remote sensing and GIS using fuzzy models has provided a powerful tool in siting suitable site for groundwater prospecting. Shelbut, Nandir Elaine | Akinluyi, F. O | Adegboyega, S. A | Abdullahi, S. Ayegba "Evaluation of Site Suitability for Groundwater Prospecting in Langtang North, Plateau State, Nigeria" Published in International Journal of Trend in Scientific Research and Development (ijtsrd), ISSN: 2456-6470, Volume-3 | Issue-1 , December 2018, URL: https://www.ijtsrd.com/papers/ijtsrd18989.pdf Paper URL: http://www.ijtsrd.com/other-scientific-research-area/other/18989/evaluation-of-site-suitability-for-groundwater-prospecting-in-langtang-north-plateau-state-nigeria/shelbut-nandir-elaine<br>

E N D
International Journal of Trend in Scientific Research and Development (IJTSRD) International Open Access Journal | www.ijtsrd.com ISSN No: 2456 - 6470 | Volume - 3 | Issue – 1 | Nov – Dec 2018 Evaluation of Site Suitability for Groundwater Prospecting in Langtang North, Plateau State, Nigeria Shelbut, Nandir Elaine1, Akinluyi, F. O2, Adegboyega, S. A2, Abdullahi, S. Ayegba3 1Geology Department, National Centre for Remote Sensing Jos, Nigeria 2Federal University of Technology Akure, Nigeria 3Engineering and Space Systems Department, National Space Research and Development Agency, Abuja Nigeria & Mathson Space Int’l School, Abuja, Nigeria ABSTRACT An integrated approach of Remote Sensing and GIS techniques was adopted to carry out groundwater potential evaluation for suitable siting of boreholes potential in Lang tang North LGA of Plateau state, Nigeria. SPOT5 imagery of 2005 was used to generate a landuse/landcover thematic map and sentinel Radar image was used to generate a thematic map of lineament structures. Topographic parameters such as contours, slopes and drainage density were generated from Digital Elevation Model (DEM) while the lithology (Rock types) map was generated from the Geological map of Nigeria. The soils type of the study area was also generated from the soil map of Nigeria. All the thematic maps generated; lineament density, drainage density, slop, soil lithology, landuse and landcover were integrated and analyzed in Geographic Information System (GIS) environment using fuzzy logic overlay analysis model. The maps were reclassified into groundwater potential zone. Coordinate points of existing boreholes were collected during a field survey which was used in validating the ground water potential map. The results show that groundwater potential zone demarcated through the model is in agreement with most of the borehole yield information data. It was also found out that the groundwater prospecting zone in the various themes are attributed into five ranks as very high, high moderate, moderate low and very low. It was concluded that integration of remote sensing and GIS using fuzzy models has provided a powerful tool in siting suitable site for groundwater prospecting. Keywords: Groundwater, borehole, lineaments, suitable site, Remote sensing, GIS, fuzzification. 1.INTRODUCTION: Water is one of the essential components for living; it is used for domestic, industrial and agriculture purposes. The availability of water in any society determines the standard of living and the development status of that society. The World Health Organization (WHO) estimates that over a billion people worldwide do not have access to clean drinking water (WHO and UNICEF, 2000). “Groundwater is considered the major portion of the world’s freshwater resources”. (Elbeih, 2014). In areas where surface water is not available, Groundwater constitutes significant part of active fresh water resources of the world and is obviously dependable source for all the needs (TWAD Hydrogeologists, 2002). Groundwater is considered as the preferred source of water for meeting domestic, industrial and agricultural requirements, due to its longer residence time in the ground, low level of contamination, wide distribution, and availability within the reach of the end user (Patil et al., 2014). Groundwater is a better source of safe drinking water mostly in the rural areas where there is poor or no supply of pipe borne water by the local government to the people; groundwater has become more significant in providing safe drinking water. “The detection and delineation of hydrogeological structures usually facilitate groundwater prospect zones in typical basement settings especially in high lineament density intersection areas” (Yenne, 2015). The study was undertaken in the crystalline basement area of the the location of @ IJTSRD | Available Online @ www.ijtsrd.com | Volume – 3 | Issue – 1 | Nov-Dec 2018 Page: 299
International Journal of Trend in Scientific Research and Development (IJTSRD) ISSN: 2456-6470 2.LITERATURE REVIEW Manjare, (2014) groundwater potential zones in upper Vena river watersheds of Nagpur district, Maharashtra, India, using integrated approach of Remote Sensing and GIS techniques. IRS - P6, LISS-III data 22 April 2009, and Survey of India toposheet on scale 1:50,000 and District resources map. SRTM-GDEM 90m (USGS/NASA SRTM DEM data), were used. Thematic maps of geology, lineament, landuse/landcover integrated to provide certain clue of groundwater occurrence. weightage value of different geomorphic and lithological units on ground water condition were taken and seven groundwater prospect zones (i) poor to nil, (ii) poor, (iii) moderate to poor, (iv) moderate to good and (v) good, vi) good to moderate and vii) Very good were prepared. Chuma et al., (2013)identified and delineated aquiferous zones for development across Bulawayo Metropolitan using LANDSAT ETM+ image, SRTM data, aeromagnetic data and other ancillary data sets to extract information on the groundwater storing controlling features. Six thematic maps of Land use/land cover, drainage density, slope map, contact density, lithology and lineament density were produced.GIS modeling technique of the index overlay method was used to produce the groundwater potential map. Results show massive spatial variability of ground water potential ranging from very good to poor. The variability closely followed variations in the structures, geology, topography/slope, drainage density and land use/land cover in the project area. Ramamoorthy et al., (2015) conducted a study on the groundwater potential watershed, Tamil Nadu, India, using GIS techniques. A base map of study area was prepared using Survey of India Topographic sheets- 57-P/12, P/16, and M/9 & M/13 on 1:50,000 scale. Satellite imagery, topographic sheets and field survey data were used to prepare different thematic maps such as geology, geomorphology, soil, land use and drainage maps were prepared using Arc GIS 9.3 software, integrated and assigning of weightage value. A final map was prepared having different categories such as (i) Poor; (ii) Moderate and (iii) Good. Al-Bakri et al., (2013) used Remote sensing techniques and GIS tools were implemented to south-western part of Nigeria covering Ondo State. The study involved the use of GIS and Remote sensing techniques, lineaments were extracted from Landsat TM band 5, Shuttle Radar Topographic Mission (SRTM) DEM and Normalized Difference Vegetation Index (NDVI) imageries. The study established the relationships that exist between lineaments and borehole yields. The search for groundwater in hard rock terrains requires systematic understanding of geology, geomorphology and lineaments of an area, which are directly or indirectly controlled by the terrain characteristics like weathering grade, fracture extent, permeability, slope, drainage pattern, landforms, landuse/landcover and climate (Jaiswal et al., 2003; Yeh et al, 2008; Ravindran&Jayaram, 1997 and Lokesh et al., 2005). geomorphological parameters play an important role at different levels in the occurrence and movement of groundwater in all types of terrain, especially in crystalline hard rock formations. The geology of an area, geomorphology, population, built-up, drainage pattern, slope, soil type and amount of rainfall are factors that should be put into consideration when prospecting for groundwater. 1.1 STUDY AREA The study area covers the whole of Langtang North LGA of Plateau State, central Nigeria. It lies between longitudes 9° 38’40.541”E and 9° 58’41.674” E, latitudes 9°18´32.7"N and 8°47´5.733"N (Figure 1.1). With an average elevation of 330M above sea level, it falls on the Nigerian topographic sheet of Wase (191). attempted to delineate the geomorphology, and slope were Geological and potential groundwater zones in Varahanadhi Figure 1.1: Map of Nigeria showing the study area @ IJTSRD | Available Online @ www.ijtsrd.com | Volume – 3 | Issue – 1 | Nov-Dec 2018 Page: 300
International Journal of Trend in Scientific Research and Development (IJTSRD) ISSN: 2456-6470 identify sites for groundwater exploration in Al-Wala basin in Jordan. The study aims to identify promising sites for groundwater hydrogeological data. systems (GIS) tools and remote sensing data were used to prepare and analyze digital layers of lithology, geological structure, drainage and topography to detect the most promising sites for groundwater exploration in an arid basin in Jordan. Unsupervised classification to a Landsat ETM+ image of the area was used for the investigation. Results showed that spatial distribution of the most promising sites for groundwater exploration was dependent on the interrelated factors of lithology, topography and geologic structure. The highest percentage of groundwater wells was within the alluvial and wadi sediments, which were accurately detected by the digitally classified ETM+. Mutiti et al., (2010) explored the possibility of using spectral characteristics of vegetation, soils, and geology on Landsat imagery to identify areas with high potential for ground water development for the communities in the Mt. Kasigau area, TaitaTaveta District of southeast Kenya. Landsat TM and ETM+ images of different years and GIS data were analyzed, using ERDAS IMAGINE 8.7, Arc- View 3.2, and ArcGIS 9.1 to identify the areas with high potential for ground water. Image processing was carried out to produce false color composites, normalized difference vegetation indices, principal component analysis, and intensity-hue-saturation layers were used to identify features of interest. A combination of linear features, soil type, wetness data, and vegetation classes was used to identify groundwater areas. Black soils corresponded to the areas of relatively lower elevation for potential aquifer; corresponded to black soils. Certain vegetation species are associated with wet areas and ground water discharge, an overlay of all the maps (linear features, vegetation classes, and wetness) to produce a composite indicating the areas with the highest potential for ground water development. From previous resistivity surveys conducted it shows that areas which were identified as having high ground water potential did have relatively shallow water tables, and many of these were in unconsolidated alluvium that might form productive aquifers. Yenne, (2015) poised that “the detection and delineation of hydrogeological structures usually facilitate the location of groundwater prospect zones in typical basement settings especially in high lineament density intersection areas”. The study was undertaken in the crystalline basement area of the south-western part of Nigeria covering Ondo state. The study involved the use of GIS and Remote sensing techniques, lineaments were extracted from Landsat TM band 5, Shuttle Radar Topographic Mission (SRTM) DEM and Normalized Difference Vegetation Index (NDVI) imageries. The study established the relationships that exist between lineaments and borehole yields. Fashae et al., (2013) studied Groundwater potential zones in the crystalline basement terrain of SW- Nigeria (Oyo, Ogun, Osun, Ekiti and Ondo) using Landsat ETM imagery and Digital Elevation Model (DEM) of ASTER with hydrogeological, soils, geological/lithological units, and structural features, geomorphologic and climatic conditions. The study integrates different thematic layers of geology, rainfall, geomorphology, soil, drainage density, lineament density, land use, slope and drainage proximity based on weights assignment and normalization with respect to the relative contribution of the different themes to groundwater occurrence using Saaty’s analytic hierarchy approach. Following weigh normalization and ranking. The result revealed that the study area can be categorized into three different groundwater potential zones: high, medium and low. 3. MATERIALS AND METHODS 3.1 Data The primary dataset includes: The XY coordinates of the selected existing public Boreholes, was obtained with a handheld GPS. The secondary data includes: mid-resolution SPOT 5 image and digital elevation model (DEM) SRTM Images, Sentinel Synthetic Aperture Radar (SAR) image, Topographic map, soil maps, geological map, and boreholes yield information data. 3.2 Study Area Delineation The topographic map covering the study area was scanned and geo-referenced with a maximum root mean square error (RMS) of 0.00005. Subsequently, the subset output was digitized using on-screen method. The digitized products were overlain on each other, while a frame marking out the region of interest (ROI) that lies between Longitude 9°38'40.541"E and 9°58'41.674"E and latitude exploration Geographic based information on some linear features 9°18'32.7"N and @ IJTSRD | Available Online @ www.ijtsrd.com | Volume – 3 | Issue – 1 | Nov-Dec 2018 Page: 301
International Journal of Trend in Scientific Research and Development (IJTSRD) ISSN: 2456-6470 8°47'5.733"N. The same process was applied to the soil and geology map covering the study area. Subsequently, drainage network, settlements, road, soil, geology and other spatial features relevant to groundwater prospecting mapping of the area were extracted from the thematic maps as shown in (figure 1.1) 3.3 Data Collection and Preparations The Sentinel Radar image of 10m resolution was acquired from European space agency (ESA). This undergoes preprocessing. The Radar image covering the study area was clipped using the Langtang north LGA (fig. 3.1) boundary shapefile. The lineaments were extracted by on screen digitizing. scanned and import into ArcGIS 10.3 to be georefrenced and digitized on screen and save as shapefiles. 3.4 Data Analysis 3.4.1 Image Classification The SPOT 5 image was classified using maximum likelihood method to derive the land use/land cover classes. The class statistics showing area (km²), extent of land use/land cover class was determined and exported to Microsoft excel where it was used to create table. Land use/land cover and its class statistics was generated from the classification of the SPOT 5 image covering the area (Fig. 3.2 and 3.3). Fig. 3.2: SPOT 5 Image of Langtang North LGA Fig.3.1 Radar Image of Langtang North showing the Geologic structures Spot 5 image was acquired from www.usgs.gov .The images was imported intoArcGIS 10.3 software to form a colour composite of the study. The region of interest (ROI) was extracted from the map of the study area and a classification scheme was developed which include built-up shrub/grassland, forest combination of Spot 5 imagery and Shuttle Radar Topography Mission (SRTM) was used to establish the extent of ground water occurrence zone for the study area, and ground water occurrence zone mapping of the area via fussy logic. The settlement map was used to co-locate poor or good water yield zone of the study area. The geologic and soil maps were acquired from the Geological Surveys agency of Nigeria, which were used to generate lithology and soil type data, while the topographic map was acquired from Federal Survey and used to generate boundary, rivers, utilities and settlement data, all the acquired maps were been area, rock water outcrop. body, and A Fig. 3.3: Landuse/Landcover classification of the Langtang North LGA 3.4.2 Digital Elevation Model and 3D Analysis The Digital Elevation Model (DEM) (fig. 3.4) was created from the elevation data obtained from SRTM satellite image and contour map generated. This was achieved by turning on hill shading in the layer properties dialog box by choosing the Stretched @ IJTSRD | Available Online @ www.ijtsrd.com | Volume – 3 | Issue – 1 | Nov-Dec 2018 Page: 302
International Journal of Trend in Scientific Research and Development (IJTSRD) ISSN: 2456-6470 Table 4.3: Fuzzy Table of Groundwater Potential Zones Area (Km²) Very High 3.21 High 0.24 Moderate 20.5 Low 79.05 Very Low 729.14 832.14 Source: Authors GIS Analysis, 2016 4. FUZZY OVERLAY ANALYSIS MODEL 4.1 Result Langtang North groundwater zone was defined as the problem, the model was broken into sub-models, and input layers were identified. The input criteria layers i.e. factors have different numbering systems with different ranges, to be combined in a single analysis. They were converted to grid raster, and each cell for each criterion was reclassified into a common preference scale between 0 to 1 in 6 ranges (0, 0.2, 0.4, 0.6, 0.8 and 1) with 1 being the most preferred determinant factor in ground groundwater quality. renderer and checking use hill shade effect (color ramp) to represent various elevation ranges. Triangulated Irregular Network (TIN) was generated from contour (with Z attribute value) and used to generate digital elevation model (DEM), Slope, Flow accumulation, flow direction were generated from the DEM using the 3D analyst tool function of ArcGIS Version 10.3. Rank Fuzzy Value %(km²) 0.81 0.82 0.96 0.99 1 0.386 0.029 2.464 9.500 87.622 100.000 Fg. 3.4: Digital Elevation Model (DEM) of Langtang North LGA 3.4.3 Geo-hydrology Analysis Watershed and other drainage morphometric analysis were generated from the drainage map while the slope of the study area was derived and modeled from the digital elevation model data-set using create slope tool, the percentage (%) units was used to display the slope. 3.4.4 Groundwater Quality Monitoring Using Fussy Sum All the data generated in objective 1 and 2 above: soil type, lineament density, drainage density, lithology, landuse/landcover were Rasterization, vectorization and reclassification in ArcGIS 10.3. All the data were assign fussyfication of membership function, fuzzy operator applied to combine all the layers and use fuzzy overlay (fig. 3.5). Fig. 4.3: Map Showing Groundwater Potential Zones. Fig. 3.5: Analysis Model @ IJTSRD | Available Online @ www.ijtsrd.com | Volume – 3 | Issue – 1 | Nov-Dec 2018 Page: 303
International Journal of Trend in Scientific Research and Development (IJTSRD) ISSN: 2456-6470 and hence consider not to be suitable site for locating groundwater in the study area. Also built-up area, rock outcrop and bare surface are considered as area with low permeability conductivity, therefore not suitable for siting of ground water. All the six groundwater occurring factors used i.e. lineament density, drainage density, soil, lithology, landuse/ landcover (LULC) and slope; has contributed significantly in the occurrence of groundwater in Langtang North. According to the results, it has proven that the integration of Remote sensing and GIS data carried out with fuzzy logic with additional collateral data, coupled with field verification, bore hole yield water data and the geological knowledge of the area under investigation, provided a powerful tool in the study of groundwater occurrence in the study area. 6. RECOMMENDATION It is recommended that analysis of the groundwater controlling factors which controls the distribution and flow of groundwater such as the geomorphology, geology and lineament should be supported by high resolution satellite data and terrain (Radar) data. The Radar image data which operate within the microwave region remote sensing spectrum is not affected by the landuse and landcover features, therefore provide information into a significant distance of the ground. It is also recommended that more qualitative investigations involving geophysical techniques, borehole drilling and pump testing should be carried out to fully understand the prospect of the groundwater resources of the area and consequently design a model for effective groundwater exploration and exploitation in this study area. Further study should also be carried out on the water quality i.e. the biological and chemical constituent of the water in the area as this will help to determine the quality of water in the area for human use. 7. REFERENCES 1.Al-Bakri, J. T. & Al-Jahmany, Y. Y., (2013). Application of GIS and Remote Sensing to Groundwater Exploration in Al-Wala Basin in Jordan. Journal of Protection, 2013, 5, 962971 2.Chuma, C., Orimoogunje, O. I. O., Hlatywayo, D. J., &Akinyede, O. J. (2013).Application of and poor hydraulic Fig. 4.2: Work flow Diagram 4.2 FINDINGS The results demonstrate that the groundwater recharge potential zone of Langtang North can be divided into five grades, namely very high, high, moderate, low, and very low, based on the fuzzy model of the six factors of groundwater recharge potential. Analytical results demonstrate that the excellent groundwater recharge potential zone is concentrated in the downstream region due to the distribution of gentle slope, low elevation and soil with high infiltration ability. The concentration of drainage also helps the stream flow to recharge the groundwater system. Upstream region is characterised with high elevation, steep slope and is influenced by metamorphic limestone. However the upperland of Langtang North has more population landuse/landcover than the lower part. Figure 4.3 shows the groundwater recharge potential diagram of the study area. This study has established the interrelationships between the groundwater recharge potential factors and the groundwater recharge potential scores from the general hydrology characteristics of Langtang North. 5. CONCLUSION In conclusion, areas with surface expression of lineament due to high slope, low concentration of lineament, high slope and areas with high drainage density are considered to be hydrological insignificant density, greater Water Resource and @ IJTSRD | Available Online @ www.ijtsrd.com | Volume – 3 | Issue – 1 | Nov-Dec 2018 Page: 304
International Journal of Trend in Scientific Research and Development (IJTSRD) ISSN: 2456-6470 Remote Sensing and Geographical Information Systems in Determining Potential in the Crystalline Basement of Bulawayo Metropolitan Area, Research, Advances in Remote Sensing Journal, 2, 149-1613. http://dx.doi.org/10.4236/ars.2013.22019. 3.Elbeih, S.F. (2014). An overview of integrated remote sensing and GIS for groundwater mapping in Egypt, Ain Shams 4.Manjare,B.S. ( 2014). groundwater prospecting zones, using Remote Sensing and GIS techniques in upper Vena river watersheds Nagpur district, Maharashtra, India. Department of Geology RTM Nagpur University, Nagpur. 15th Esri India User Conference 2014. 5.Mutiti, S., Levy, J., Christine Mutiti, C. &Gaturu, N. S. (2010).Assessing Development Potential Imagery.NGWA.org. Vol. 48, No. 2–GROUND WATER–March-April 2010 (pages 295–305). 6.Ramamoorthy, P. & Rammohan, V. (2015). Assessment of Groundwater potential zone using remote sensing and GIS in Varahanadhi watershed, Tamil Nadu, India. International Journal for Research in Applied Science & Engineering Technology (IJRASET) Volume 3 Issue V May 2015. IC Value: 13.98 ISSN: 2321- 9653. 7.WHO (1993). Guidelines for Drinking Water Quality World Health Organization Geneva, Switzerland: UN-WHO. 8.WHO (2004) Guidelines for Drinking Water quality. Supporting Guidelines, Vol2, (3rd edition) pp.552. 9.WHO (2012) Progress Report on Drinking Water and Sanitation. Geneva: UN-WHO Cude, C. 10.Water quality index: a tool for evaluating water quality management effectiveness, J. Am. Water Resource Association. 37, pp. 125-137. 11.Yeh, H. F., Lee, C. H., Hsu, K. C. & Chang, P. H. (2008). GIS for the assessment of the groundwater recharge potential zone. Environmental Geology. Doi: 10.1007/s00254-008-1504-9. 12.Yenne, E.Y., Anifowose, A.Y.B., Dibal, H.U. &Nimchak R.N. (2015) An Assessment of the Relationship between Groundwater Productivity in a Part of the Basement Complex, Journal of Environmental Science, Toxicology and Food Technology Volume 9, Issue 6 Ver. I (Jun. 2015), PP 23-35. the Groundwater Zimbabwe. Scientific Documentation to the Identification of Ground Using Water Landsat Lineament and Southwestern Nigeria. @ IJTSRD | Available Online @ www.ijtsrd.com | Volume – 3 | Issue – 1 | Nov-Dec 2018 Page: 305