Download
1 / 7
70 likes | 73 Vues
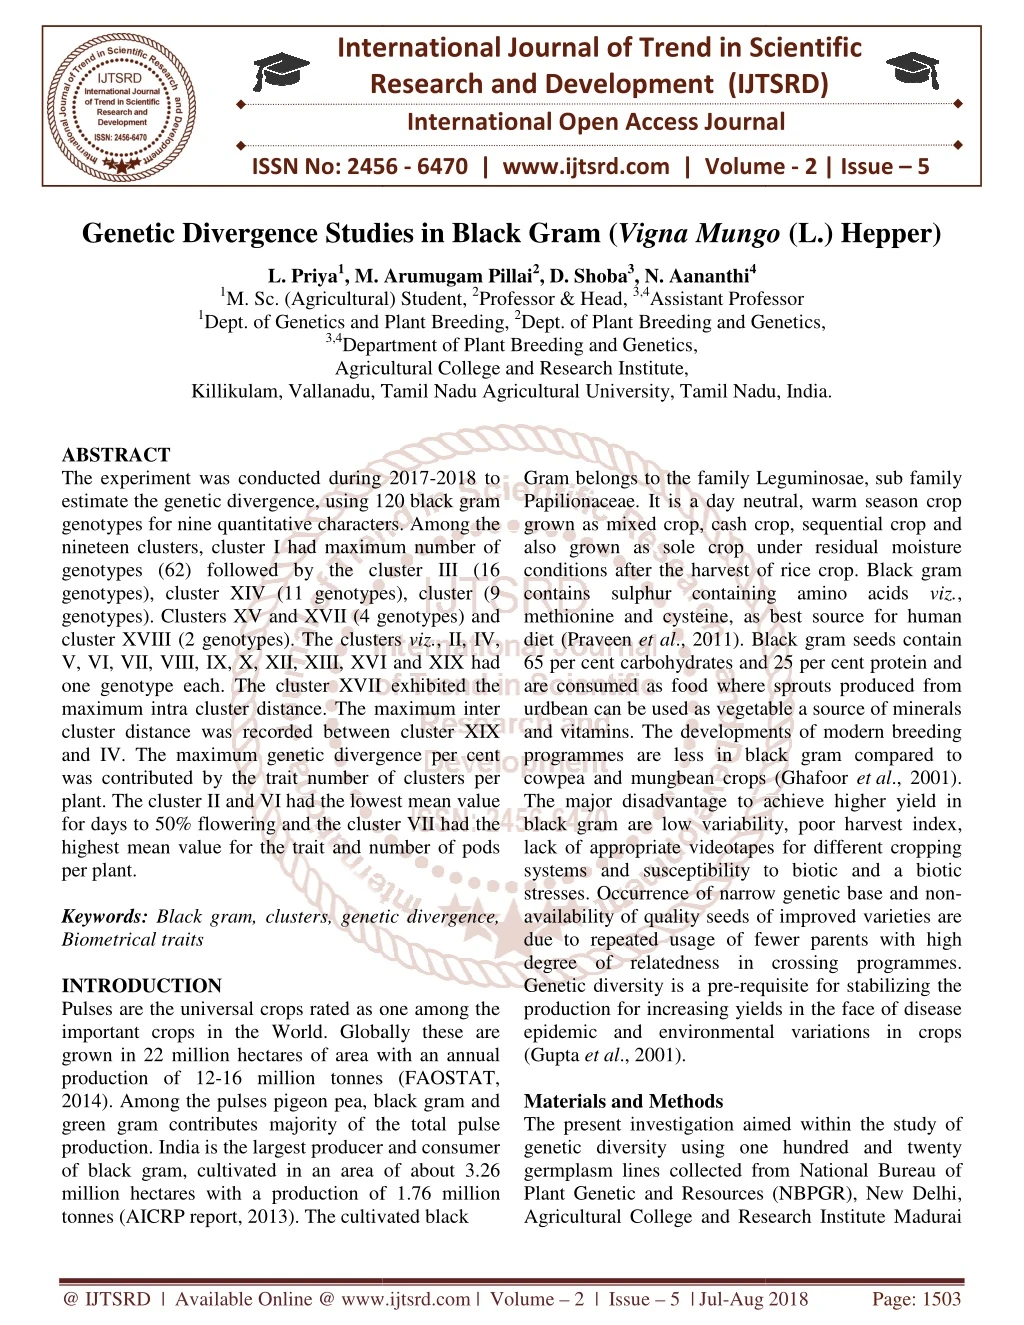
The experiment was conducted during 2017 2018 to estimate the genetic divergence, using 120 black gram genotypes for nine quantitative characters. Among the nineteen clusters, cluster I had maximum number of genotypes 62 followed by the cluster III 16 genotypes , cluster XIV 11 genotypes , cluster 9 genotypes . Clusters XV and XVII 4 genotypes and cluster XVIII 2 genotypes . The clusters viz., II, IV, V, VI, VII, VIII, IX, X, XII, XIII, XVI and XIX had one genotype each. The cluster XVII exhibited the maximum intra cluster distance. The maximum inter cluster distance was recorded between cluster XIX and IV. The maximum genetic divergence per cent was contributed by the trait number of clusters per plant. The cluster II and VI had the lowest mean value for days to 50 flowering and the cluster VII had the highest mean value for the trait and number of pods per plant. L. Priya | M. Arumugam Pillai | D. Shoba | N. Aananthi "Genetic Divergence Studies in Black Gram (Vigna Mungo (L.) Hepper)" Published in International Journal of Trend in Scientific Research and Development (ijtsrd), ISSN: 2456-6470, Volume-2 | Issue-5 , August 2018, URL: https://www.ijtsrd.com/papers/ijtsrd16958.pdf Paper URL: http://www.ijtsrd.com/biological-science/allied-sciences/16958/genetic-divergence-studies-in-black-gram-vigna-mungo-l-hepper/l-priya<br>

E N D
International Research Research and Development (IJTSRD) International Open Access Journal International Journal of Trend in Scientific Scientific (IJTSRD) International Open Access Journal ISSN No: 2456 ISSN No: 2456 - 6470 | www.ijtsrd.com | Volume 6470 | www.ijtsrd.com | Volume - 2 | Issue – 5 Genetic Divergence Studies in Black Gram Genetic Divergence Studies in Black Gram (Vigna Mungo Vigna Mungo (L.) Hepper) L. Priya1, M. Arumugam 1M. Sc. (Agricultural 1Dept. of Genetics and Plant Breeding, 3,4Department Agricultural Killikulam, Vallanadu, Tamil Nadu Agricultural University, Tamil Nadu, India. Killikulam, Vallanadu, Tamil Nadu Agricultural University, Tamil Nadu, India. Killikulam, Vallanadu, Tamil Nadu Agricultural University, Tamil Nadu, India. M. Arumugam Pillai2, D. Shoba3, N. Aananthi4 Agricultural) Student, 2Professor & Head, 3,4Assistant Professor Genetics and Plant Breeding, 2Dept. of Plant Breeding and Genetics, Department of Plant Breeding and Genetics, Agricultural College and Research Institute, Assistant Professor ing and Genetics, ABSTRACT The experiment was conducted during 2017 estimate the genetic divergence, using 120 black gram genotypes for nine quantitative characters. Among the nineteen clusters, cluster I had maximum number of genotypes (62) followed by the cluster III (16 genotypes), cluster XIV (11 genotypes), cluster (9 genotypes). Clusters XV and XVII (4 genotypes) and cluster XVIII (2 genotypes). The clusters V, VI, VII, VIII, IX, X, XII, XIII, XVI and XIX had one genotype each. The cluster XVII exhibited the maximum intra cluster distance. The maximum inter cluster distance was recorded between cluster XIX and IV. The maximum genetic divergence per cent was contributed by the trait number of clusters per plant. The cluster II and VI had the lowest mean value for days to 50% flowering and the cluster VII had the highest mean value for the trait and number of per plant. Keywords: Black gram, clusters, genetic divergence, Biometrical traits INTRODUCTION Pulses are the universal crops rated as one among the important crops in the World. Globally these are grown in 22 million hectares of area with an annual production of 12-16 million tonnes (FAOSTAT, 2014). Among the pulses pigeon pea, black gram and green gram contributes majority of the total pulse production. India is the largest producer and consumer of black gram, cultivated in an area of about 3.26 million hectares with a production of 1.76 million tonnes (AICRP report, 2013). The cultivated black tonnes (AICRP report, 2013). The cultivated black Gram belongs to the family Leguminosae, sub family Papilionaceae. It is a day neutral, warm season crop grown as mixed crop, cash crop, sequential crop and also grown as sole crop under residual moisture conditions after the harvest of rice crop. Black gram contains sulphur containing amino acids methionine and cysteine, as best source for human diet (Praveen et al., 2011). Black gram seeds contain 65 per cent carbohydrates and 25 per cent protein and are consumed as food where sprouts produced from urdbean can be used as vegetable a source of minerals and vitamins. The developments of modern breeding programmes are less in black gram compared to cowpea and mungbean crops (Ghafoor The major disadvantage to achieve higher yield in black gram are low variability, poor harvest index, lack of appropriate videotapes systems and susceptibility to biotic and stresses. Occurrence of narrow genetic base and availability of quality seeds of improved varieties are due to repeated usage of fewer parents with high degree of relatedness in crossing programmes. Genetic diversity is a pre-requisite for stabilizing the production for increasing yields in the face of disease epidemic and environmental variations in crops (Gupta et al., 2001). Materials and Methods The present investigation aimed genetic diversity using one hundred and twenty germplasm lines collected from National Bureau of Plant Genetic and Resources (NBPGR), New Delhi, Agricultural College and Research Institute Madurai The experiment was conducted during 2017-2018 to estimate the genetic divergence, using 120 black gram notypes for nine quantitative characters. Among the nineteen clusters, cluster I had maximum number of genotypes (62) followed by the cluster III (16 genotypes), cluster XIV (11 genotypes), cluster (9 genotypes). Clusters XV and XVII (4 genotypes) and ter XVIII (2 genotypes). The clusters viz., II, IV, V, VI, VII, VIII, IX, X, XII, XIII, XVI and XIX had one genotype each. The cluster XVII exhibited the maximum intra cluster distance. The maximum inter cluster distance was recorded between cluster XIX and IV. The maximum genetic divergence per cent was contributed by the trait number of clusters per plant. The cluster II and VI had the lowest mean value for days to 50% flowering and the cluster VII had the highest mean value for the trait and number of pods belongs to the family Leguminosae, sub family Papilionaceae. It is a day neutral, warm season crop grown as mixed crop, cash crop, sequential crop and also grown as sole crop under residual moisture conditions after the harvest of rice crop. Black gram contains sulphur containing amino acids viz., methionine and cysteine, as best source for human ., 2011). Black gram seeds contain 65 per cent carbohydrates and 25 per cent protein and are consumed as food where sprouts produced from dbean can be used as vegetable a source of minerals developments of modern breeding less in black gram compared to cowpea and mungbean crops (Ghafoor et al., 2001). The major disadvantage to achieve higher yield in am are low variability, poor harvest index, videotapes for different cropping systems and susceptibility to biotic and a biotic of narrow genetic base and non- availability of quality seeds of improved varieties are due to repeated usage of fewer parents with high degree of relatedness in crossing programmes. requisite for stabilizing the production for increasing yields in the face of disease epidemic and environmental variations in crops Black gram, clusters, genetic divergence, Pulses are the universal crops rated as one among the important crops in the World. Globally these are grown in 22 million hectares of area with an annual 16 million tonnes (FAOSTAT, , black gram and contributes majority of the total pulse production. India is the largest producer and consumer of black gram, cultivated in an area of about 3.26 million hectares with a production of 1.76 million The present investigation aimed within the study of genetic diversity using one hundred and twenty germplasm lines collected from National Bureau of Plant Genetic and Resources (NBPGR), New Delhi, llege and Research Institute Madurai @ IJTSRD | Available Online @ www.ijtsrd.com @ IJTSRD | Available Online @ www.ijtsrd.com | Volume – 2 | Issue – 5 | Jul-Aug 2018 Aug 2018 Page: 1503
International Journal of Trend in Scientific Research and Development (IJTSRD) ISSN: 2456-6470 and Agricultural College and Research Institute, Killikulam. The field experiment was conducted at D block of Department of Plant Breeding and Genetics at Agricultural College and Research Institute, Killikulam during the year 2017-2018. During Rabi 2018 a set of one hundred and twenty genotypes of urdbean were evaluated in Randomized block Design (RBD) with two replications. Each genotype was raised in a single row of 3 meter length with a spacing of 30 x 10 cm. Observations were recorded on five randomly selected plants in each replication for nine quantitative characters viz., days to 50 per cent flowering, plant height (cm), number of primary branches per plant, number of clusters per plant, number of pods per plant, number of seeds per plant, hundred seed weight (g), pod length (cm) and single plant yield (g). The genetic diversity was estimated by using Mahalanobis D2 statistics (Mahalanobis, 1936) and the genotypes were grouped into different clusters following Tochers method as described by Rao (1952). Results And Discussion Genetic diversity analysis was carried by Mahalanobis method in one hundred and twenty black gram genotypes for nine quantitative characters and the genotypes were grouped in to nineteen clusters (Table 1 and Fig.1). Among the nineteen clusters, cluster I had maximum number of genotypes (62) followed by cluster III (16) cluster XIV (11) cluster XI (9) Clusters XV and XVII (4) and cluster XVIII (2). The clusters viz., II, IV, V, VI, VII, VIII, IX, X, XII, XIII, XVI and XIX had one genotype each. The intra and inter cluster distance among the nineteen clusters obtained are presented in Table 2. The maximum intra cluster distance was observed in the cluster XVII (17.76) followed by clusters viz., XIV (15.07), cluster XV (14.31) and cluster III (11.61). No intra cluster values were recorded for twelve solitary clusters. The inter cluster distance ranged from 6.35 to 42.80. The maximum inter cluster distance was observed in clusters XIX and IV (42.80) followed by clusters viz., XIX and XVI (41.50), XIX and IX (41.36) and XIX and XV (40.75). The discrimination of germplasm lines into many discrete clusters, suggested the presence of high degree of genetic diversity. Earlier workers had reported the existence of high degree of genetic diversity in urdbean germplasm. (Shanthi et al. 2006 and Katiyar and Dixit, 2010), It is noted that the inter cluster distances was more than the intra cluster distances. Similar results were reported by Singh et al. (2001), Chauhan et al. (2008). Hence, magnitude of hetero sis is largely depends on the degree of genetic diversity in the parental lines. Least value of inter-cluster D2 value was observed between the clusters VII and V (6.35) suggested that the genotype in one cluster is in close promixity with the genotype in the other cluster pair. Hence, genotype from these clusters may not be useful in breeding programmes (Konda et al., 2007). The relative contribution of nine biometric characters for genetic divergence in black gram is represented in Table 3. The trait viz., number of clusters per plant contributed maximum towards the genetic divergence (29.59 %) followed by single plant yield (27.44%), number of pods per plant (15.63 %), plant height (15.18 %), number of primary branches per plant (5.62 %), hundred seed weight (4.64%), days to 50 per cent flowering (1.40 %) and number of seeds per pod (0.50 %). Similar results were reported by Gowsalya et al. (2017) for eighty seven genotypes in urdbean into twelve clusters in urdbean, The cluster mean for the nine characters studied is given Table 4. It revealed that the cluster II and VI with two genotypes (CO-6 and KKB14047) had the lowest mean value for days to 50 % flowering and hence these genotypes could be used as source for earliness. The highest mean values were recorded by the cluster XIX (number of pods per plant for 65.7) , cluster XII (plant height for 61.15 cm), Cluster XIX (number of clusters per plant for 37.30), cluster XV(single plant yield for 34.41 g), cluster VI (number of seeds per plant for 7.30), cluster XII (number of primary branches per plant for 6.00) and cluster I (hundred seed weight for 5.65 g) and Clusters XII (pod length for 5.23 cm). Hence, the genotypes present in the above said clusters would be utilized for hybridization programmes and that would result in getting transgressive segregants and exploiting genetic variation in future breeding programmes. @ IJTSRD | Available Online @ www.ijtsrd.com | Volume – 2 | Issue – 5 | Jul-Aug 2018 Page: 1504
International Journal of Trend in Scientific Research and Development (IJTSRD) ISSN: 2456-6470 Table1. Composition of D2 cluster for black gram genotypes Num ber of genot ypes 62 Clusters Genotypes I IC436656, IC436676, VBG14003, VBG12039, KU11680, IC436536, ABG11030, IC436780, ABG11015, IC343812, IC343947, IC282002, IC436882, IC282004, IC436512, VBG11042, IC436545, IC436560, IC436565, IC343967, IC36604, IC36724, IC281992, IC436609, IC436720, RU155, IC436518, IC436627, ABG11032, IC436612, IC436676, KU12668, VBG10053, ABG11004, IC436869, KKB14054, IC436792, ABG11004, IC436547, IC436772, RU152, IC436524, IC436597, IC436922, VBG10024, IC343885, ADT-3, IC436784, IC436774, IC436635, IC436610, RU158, IC335331, IC343936, VBN-4, VBG11018, IC436652, IC436762, KKM-1, KKB14049, RU152 CO6 II 1 III 16 IC436765, KKB01453, ADT-6, KKB14038, KKB14051, KKB14020, IC343856, RU1515, KKB14043, IC436606, VBN6, IC343939, KKB14022, KKB14004, KKB14033, KKB14015 IC436720 IV 1 V 1 IC436758 VI 1 KKB14047 VII 1 IC436753 VIII 1 RU154 IX 1 RU151 X 1 IC436910 XI 9 RU153, RU15009, IC436621, RU1513, KKB14044, IC436852, KKB14009, IC343943, VBG12042 VBG12034 XII 1 XIII 1 RU1512 XIV 11 ADT5, RU1510,RU1516, KKB14001, KKB14002,KKB14004, KKB14052, KKB14003, VBG10010, KKB14034, KKB14048, KKB14004, KKB14002 KKB14045, KKB14041, RU159, KKB14042 XV 4 XVI 1 IC436508 XVII 4 KKB14046, VBG10027, IC436535, VBG11040 XVIII 2 IC436626, RU1511 XIX 1 KKB14049 @ IJTSRD | Available Online @ www.ijtsrd.com | Volume – 2 | Issue – 5 | Jul-Aug 2018 Page: 1505
International Journal of Trend in Scientific Research and Development (IJTSRD) ISSN: 2456-6470 Table2. Average inter and intra cluster D2 values for black gram genotypes Cl ust ers I I II III IV V VI VI VI II IX X XI XI XI II XI V X V X VI X VI I 15. 65 13. 75 18. 89 20. 93 19. 33 17. 38 19. 73 15. 21 16. 83 19. 23 20. 10 19. 07 14. 66 27. 03 31. 64 16. 66 17. 76 XV III XI X I I 10. 59 13. 26 0.0 0 18. 83 12. 91 11. 61 13. 46 19. 59 25. 60 0.0 0 12. 86 20. 16 24. 57 11. 05 0.0 0 15. 19 7.4 0 16. 64 18. 94 22. 34 0.0 0 12. 95 20. 36 25. 29 12. 21 6.3 5 22. 81 0.0 0 13. 70 14. 09 18. 47 14. 48 16. 89 16. 45 18. 60 0.0 0 13. 28 15. 45 21. 09 11. 10 14. 80 17. 10 15. 00 8.1 6 0.0 0 13. 10 13. 53 18. 32 11. 00 16. 51 12. 19 17. 43 13. 11 10. 93 0.0 0 16. 09 12. 25 17. 58 17. 96 21. 92 9.9 4 22. 23 17. 48 17. 01 10. 46 11. 33 13. 89 13. 83 20. 14 17. 64 17. 86 13. 17 18. 68 19. 93 21. 40 16. 27 15. 73 0.0 0 13. 98 11. 42 18. 92 21. 21 20. 28 13. 75 19. 39 17. 85 19. 72 19. 88 18. 37 12. 24 0.0 0 28. 25 22. 78 17. 75 36. 14 32. 96 26. 83 34. 11 28. 74 32. 52 29. 45 27. 71 27. 17 26. 66 15. 07 32. 00 24. 33 20. 02 37. 83 38. 59 25. 07 39. 73 31. 29 34. 25 28. 31 25. 32 29. 95 31. 21 20. 44 14. 31 16. 27 19. 74 25. 38 19. 69 16. 44 23. 54 14. 40 16. 51 14. 87 22. 73 25. 41 23. 96 16. 57 34. 41 40. 75 0.0 0 24. 03 20. 83 18. 15 27. 52 25. 66 23. 99 28. 91 22. 10 25. 79 21. 77 23. 37 23. 80 28. 08 20. 14 23. 12 32. 96 25. 20 34. 69 32. 38 25. 65 42. 80 38. 55 35. 38 39. 25 37. 75 41. 36 36. 95 35. 18 32. 03 32. 81 18. 91 26. 25 41. 50 35. 21 II III IV V VI VI I VI II IX X XI XI I XI II XI V X V X VI X VI I X VI II XI X 9.3 7 28. 46 0.0 0 @ IJTSRD | Available Online @ www.ijtsrd.com | Volume – 2 | Issue – 5 | Jul-Aug 2018 Page: 1506
International Journal of Trend in Scientific Research and Development (IJTSRD) ISSN: 2456-6470 Table3. Relative contribution of various characters to genetic divergence in black gram Contribution Percentage (%) 1.40 15.18 5.62 29.59 15.63 0.50 4.64 0.00 27.44 100 % Number of times ranked First Characters Days to 50% flowering Plant height (cm) No. of primary branches per plant No. of clusters/plant No. of pods/plant No. of seeds/ pod 100 seed weight (g) Pod length (cm) Single plant yield (g) Total 100 1084 401 2113 1116 36 331 0 1959 7140 Table4. Cluster mean for nine quantitative traits in black gram 100 seed weight (g) 5.65 5.10 4.88 4.55 5.15 5.15 5.45 3.60 4.10 4.45 4.87 5.25 5.00 4.89 4.87 4.60 4.86 4.32 4.30 4.79 Single plant yield (g) 14.57 22.15 23.50 14.70 9.00 24.50 8.95 18.55 21.15 23.50 25.42 11.54 12.80 20.52 34.41 11.40 16.58 20.35 13.00 18.24 Plant height (cm) No. of primary branches per plant No. of seeds/ pod Days to 50 % flowering No. of No. of pods/plant Pod length (cm) Character Cluster clusters/plant 35.60 33.00 34.25 37.00 40.50 33.00 37.50 34.00 35.50 35.00 34.11 34.50 34.00 34.18 34.50 37.00 36.00 35.75 35.00 35.28 52.35 47.75 49.80 59.05 56.30 52.80 54.30 44.75 46.50 59.65 58.06 61.15 44.25 50.96 57.89 34.30 42.08 61.00 60.50 52.28 3.47 4.55 3.42 3.25 2.25 5.25 2.00 3.25 2.25 3.15 4.36 6.00 5.55 3.83 4.82 2.30 3.84 3.50 3.35 3.70 14.63 18.75 24.84 8.75 15.30 13.75 12.25 16.25 11.50 12.75 13.80 16.65 15.00 35.90 31.09 11.45 18.35 34.75 37.30 19.76 34.69 38.50 50.08 19.00 26.00 37.00 29.00 27.00 23.50 29.50 36.81 38.50 44.90 62.80 61.29 33.00 37.03 35.38 65.70 38.37 6.18 6.25 6.08 6.16 6.60 7.30 5.15 6.80 6.05 6.25 6.24 6.47 6.30 6.00 6.10 6.00 6.66 6.45 6.00 6.26 4.72 5.10 4.57 4.30 4.88 5.15 5.00 3.60 4.10 4.45 4.84 5.23 5.05 4.72 4.55 4.60 4.73 4.32 4.55 4.65 I II III IV V VI VII VIII IX X XI XII XIII XIV XV XVI XVII XVIII XIX MEAN REFERENCES 1.AICRP Report. (2013). Indian Institute of Pulses Research, Kanpur. 2.Chauhan, M.P., Mishra A.C. and Singh A.K. (2008). Genetic diversity studies in urdbean (Vinga mungo (L.) Hepper). Legume research, 31(1): 63-67. 3.Food and Agriculture Organisation of the United Nations FAOSTAT. http://.www.faostat.fao.org.com. 4.Ghafoor, A., Sharif, A., Ahmad, Z., Zahid, M. and Rabbani. M. (2001). Genetic diversity in blackgram (Vigna mungo (L.). Hepper). Field Crops Research., 69(2):183-190. (2014) @ IJTSRD | Available Online @ www.ijtsrd.com | Volume – 2 | Issue – 5 | Jul-Aug 2018 Page: 1507
International Journal of Trend in Scientific Research and Development (IJTSRD) ISSN: 2456-6470 5.Gowsalya, P.D., Kumaresan, D., packiraj and kannan Babu J.R. (2017). Genetic divergence in black gram (Vigna mungo) (L.) Hipper). Indian Journal of Agricultural Research., 5(2), 184-187 6.Gupta, S., Gupta, S.R, Dikshit, H.K. and Singh. (2001). Variability and its characterization in Indian collections of blackgram (Vigna mungo (L). Hepper). Plant Genetics Resources. Newl., 127:20-24. 7.Katiyar P K. and Dixit G.P. (2010). Genetic divergence in Indian black gram cultivars. Journal of Agricultural Sciences, 80 (3):242-243. 8.Konda, C.R., Salimath, P.M. and Mishra, M.N. (2007). Genetic diversity estimation in black gram. Legume Research., 30(3): 212-214 9.Mahalanobis, P. C. (1936). On the generalized distance in statistics. Proceedings of the National Institute of Science of India., 2: 49-55. 10.Parveen, S. I., Sekhar, M. R., Reddy, D. M. and Sudhakar, P. (2011). Correlation and path coefficient analysis components in black gram (Vigna mungo (L.) Hepper). International Journal Applied Biology and Pharamaceutical Technology., 2(3): 619-625. for yield and yield Rao, C.R. (1952). Advanced statistical methods in Biometric Research, John Wiley and sons, New york., P.P 351-64. 11.Shanthi P S, Jebaraj and Manivannan N. (2006). Genetic diversity in urdbean (Vinga mungo (L.) Hipper). Legume Research., 29 :181-185. 12.Singh B. (2001). Genetic divergence in black gram. Legume Research, 24: 54-56. @ IJTSRD | Available Online @ www.ijtsrd.com | Volume – 2 | Issue – 5 | Jul-Aug 2018 Page: 1508
International Journal of Trend in Scientific Research and Development (IJTSRD) ISSN: 2456-6470 Fig 1, Clustering pattern of the studied genotypes in black gram by Tocher’s method @ IJTSRD | Available Online @ www.ijtsrd.com | Volume – 2 | Issue – 5 | Jul-Aug 2018 Page: 1509