Download
1 / 11
110 likes | 112 Vues
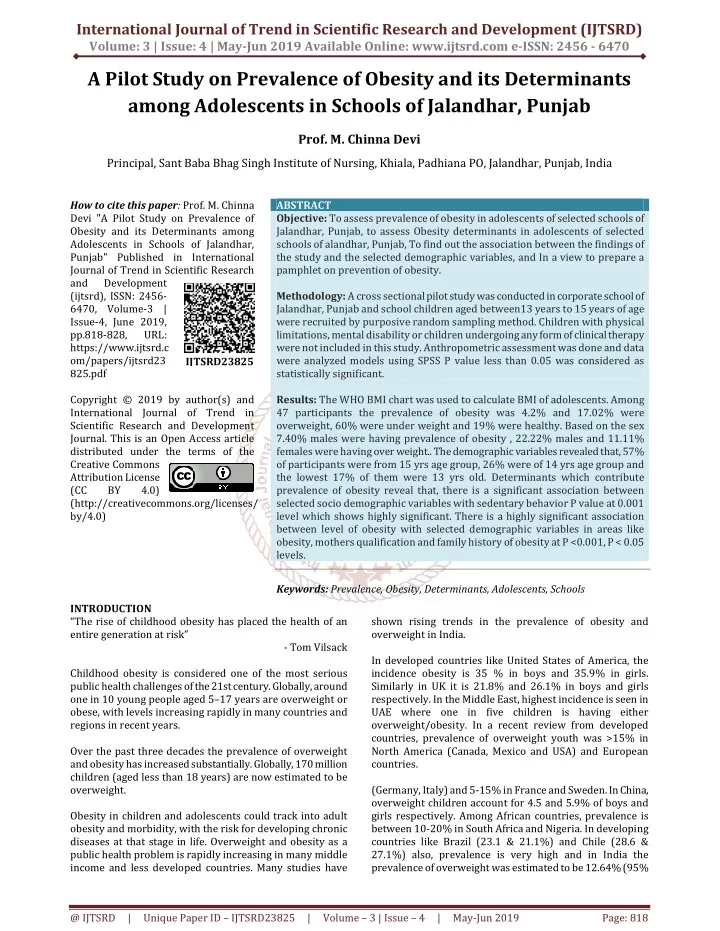
Objective To assess prevalence of obesity in adolescents of selected schools of Jalandhar, Punjab, to assess Obesity determinants in adolescents of selected schools of alandhar, Punjab, To find out the association between the findings of the study and the selected demographic variables, and In a view to prepare a pamphlet on prevention of obesity. Methodology A cross sectional pilot study was conducted in corporate school of Jalandhar, Punjab and school children aged between13 years to 15 years of age were recruited by purposive random sampling method. Children with physical limitations, mental disability or children undergoing any form of clinical therapy were not included in this study. Anthropometric assessment was done and data were analyzed models using SPSS P value less than 0.05 was considered as statistically significant. Results The WHO BMI chart was used to calculate BMI of adolescents. Among 47 participants the prevalence of obesity was 4.2 and 17.02 were overweight, 60 were under weight and 19 were healthy. Based on the sex 7.40 males were having prevalence of obesity , 22.22 males and 11.11 females were having over weight.. The demographic variables revealed that, 57 of participants were from 15 yrs age group, 26 were of 14 yrs age group and the lowest 17 of them were 13 yrs old. Determinants which contribute prevalence of obesity reveal that, there is a significant association between selected socio demographic variables with sedentary behavior P value at 0.001 level which shows highly significant. There is a highly significant association between level of obesity with selected demographic variables in areas like obesity, mothers qualification and family history of obesity at P 0.001, P 0.05 levels. Prof. M. Chinna Devi "A Pilot Study on Prevalence of Obesity and its Determinants among Adolescents in Schools of Jalandhar, Punjab" Published in International Journal of Trend in Scientific Research and Development (ijtsrd), ISSN: 2456-6470, Volume-3 | Issue-4 , June 2019, URL: https://www.ijtsrd.com/papers/ijtsrd23825.pdf Paper URL: https://www.ijtsrd.com/medicine/nursing/23825/a-pilot-study-on-prevalence-of-obesity-and-its-determinants-among-adolescents-in-schools-of-jalandhar-punjab/prof-m-chinna-devi<br>

E N D
International Journal of Trend in Scientific Research and Development (IJTSRD) Volume: 3 | Issue: 4 | May-Jun 2019 Available Online: www.ijtsrd.com e-ISSN: 2456 - 6470 A Pilot Study on Prevalence of Obesity and its Determinants among Adolescents in Schools of Jalandhar, Punjab Prof. M. Chinna Devi Principal, Sant Baba Bhag Singh Institute of Nursing, Khiala, Padhiana PO, Jalandhar, Punjab, India How to cite this paper: Prof. M. Chinna Devi "A Pilot Study on Prevalence of Obesity and its Determinants among Adolescents in Schools of Jalandhar, Punjab" Published in International Journal of Trend in Scientific Research and Development (ijtsrd), ISSN: 2456- 6470, Volume-3 | Issue-4, June 2019, pp.818-828, URL: https://www.ijtsrd.c om/papers/ijtsrd23 825.pdf Copyright © 2019 by author(s) and International Journal of Trend in Scientific Research and Development Journal. This is an Open Access article distributed under the terms of the Creative Commons Attribution License (CC BY 4.0) (http://creativecommons.org/licenses/ by/4.0) INTRODUCTION “The rise of childhood obesity has placed the health of an entire generation at risk” ABSTRACT Objective: To assess prevalence of obesity in adolescents of selected schools of Jalandhar, Punjab, to assess Obesity determinants in adolescents of selected schools of alandhar, Punjab, To find out the association between the findings of the study and the selected demographic variables, and In a view to prepare a pamphlet on prevention of obesity. Methodology: A cross sectional pilot study was conducted in corporate school of Jalandhar, Punjab and school children aged between13 years to 15 years of age were recruited by purposive random sampling method. Children with physical limitations, mental disability or children undergoing any form of clinical therapy were not included in this study. Anthropometric assessment was done and data were analyzed models using SPSS P value less than 0.05 was considered as statistically significant. Results: The WHO BMI chart was used to calculate BMI of adolescents. Among 47 participants the prevalence of obesity was 4.2% and 17.02% were overweight, 60% were under weight and 19% were healthy. Based on the sex 7.40% males were having prevalence of obesity , 22.22% males and 11.11% females were having over weight.. The demographic variables revealed that, 57% of participants were from 15 yrs age group, 26% were of 14 yrs age group and the lowest 17% of them were 13 yrs old. Determinants which contribute prevalence of obesity reveal that, there is a significant association between selected socio demographic variables with sedentary behavior P value at 0.001 level which shows highly significant. There is a highly significant association between level of obesity with selected demographic variables in areas like obesity, mothers qualification and family history of obesity at P <0.001, P < 0.05 levels. Keywords: Prevalence, Obesity, Determinants, Adolescents, Schools shown rising trends in the prevalence of obesity and overweight in India. In developed countries like United States of America, the incidence obesity is 35 % in boys and 35.9% in girls. Similarly in UK it is 21.8% and 26.1% in boys and girls respectively. In the Middle East, highest incidence is seen in UAE where one in five children is having either overweight/obesity. In a recent review from developed countries, prevalence of overweight youth was >15% in North America (Canada, Mexico and USA) and European countries. (Germany, Italy) and 5-15% in France and Sweden. In China, overweight children account for 4.5 and 5.9% of boys and girls respectively. Among African countries, prevalence is between 10-20% in South Africa and Nigeria. In developing countries like Brazil (23.1 & 21.1%) and Chile (28.6 & 27.1%) also, prevalence is very high and in India the prevalence of overweight was estimated to be 12.64% (95% IJTSRD23825 - Tom Vilsack Childhood obesity is considered one of the most serious public health challenges of the 21st century. Globally, around one in 10 young people aged 5–17 years are overweight or obese, with levels increasing rapidly in many countries and regions in recent years. Over the past three decades the prevalence of overweight and obesity has increased substantially. Globally, 170 million children (aged less than 18 years) are now estimated to be overweight. Obesity in children and adolescents could track into adult obesity and morbidity, with the risk for developing chronic diseases at that stage in life. Overweight and obesity as a public health problem is rapidly increasing in many middle income and less developed countries. Many studies have @ IJTSRD | Unique Paper ID – IJTSRD23825 | Volume – 3 | Issue – 4 | May-Jun 2019 Page: 818
International Journal of Trend in Scientific Research and Development (IJTSRD) @ www.ijtsrd.com eISSN: 2456-6470 CI 8.48-16.80%) and that of obesity to be 3.39% (95% CI 2.58-4.21%). Nicolle Fernandes reported that India is now being considered a fast weight gaining nation. The current prevalence of childhood overweight in India could range from 4% to 22%. Akwinder Kaur has done a Survey on obesity among various age group girls of Punjab. The observations revealed that the overall prevalence of underweight, healthy weight, overweight and obesity was 6.45%, 64.94%, 14.8% and 13.81% respectively. If current trends continue the number of overweight or obese infants and young children globally will increase to 70 million by 2025. Childhood period is the most crucial period where the growth and development process take place. During this period it is important to concentrate about their food habits and food patterns, especially the distribution of adequate intake of carbohydrate, proteins and fats, vitamins and minerals however, the prevalence of obesity increase among the school children. The negative impact of being underweight, overweight, or obese on the health and development of children and adolescents can also extend into adulthood, increasing the risk of chronic non-communicable diseases and disability. An enormous epidemic of lifestyle diseases, including obesity, are now among the biggest problems of modern medicine. In the development of obesity, particular attention is directed to the periods of pre-school and adolescence regarded as times of risk for the development and maintenance of obesity that can lead to consequences in adulthood. The high prevalence of overweight and obesity has serious health consequences. Raised body mass index (BMI) is a major risk factor for diseases such as cardiovascular disease, type 2 diabetes and many cancers (including, for example, colorectal cancer, kidney cancer and oesophageal cancer).These diseases – often referred to as non- communicable diseases (NCDs) – not only cause premature mortality, but also long-term morbidity. In addition, overweight and obesity in children are associated with significant reductions in quality of life and a greater risk of teasing, bullying and social isolation. Obesity affects both the mental and physical health. The potential medical complications like hypertension, coronary artery disease, diabetes mellitus, dyslipidaemia and psychological issues of depression, poor self-image, and difficulties in both the home and social environment (including school) add to the woes. Obesity also contributes to global warming as overweight people require more fuel to transport them and eat more food. Due to the rapid increases in obesity prevalence and the serious public health consequences, obesity is commonly considered one of the most serious public health challenges of the early 21st century. Methodology: A cross – sectional pilot study was conducted in corporate school of Jalandhar, Punjab and school children aged between13 years to 15 years of age were recruited by purposive random sampling method. The study protocol was reviewed and approved by the ethics committee of NIMS University, Jaipur, Rajastan. The objectives of the study were explained in detail to the teachers of the children and written consents were obtained. A pre validated self structured questionnaire was explained in detail to all the children and administered questionnaire to school going adolescents between the age group of 13-15 years. With physical limitations, adolescents who were not meeting the age criteria were not included in this study. Pilot study was conducted in one corporate school of Jalandhar, Punjab .The classes selected were 8th, 9th and 10th 13-15 yrs adolescents will be in these classes.Out of 87 participants’ 47 participants were eligible who have met the study criteria like age between 13- 15 yrs and class 8th -10th. Another 40 adolescents were excluded from the study and a total of 47 consenting children aged between 13 -15 years adolescents were included. Out of 47 participants of boys were 29 and girls were 18. Results: The WHO BMI chart was used to calculate BMI of adolescents. Based on this out of 47 participants 2 boys were obese, and 6 boys were having over weight. Among girls out of 18 participants 2 were having over weight. Out of 37 participants 28 were under weight (60% ) and 9 (19%) were healthy 17% were overweight and 4% were obese respectively. The demographic variables revealed that, 57% of participants were from 15 yrs age group, 26% were of 14 yrs age group and the lowest 17% of them were 13 yrs old. Determinants which contribute prevalence of obesity reveal that, there is no significant association between selected socio demographic variables with sedentary behavior P value at 0.001 levels which shows highly significant. There is a highly significant association between level of obesity with selected demographic variables in areas like obesity, mothers qualification and family history of obesity at P <0.001, P < 0.05 levels. The children were instructed to answer the self-administered questionnaire that contained 19 multiple choice questions. The questionnaire was divided in to Dietary pattern having 11 questions, Physical exercise 6 questions, and related to sedentary behavior 2 questions and demographic variables of 13 questions. Questionnaire was administered to those participants who were meeting the inclusion criteria. Previous day students were asked to come in light clothing’s. Next day height and weight were recorded with light weight cloths and shoes were removed. The weight of each participant was recorded in kilograms (kg) using a calibrated electronic weighing machine. The height was recorded in centimeters (cm) using a stadiometer fixed to the wall. The BMI was calculated by dividing weight (in kg) with height in meter squared (m2) and expressed as kg/m2. The data obtained were coded and statistically analyzed using SPSS . Statistical significance was inferred as P value less than or equal to 0.05. The data obtained were entered in a master data sheet for tabulation and data processing. The analysis of data was organized and presented under the following sections. Section A: Socio demographic Variables of the School going Adolescents Section B: Obesity Determinants in adolescents Section C: Association of the study findings with the socio demographic variables @ IJTSRD | Unique Paper ID – IJTSRD23825 | Volume – 3 | Issue – 4 | May-Jun 2019 Page: 819
International Journal of Trend in Scientific Research and Development (IJTSRD) @ www.ijtsrd.com eISSN: 2456-6470 The age of participants 57% of them were 15 years old,26% were 14 yrs and the lowest 17% of them were 13 yrs old. Regarding gender the highest 62% of them were males and 38% were females. All the samples 100% were from corporate school. About class 38% were from 10th class, 32% from 8th class and rest 30% from 9th class respectively. Regarding height majority 0f the samples 30% from 155-164 cms, 28% from 145-154 cms, another 28% from 165-174 cms and the least 14% were from the range of 175-184 cms. Regarding weight 54% were from 30-49 kgs, 36% were from 50-69 kgs, 6% were from 70-89 kgs and 4% were above 90 kgs. Based on BMI majority 60% of samples were of underweight, 19% were healthy, 17% were overweight and 4% were obese. In type of family 45% were from joint family, 43% belong to nuclear family and 12% were from extended family. Related to mother’s qualification most 49% were having Sr. Sec. School education, 43% were having High school education and 8% from Degree and above qualification. Regarding father’s Qualification 51% from Sr.Sec. School qualification, 36% High School, and13 % Degree and above respectively. Section A: Demographic Variables of the Adolescents Table 1: Frequency and percentage distribution of Socio demographic variables of adolescents n=47 Demographic data 1.Age (in years): 13 years 14 years 15 years 2.Gneder : Male Female 3. Type of school : Government Corporate 4.Class : 8th 9th 10th 5. Height (in Cms): 125-144 145-154 155-164 165-174 175-184 6.Weight (in Kg) : 30-49 50-69 70-89 >90 7.BMI : <18.5(under weight) 18.5-24.9(Healthy) 25-29.9(Over weight) >=30(Obese) 8.Type of family : Nuclear Joint Extended 9.Mother’s Qualification: Illiterate Primary school High school Secondary school Degree and above 10.Father’s Qualification: Illiterate Primary school High school Secondary school Degree and above 11.Family Income : <Rs.5000 Rs.5001-10000 Rs.10001-15000 Rs.15001-20000 Rs.>20000 12.physical activity participation: Mother Father Sibling Others 13.Family History of obesity : Mother Father Grand parents None 0 0 17 24 6 5 10 4 3 25 14 3 14 16 11 9 2 25 0 0 36 51 13 11 21 9 6 53 30 6 30 34 23 19 4 53 Regarding family income per month majority 53% were from above Rs 20,000 / , 21% from Rs 5001 – 10000, 11% from above Rs 5000, 9% from Rs10001 – 15000 and 6% from Rs 15001 – 20000 income. Participation of family members in Physical activity: Highest 34% of them were participated with others, 30% with mother, 30% with sibling and 6% of them were participating in physical activity with father. Obesity in family members: In 53% of them were not found obesity in the family members, 23% of the samples mothers were obese, 19% obesity was found in Father and 4% was found in grandparents respectively. N 8 12 27 29 18 0 47 15 14 18 0 13 14 13 7 25 17 3 2 28 9 8 2 20 21 6 0 0 20 23 4 % 17 26 57 62 38 0 100 32 30 38 0 28 30 28 14 54 36 6 4 60 19 17 4 43 45 12 0 0 43 49 8 @ IJTSRD | Unique Paper ID – IJTSRD23825 | Volume – 3 | Issue – 4 | May-Jun 2019 Page: 820
International Journal of Trend in Scientific Research and Development (IJTSRD) @ www.ijtsrd.com eISSN: 2456-6470 Section B: Obesity Determinants Table 2: Frequency and percentage distribution of dietary pattern of adolescents n=47 N 21 3 1 22 3 22 3 19 23 14 7 3 0 35 4 8 29 14 4 0 3 20 10 4 12 11 1 23 4 1 5 37 25 11 3 8 Questions related to dietary pattern 1. your food habits: Vegetarian Non-vegetarian Eggitarian Mixed 2.Intake of carbonated beverages : Daily Once a week Thrice a week Occasional 3.How many litres of carbonated drink you consume : <=1/2 a lt 1 lt 1.5 lt ≥2 lt 4.how often eat junk food : Daily Once in a week Trice in a week Never 5.How many pieces of sweets you consume per day : 1 piece 2 pieces >2 pieces Never 6.How often you eat outside the home: Every day Once in a week Once in a month Never 7.Munching /Nibbling of food in-between the meals: One time Two times More than three times Never 8. Skip off breakfast : Once a week Twice a week Thrice a week Never 9.How many servings of fruits you eat per day: One serving Two servings Three servings Never % 45 6 2 47 6 47 6 40 49 30 15 6 0 74 9 17 62 30 8 0 6 43 21 30 26 23 2 49 9 2 11 79 53 23 6 17 @ IJTSRD | Unique Paper ID – IJTSRD23825 | Volume – 3 | Issue – 4 | May-Jun 2019 Page: 821
International Journal of Trend in Scientific Research and Development (IJTSRD) @ www.ijtsrd.com eISSN: 2456-6470 10.How many total servings of vegetables you eat each day: One serving 2 servings 3 servings Never 11.type of food you like : Packed food Street food Homemade food All the above 6 14 27 0 0 4 40 3 13 30 57 0 0 9 85 6 Related to food habits 47% of the samples were having the habit of taking mixed diet, 45% were having vegetarian food habits, 65 and 25 were having non vegetarian and vegetarian respectively. Intake of carbonated beverages 47% of them were consuming once in a week, 40% occasional, 6% and 6% were consuming daily and thrice in a week. Quantity of the carbonated beverages 49% were taking ½ liter, 30% were taking one liter, 15 and 6% were taking 1.5 liters and more and equal to two liters respectively. Related to junk food: 74% were taking once in a week, 17% were never tasted, 9% were taken thrice in a week and none were in the option daily. Consumption of sweets per day: 62% were taken one piece per day, 30% were taken two pieces per day, 8% were taken more than two pieces per day and none were in option never. Consumption of outside food: majority 43% had once in a week, 30% never had from out side, 21% once in a month and 6% every day. Related to munching in between the meals: 49% never had food in between the meals, 26% one time, 23% two times and 2% more than three times. Servings of fruits per day: 53% had one serving, 235 had two, 17% had never taken and 6%had three serving. Servings of vegetables per day: 57% three servings, 30% two servings, 13% one serving and none of the samples under the option never. Majority 85% liked homemade food, 9% street food, 6% were liked street food, homemade packed food and none of them under the option packed food. Table 3: Frequency and percentage distribution of physical exercise of adolescents n=47 Questionnaire Related to Physical exercise n % 12. Which are the sports you play: Cricket Table tennis Carom chess 13.How many hours you play : ≤1 hour 2 hours 3 hours More than 3 hours 14. How many hours you exercise per day : ≥30 minutes 1 hours 1 and half an hours >= 2 hours 15. What is the mode of Transport to school by : Walk Cycle/two wheeler School vehicle Private vehicle 16.How many hours sleep in a day : 7-8 hours 8-9 hours 9-10 hours More than 10 hours 17.How many hours you participate in house hold work after school: ≤ 1 hours 2 hours More than 2 hours Never 12 6 21 8 22 12 10 3 37 7 2 1 0 17 14 16 36 9 2 0 23 9 2 13 26 13 45 17 47 26 21 6 79 15 4 2 0 36 30 34 77 19 4 0 49 19 4 28 The above table is related to physical exercise questionnaire Related to sports played by the samples: majority of the samples 45% of them played foot ball, 26% played cricket, 17% played chess and 13% played caroms. Hours played :47% of them played for less than or equal to one hour, 26% played for two hours, 21% played for three hours and 6% played for more than 3 hours. Related to exercise per day: 79% of them exercised for less than or equal to thirty minutes, 15% for one hour, 4% for one hour thirty minutes and 2% for more than or equal to 2hours. About transport to school: 36% of samples were going by cycle, 34% by personal vehicle means father was leaving, 30% by school bus and none of them were going by walk. Hours of sleep in @ IJTSRD | Unique Paper ID – IJTSRD23825 | Volume – 3 | Issue – 4 | May-Jun 2019 Page: 822
International Journal of Trend in Scientific Research and Development (IJTSRD) @ www.ijtsrd.com eISSN: 2456-6470 a day: 77% were slept for 7-8 hrs, 19% for 9-10 hrs, 4% for 9-10 hrs and none of them were under the option of more than 10 hrs of sleep. Participation in house hold work after school: 49% were participated less than or equal to one hour, 28% were never participated in house hold work after school. Table 4: Frequency and percentage distribution of sedentary behavior of adolescents n=47 Questionnaire Related to Sedentary behavior n % 18. How many hours you watch electronic media ( TV, computer, mobile, ) per day: ≤1 hour 2 hours 3 hours > 3 hours 19.How many hours you watch electronic media ( mobile, TV, Computer) while eating food: ≥30 minutes 40 minutes 1 hr >1 hr 21 18 8 0 33 2 7 5 45 38 17 0 70 4 15 11 Number of total hours watching electronic media (TV, Mobile, Computer): Majority 45% of them watched for less than or equal to 1 hour, 38% for two hours, 17% for three hours and none of them were under the option of more than three hours. Watching electronic media while eating food: 70% of them were watching less than or equal to thirty minutes, 15% for one hour, 11% for more than one hour, and 4% were for 40 minutes. Table 5: Mean and Standard deviation (SD ) of the obesity determinants of adolescents Score SD 3.65 1.95 1.74 4.58 Determinants of obesity Max Score Range Mean 33 13.38 5.46 51.85 Mean % 75 56 68 68 Dietary pattern Physical exercise Sedentary behavior Overall 44 24 8 76 42-25 18-10 8-2 64-40 The above table 5 deals with mean, and standard deviation (Sd) of obesity determinants of school going adolescents. This shows that adolescents got maximum mean percentage 75 (SD 3.65) in dietary pattern aspect and minimum mean percentage score of 56 with standard deviation 1.95 was found in physical exercise aspect. The overall obesity determinants mean percentage score of the adolescents was 68 with standard deviation of 4.58. Table 6: Frequency and percentage distribution of level of obesity in adolescents Score Level of obesity f 4 % 8.51 Low (58-76) Moderate (39-57) 43 91.49 High (19-38) Total - - 47 100 The above table shows level of obesity. The level of obesity reveals that most of the participants 91.49% of them were in moderate level of obesity and the lowest percentage 8.51% of them were in low level of obesity. Hence it can be interpreted that most of them were in moderate level of obesity. Table No 7: Association between levels of obesity with obesity determinants n=47 Over Weight 25-29.5 Under weight <18.5 Healthy >18.5-24.9 Obese >30 Obesity Determinants( Dietary Habits) χ2 p-value f % F % f % f % 1. your food habits: Vegetarian Non-vegetarian Eggitarian Mixed 14 2 1 11 29.8 4.3 2.1 23.4 4 1 0 4 8.5 2.1 0 8.5 3 0 0 5 6.3 0 0 10.6 0 0 0 2 0 0 0 4.3 4.79 (df=9) 0.851 NS @ IJTSRD | Unique Paper ID – IJTSRD23825 | Volume – 3 | Issue – 4 | May-Jun 2019 Page: 823
International Journal of Trend in Scientific Research and Development (IJTSRD) @ www.ijtsrd.com eISSN: 2456-6470 2.Intake of carbonated beverages : Daily Once a week Thrice a week Occasional 3 14 2 9 6.3 29.8 4.3 19.2 0 5 0 4 0 0 3 1 4 0 6.3 2.1 8.5 0 0 0 2 0 0 0 4.3 6.97 (df=9) 0.640 NS 10.6 0 8.5 3.How many litre drink of carbonated drink : <=1/2 a lt 1 lt 1.5 lt ≥2 lt 14 8 4 2 29.7 17.0 8.5 4.3 5 2 2 0 10.6 4.3 4.3 0 3 4 1 0 6.4 8.5 2.1 0 1 0 0 1 2.1 0 0 2.1 9.91 (df=9) P=0.358 NS 4.often eat junk food : Daily Once in a week Trice in a week Never 0 21 2 5 0 0 7 1 1 0 0 5 1 2 0 0 2 0 0 0 4.3 0 0 1.63 (df=6) 0.950 NS 44.7 4.3 10.6 14.9 2.1 2.1 10.6 2.1 4.3 5.How many pieces of sweets you consume per day : 1 piece 2 pieces >2 pieces Never 17 10 1 0 36.17 21.28 2.13 0 5 3 1 0 10.6 6.4 2.1 0 5 1 2 0 10.6 2.13 4.3 0 2 0 0 0 4.3 0 0 0 5.90 (df=6) 0.434 NS 6.How often you eat outside the home: Every day Once in a week Once in a month Never 2 13 5 8 4.3 27.6 10.6 17.02 1 4 0 4 2.13 8.51 0 8.51 0 1 5 2 0 0 2 0 0 0 4.3 0 0 14.54 (df=9) 0.104 NS 2.13 10.64 4.26 7.Munching /Nibbling of food in-between the meals: One time Two times More than three times Never 5 8 0 15 10.6 17.0 0 31.9 4 2 1 2 8.5 4.3 2.1 4.3 2 1 0 5 4.3 2.1 0 10.6 1 0 0 1 2.1 0 0 2.1 9.53 (df=9) 0.389 NS 8. Skip off breakfast : Once a week Twice a week Thrice a week Never 2 1 1 24 4.3 2.1 2.1 51.1 2 0 2 5 4.3 0 4.3 10.6 0 0 2 6 0 0 4.3 12.8 0 0 0 2 0 0 0 4.3 8.71 (df=9) 0.465 NS 9.How many servings of fruits you eat per day: One serving Two servings Three servings Never 10.How many total servings of vegetables you eat each day: One serving 2 servings 3 servings Never 16 5 2 5 3 7 18 0 34 10.6 4.3 10.6 6.4 14.8 38.3 0 4 4 0 1 1 4 4 0 8.5 8.5 0 2.1 2.1 8.5 8.5 0 4 2 1 1 2 3 3 0 8.5 4.3 2.1 2.1 4.3 6.4 6.4 0 1 0 0 1 0 0 2 0 2.1 0 0 2.1 0 0 4.3 0 5.54 (df=9) 0.784 NS 4.60 (df=6) 0.596 NS 11.type of food you like : Packed food Street food Homemade food All the above 0 1 25 2 0 2.1 53.19 4.2 0 2 7 0 0 4.3 14.9 0 0 1 6 1 0 2.1 12.7 2.1 0 0 2 0 0 0 4.3 0 4.56 (df=6) 0.600 NS *P<0.05 -significant and **P<0.01 & ***P<0.001 - Highly significant and NS-Not Significant & S-Significant The above table shows that there is no significant association (at P level 0.05) between the prevalence of obesity with selected dietary pattern @ IJTSRD | Unique Paper ID – IJTSRD23825 | Volume – 3 | Issue – 4 | May-Jun 2019 Page: 824
International Journal of Trend in Scientific Research and Development (IJTSRD) @ www.ijtsrd.com eISSN: 2456-6470 Table No 8: Association between levels of obesity with obesity determinants n=47 Under weight Over Weight Healthy Obese Obesity determinants (Physical exercise) χ2 p-value f % F % f % f % 12. Which are the sports you play: Cricket Foot Ball Carom Chess 13.How many hours you play : ≤1 hour 2 hours 3 hours More than 3 hours 14. How many hours you exercise per day : ≥30 minutes 1 hours 1 and half an hours >= 2 hours 15.Transport to school by : Walk Cycle School vehicle Private vehicle 16.How many hours sleep in a day 7-8 hours 8-9 hours 9-10 hours More than 10 hours 17.How many hours you participate in house hold work after school: ≤ 1 hours 2 hours More than 2 hours Never *P<0.05 -significant and **P<0.01 & ***P<0.001 - Highly significant and NS-Not Significant & S-Significant 8 4 13 3 15 7 5 1 25 3 0 0 0 12 5 11 21 5 2 0 12 7 1 8 17.0 8.5 27.6 6.4 31.9 14.9 10.6 2.1 53.1 6.4 0 0 0 25.5 10.6 23.4 44.7 10.6 4.3 0 25.5 14.8 2.1 17.0 2 1 4 2 3 3 2 1 7 1 1 0 0 2 4 3 7 2 0 0 5 0 0 4 4.3 2.1 8.5 4.3 6.4 6.4 4.3 2.1 14.9 2.1 2.1 0 0 4.3 8.5 6.4 14.9 4.3 0 0 10.6 0 0 8.5 2 1 3 2 3 2 3 0 4 2 1 1 0 3 4 1 6 2 0 0 5 1 1 1 4.3 2.1 6.4 4.3 6.3 4.3 6.3 0 8.5 4.3 2.1 2.1 0 6.4 8.5 2.1 12.7 4.3 0 0 10.6 2.1 2.1 2.1 0 0 1 1 1 0 0 1 1 1 0 0 0 0 1 1 2 0 0 0 1 1 0 0 0 0 2.1 2.1 2.1 0 0 2.1 2.1 2.1 0 0 0 0 2.1 2.1 4.3 0 0 0 2.1 2.1 0 0 3.48 (df=9) 0.942 NS 10.21 (df=9) 0.334 NS 12.49 (df=9) 0.187 NS 6.38 (df=6) P=0.382 NS 2.11 (df=6) 0.909 NS 7.91 (df=9) 0.542 NS The above table shows that there is no association between selected obesity determinants with level of obesity Table No 9: Association between levels of obesity and obesity determinants n=47 Under weight Over Weight Healthy Obese Demographic variables (sedentary Behavior) χ2 p-value f % F % f % f % 18. How many hours you watch electronic media ( TV, computer, mobile, ) per day: ≤1 hour 2 hours 3 hours > 3 hours 19.How many hours you watch electronic Media ( mobile, TV, Computer) while eating food: ≥30 minutes 40 minutes 1 hr >1 hr *P<0.05 -significant and **P<0.01 & ***P<0.001 - Highly significant and NS-Not Significant & S-Significant 12 10 6 0 20 0 6 2 25.5 21.2 12.77 0 42.5 0 12.8 4.3 3 6 0 0 6 2 0 1 6.4 12.8 0 0 12.7 4.3 0 2.1 5 1 2 0 7 0 1 0 10.6 2.1 4.3 0 14.8 0 2.1 0 1 1 0 0 0 0 0 2 2.13 2.13 0 0 0 0 0 4.3 6.75 (df=6) 0.344 NS 28.87 (df=8) 0.001** HS There is no significant association between selected obesity determinants with level of obesity Section C: Association of levels of obesity with selected socio demographic variables @ IJTSRD | Unique Paper ID – IJTSRD23825 | Volume – 3 | Issue – 4 | May-Jun 2019 Page: 825
International Journal of Trend in Scientific Research and Development (IJTSRD) @ www.ijtsrd.com eISSN: 2456-6470 Table No10: Association of selected demographic variables with the level of obesity n=47 Under weight Over Weight Healthy Obese χ2 (df) p-value Demographic variables (level of significance) F % f % f % f % 1.Age (in years): 13 years 14 years 15 years 2.Gneder : Male Female 3. Type of school : Government Corporate 4.Class : 8th 9th 10th 5. Height (in Cms): 125-144 145-154 155-164 165-174 175-184 6.Weight (in Kg) : 30-49 50-69 70-89 >90 7.Type of family : Nuclear Joint Extended 8.Mother’s Qualification: Illiterate Primary school High school Secondary school Degree and above 9.Father’s Qualification: Illiterate Primary school High school Secondary school Degree and above 10.Family Income : <Rs.5000 Rs.5001-10000 Rs.10001-15000 Rs.15001-20000 Rs.>20000 11.Family Participation in physical activity: Mother Father Sibling Others 12. Family history of obesity : Mother Father Grandparents None *P<0.05 -significant and **P<0.01 & ***P<0.001 - Highly significant and NS-Not Significant & S-Significant . 5 10 13 13 15 0 28 12 7 9 0 9 10 5 4 23 5 0 0 11 13 4 0 0 13 12 3 0 0 9 16 3 4 7 3 2 12 9 1 6 12 5 3 1 19 10.6 21.3 27.6 27.6 31.9 0 59.6 25.5 14.9 19.2 0 19.1 21.3 10.6 8.5 48.9 10.6 0 0 23.4 27.6 8.5 0 0 27.6 25.5 6.4 0 0 19.1 34.0 6.4 8.5 14.8 6.4 4.3 25.5 19.1 2.13 12.7 25.5 10.6 6.4 2.1 40.4 2 1 6 8 1 0 9 2 4 3 0 1 2 4 2 2 7 0 0 5 3 1 0 0 1 8 0 0 0 3 5 1 1 2 1 0 5 1 0 5 3 3 2 0 4 4.3 2.1 12.8 17.0 2.1 0 19.2 4.3 8.5 6.4 0 2.1 4.3 8.5 4.3 4.3 14.9 0 0 10.6 6.4 2.1 0 0 2.1 17.00 1 1 6 6 2 0 8 1 2 5 0 3 2 2 1 0 5 3 0 3 4 1 0 0 5 3 0 0 0 4 2 2 0 1 0 1 6 2 2 3 1 3 3 0 2 2.1 2.1 12.8 12.8 4.3 0 17.0 2.1 4.3 10.6 0 6.4 4.3 4.3 2.1 0 10.6 6.4 0 6.4 8.5 2.3 0 0 10.6 6.4 0 0 0 8.5 4.3 4.3 0 2.1 0 2.1 12.8 4.3 4.3 6.4 2.1 6.4 6.4 0 4.3 0 0 2 2 0 0 2 0 1 1 0 0 0 2 0 0 0 0 2 1 1 0 0 0 1 0 1 0 0 1 1 0 0 0 0 0 2 2 0 0 0 0 1 1 0 0 0 4.3 4.3 0 0 4.3 0 2.1 2.1 0 0 0 4.3 0 0 0 0 4.3 2.1 2.1 0 0 0 2.1 0 2.1 0 0 2.1 2.1 0 0 0 0 0 4.3 4.3 0 0 0 0 2.1 2.1 0 5.29 (df=6) 0.507 NS 7.41 (df=3) 0.060 NS 0 1 NS (df=1) 9.64 (df=6) P=0.384 NS 9.44 (df=9) 0.397 NS 80.14 (df=9) P<0.001*** S 1.17 (df=6) 0.978 NS 12.95 (df=6) 0.044* S 0 0 6.4 10.6 2.1 2.1 4.3 2.1 0 10.6 2.1 0 10.6 6.4 6.4 4.3 0 8.5 3.28 (df=6) 0.773 NS 6.70 (df=12) 0.876 NS 15.7 (df=8) 0.073 NS 19.49 (df=9) 0.021* S @ IJTSRD | Unique Paper ID – IJTSRD23825 | Volume – 3 | Issue – 4 | May-Jun 2019 Page: 826
International Journal of Trend in Scientific Research and Development (IJTSRD) @ www.ijtsrd.com eISSN: 2456-6470 The above table deals with the association of adolescents demographic variables with the level of obesity. It showed that there is a significant association between the level of obesity and weight , mothers qualification , and family history of obesity of the adolescents at p<0.001 (df=9), p<0.044 (df6), p<0.021 (df9) level of significance respectively. The other socio demographic variables like age, gender, type of school, class, height, type of family, father’s qualification, family monthly income, and family participation in exercise are not having any significant association with the level of obesity. DISCUSSION: The present study has been conducted to find out, the prevalence of obesity in school going adolescents between the age group of 13-15 years and to identify the factors influencing childhood obesity. The overall prevalence of obesity was 4 % and 17% were overweight. Out of 47 participants 2 boys were obese, and 6 boys were having over weight. Among girls out of 18 participants 2 were having over weight. Ramesh K Goyal et al (2010)was conducted a study on Prevalence of Overweight and Obesity in Indian Adolescent School Going Children between the age group of 12-18 years. Prevalence of overweight was found to be 14.3% among boys and 9.2% among girls whereas the prevalence of obesity was 2.9% in boys and 1.5% in girls. Prevalence of obesity in this study is less and over weight is more when compared to the above mentioned study. Tesfalem Teshome et al (2013) conducted a study on Prevalence and Associated Factors of Overweight and Obesity Among High School Adolescents in Urban Communities of Hawassa, Southern Ethiopia. The results showed that the prevalence of overweight in the study participants was 12.9% and the prevalence of obesity was 2.7% based on age and sex specific BMI classification while based on TSFT, the prevalence of overweight and obesity was 11.0% and 3.8% respectively. This study shows that obesity and over weight is more compare to the present study. The study also found that there were a statistically significant association between sex, total physical activity, socio economic index, consumption frequency of meat, fruit, fast food and time spent watching TV/using computer with overweight and obesity prevalence (p<0.05).The present study also found that there were a statistically significant association between sex, total physical activity, socio economic index, consumption frequency of meat, fruit, fast food and time spent watching TV/using computer with overweight and obesity prevalence (p<0.05). The present study also found statistically significant watching TV while eating. Mannapur et al (2015)conducted a study on prevalence of obesity and its influencing factors among school children of bagalkot city, Karnataka. A total of 750 students from standard V to X, aged between 10-15 years had been enrolled in the study. The result was 22.53% of the children had family history of obesity. The total prevalence of obesity was 2.80%. The Prevalence of obesity among male was 2.01% and in female it was 0.79%. The association between obesity in children and family H/O obesity, Diabetes, frequency of outdoor games, number of high energy food intake and education of mother is found to be statistically significant. The present study has got 23% of the children had family history of obesity and also mothers qualification is found statistically significant. Anil P Kumar et al (2015)Studied on prevalence and determinants of overweight and obesity among affluent 12- 15 yrs adolescents in Vijayawada city, Andhra Pradesh. Results were overall prevalence of overweight and obesity was 26.9% and 8.7%. Among the study participants, 50.6% were boys of which 15.7% were overweight and 5.4% were obese, and 49.38% were girls of which 11.2% were overweight and 3.4% were obese. The major risk factors include eating outside home, eating while watching TV, increased frequency of snacking outside, lack of outdoor sports, going to school on vehicles, prolonged school timings, long periods of watching TV/using computer, no daily exercise, both parents working, less hours of physical training at school, and absence of playground in the school. In the present study over weight and obesity was less compare to the above study. Whereas among boys over weight was more i.e 22.22% and 4.2% were obese out of 57.44%, and 6 males (22.22%) out of 57.44% plus 2 females (11.11%) out of 38.29% were having over weight and the overall prevalence of overweight was (17%) and prevalence of obesity was 4%. The observations of the pilot study need to be extended to a larger cohort to derive significant implications Longitudinal, cross sectional studies between several institutions are required to estimate the prevalence of obesity and determinants in children and adolescents of Jalandhar Conclusion The overall prevalence of overweight and obesity was found to be 17% and 4%. The major risk factors were eating outside home, eating while watching TV, frequency of snacking outside, not playing outdoor games, mode of transport to school, more hours of watching TV/using computer, not exercising daily, less hours participating at house hold work after the school hours and often eating junk food. Frequency of carbonated drinks and frequency of snacking were found not to influence the prevalence of overweight and obesity. The parents need to be more cautious about their child’s dietary habits. They should be counseled by the pediatrician about the effects parenting can have on the child’s BMI and also on his/her future. Children should be provided with physical training for at least 2 h per week ,all state boards should implement recording of body weight, height, BMI. Children of today consume food more often in commercial food centers without an understanding of the nutritional imbalance that energy dense food can impose. The role of parental motivation and participation in physical activity programs assumes paramount significance. Curriculum should include chapters on healthy living habits. Children should be encouraged to play outdoor games instead of computer games. Incentives should be provided to children to maintain a healthy lifestyle. Obesity and overweight are major burdens to the society. Parents and children need to be constantly educated in making nutritious food choices and the health burden that India faces due to Type 2 diabetes. Effective public health programs need to be advocated in each school. With previously mentioned easy measures, we can control overweight and obesity in children, which in turn will reduce the number of obese @ IJTSRD | Unique Paper ID – IJTSRD23825 | Volume – 3 | Issue – 4 | May-Jun 2019 Page: 827
International Journal of Trend in Scientific Research and Development (IJTSRD) @ www.ijtsrd.com eISSN: 2456-6470 adolescents. This will reduce the costs incurred on chronic diseases and also make citizens efficient and healthy. REFERENCES [1]Adolescent obesity and related behaviours: trends and inequalities in the WHO European Region, 2002–2014 www.euro.who.int Marek Sobolewski & Artur Mazur. (2018) The prevalence of underweight, overweight and obesity in children and adolescents from Ukraine; Scientific Reports, 8:3, 625, 1-7 [10]R K Agarwal,.(2008), Jl Indian Pediatrics, volume 45 – 17 [11] Global status report on non communicable diseases 2010. Geneva, World Health Organization, 2011. Available http://www.who.int/nmh/publications/ncd_report20 10/ [2]www.who.int [3]Anand Krishna Gorantla, Chandrasekhar Bineni, Gorantla AK. (2017) Prevalence of overweight and obesity risk factors among adolescents in Tirupati schools and junior colleges , Int J Community Med Public Health.4 (12), 4507-4512 at [12] Ramesh K Goyal, Vitthaldas N Shah, Banshi D Saboo, Sanjiv R Phatak, Navneet N Shah , Snehal S Patel. Prevalence of Overweight and Obesity in Indian. Adolescent School Going Children JAPI. 2010 March; VOL. 58 [4]D. Sharad Gedam ,( 2013) Childhood Obesity - challenges in the Indian Scenario International Journal of Medical Research and Review , Vol 1,Issue 1, 1– 4 [5]Nicolle Fernandes, Jagdish Khubchandani, Denise Seabert, and Swateja Nimkar. (2015) Overweight Status in Indian Children: Prevalence and Psychosocial Correlates; Indian Pediatrics, volume 52, 131-132 [13]Tesfalemtes DebebeMoges.(2013) Prevalence and Associated Factors of Overweight and Obesity Among High School Adolescents in Urban Communities of Hawassa, Southern Ethiopia: Current Research in Nutrition and Food Science. Vol (1), 23-36 home, Pragyasingh and [6]Akwinder Kaur. (2016) Survey of obesity among various age group girls of Punjab; International Journal of Physical Education: Sports and Health, 3(2), 296-299 [14]B.S. Mannapur, S. G. Nyamagouda, A. S. Dorle, Jayaraj R. Mhetri, K. R. Kulkarni, Siera Thomas.(2015) prevalence of obesity and its influencing factors among school children of bagalkot city: J of Evidence Based Med &Hlthcare. Vol. 2 July 27, (30) , 4380 – 4388 [7]http://www.who.int/end-childhood- obesity/facts/en/Commission on Ending Childhood Obesity [8]Mrs. p. ester mary, Mrs. nalini sirala jagadesh, R. vijayaraghavan. (2017) childhood obesity and its determinants among school children; Int J Pharm Bio Sci ,8(2): (B) ,649-653 [15]Anil P Kumar, Md. G D Faisal. (2015) Prevalence and determinants of overweight and obesity among affluent adolescents in Vijayawada city, Andhra Pradesh, India: International Journal of Medical Science and Public Health. Vol 4 ( 3), 408-413 [9]Katarzyna Dereń, Nyankovska, Edyta Łuszczki, Justyna Wyszyńska, Serhiy Nyankovskyy, Olena @ IJTSRD | Unique Paper ID – IJTSRD23825 | Volume – 3 | Issue – 4 | May-Jun 2019 Page: 828