Download
1 / 3
30 likes | 53 Vues
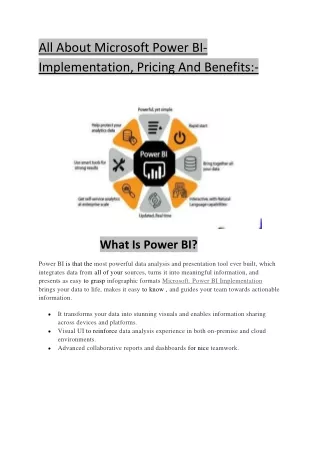
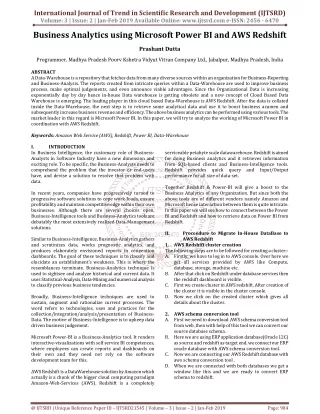
A Data Warehouse is a repository that fetches data from many diverse sources within an organization for Business Reporting and Business Analysis. The reports created from intricate queries within a Data Warehouse are used to improve business process, make optimal judgements, and even announce viable advantages. Since the Organizational Data is increasing exponentially day by day hence in house Data warehouse is getting obsolete and a new concept of Cloud Based Data Warehouse is emerging. The leading player in this cloud based Data Warehouse is AWS Redshift. After the data is collated inside the Data Warehouse, the next step is to retrieve some analytical data and use it to boost business acumen and subsequently increase business revenue and efficiency. The above business analytics can be performed using various tools. The market leader in this regard is Microsoft Power BI. In this paper, we will try to analyze the working of Microsoft Power BI in coordination with AWS Redshift. Prashant Dutta "Business Analytics using Microsoft Power BI and AWS Redshift" Published in International Journal of Trend in Scientific Research and Development (ijtsrd), ISSN: 2456-6470, Volume-3 | Issue-2 , February 2019, URL: https://www.ijtsrd.com/papers/ijtsrd21545.pdf Paper URL: https://www.ijtsrd.com/engineering/computer-engineering/21545/business-analytics-using-microsoft-power-bi-and-aws-redshift/prashant-dutta<br>

E N D
International Journal of Trend in Scientific Research and Development (IJTSRD) Volume: 3 | Issue: 2 | Jan-Feb 2019 Available Online: www.ijtsrd.com e-ISSN: 2456 - 6470 Business Analytics using Microsoft Power BI and AWS Redshift Prashant Dutta Programmer, Madhya Pradesh Poorv Kshetra Vidyut Vitran Company Ltd., Jabalpur, Madhya Pradesh, India ABSTRACT A Data-Warehouse is a repository that fetches data from many diverse sources within an organization for Business-Reporting and Business-Analysis. The reports created from intricate queries within a Data-Warehouse are used to improve business process, make optimal judgements, and even announce viable advantages. Since the Organizational Data is increasing exponentially day by day hence in-house Data warehouse is getting obsolete and a new concept of Cloud Based Data Warehouse is emerging. The leading player in this cloud based Data-Warehouse is AWS Redshift. After the data is collated inside the Data-Warehouse, the next step is to retrieve some analytical data and use it to boost business acumen and subsequently increase business revenue and efficiency. The above business analytics can be performed using various tools. The market leader in this regard is Microsoft Power BI. In this paper, we will try to analyze the working of Microsoft Power BI in coordination with AWS Redshift. Keywords: Amazon Web Service (AWS), Redshift, Power BI, Data-Warehouse I. INTRODUCTION In Business Intelligence, the customary role of Business- Analysts in Software Industry have a new dimension and exciting role. To be specific, the Business-Analysts needs to comprehend the problem that the investor or end-users have, and devise a solution to resolve that problem with data. In recent years, companies have progressively turned to progressive software solutions to cope work-loads, ensure profitability and maintain competitive edge within their own businesses. Although there are several choices open, Business-Intelligence tools and Business-Analytics tools are debatably the most extensively realized Data-Management solutions. Similar to Business-Intelligence, Business-Analytics gathers and scrutinizes data, works prognostic analytics, and produces elaborately envisioned reports in convention dashboards. The goal of these techniques is to classify and elucidate an establishment’s weakness. This is where the resemblances terminate. Business-Analytics technique is used to sightsee and analyze historical and current data. It uses Statistical-Analysis, Data-Mining and numerical analysis to classify previous business tendencies. Broadly, Business-Intelligence techniques are used to sustain, augment and rationalize current processes. The word refers to technologies, uses and practices for the collection/integration/analysis/presentation of Business- Data. The motive of Business-Intelligence is to upkeep data driven business judgement. Microsoft Power-BI is a Business-Analytics tool. It renders interactive-visualizations with self service BI competences, where employees can create reports and dashboards on their own and they need not rely on the software development team for this. AWS Redshift is a DataWarehouse solution by Amazon which actually is a chunk of the bigger cloud computing paradigm Amazon-Web-Services (AWS). Redshift is a completely serviceable petabyte scale datawarehouse. Redshift is aimed for doing Business analytics and it retrieves information from SQL-based clients and Business-Intelligence tools. Redshift provides quick query and Input/Output performance for all size of data-set. Together Redshift & Power-BI will give a boost to the Business Analytics of any Organization. But since both the above tools are of different vendors namely Amazon and Microsoft hence interaction between them is quite intricate. In this paper we will see how to connect between the Power BI and Redshift and how to retrieve data on Power BI from Redshift. II. Proceedure to Migrate In-House DataBase to AWS Redshift 1.AWS Redshift cluster creation The following steps are to be followed for creating a cluster:- A.Firstly, we have to log in to AWS console. Over here we get all services provided by AWS like Compute, database, storage, machine etc. B.After that click on Redshift under database services then the redshift dashboard is visible. C.First we create cluster in AWS redshift. After creation of the cluster it is visible in the cluster console. D.Now we click on the created cluster which gives all details about the cluster. 2.AWS schema conversion tool A.First we need to download AWS schema conversion tool from web ,then with help of this tool we can convert our source database schema. B.Here we are using ERP application database(Oracle 12C) as source and redshift as target end. we connect our ERP oracle database with AWS schema conversion tool. C.Now we are connecting our AWS Redshift database with aws schema conversion tool . D.When we are connected with both databases we get a window like this and we are ready to convert ERP schema to redshift. @ IJTSRD | Unique Reference Paper ID – IJTSRD21545 | Volume – 3 | Issue – 2 | Jan-Feb 2019 Page: 984
International Journal of Trend in Scientific Research and Development (IJTSRD) @ www.ijtsrd.com eISSN: 2456-6470 3.AWS Data Migration Service A. After schema conversion we need to create endpoints of both database ERP and Redshift. B.To create Endpoint we need to go to DMS Console and choose create Endpoint C.Add credential of data base 4.Endpoint test connection A.After creating both the end points, we need to test end point connections, if we get the connection successful then we are ready to migrate data from ERP database to Redshift database. B.Below screenshot showing endpoint Test Connection oracle to redshift. 5.DMS Task creation A.Now we need to create task for DMS. B.In create Task activity, give the task name, replication instance name, source endpoint, target endpoint, migration type. C.After the DMS task is completed we need to click the start task button. D.After clicking on start button, the data starts to upload from source(ERP) to destination(RedShift) using DMS @ IJTSRD | Unique Reference Paper ID – IJTSRD21545 | Volume – 3 | Issue – 2 | Jan-Feb 2019 Page: 985
International Journal of Trend in Scientific Research and Development (IJTSRD) @ www.ijtsrd.com eISSN: 2456-6470 III. A.First Install the Power BI Desktop Setup B.Then go to the “Get Data” tab. C.In that go to Amazon Redshift. D.Inside that give the end point of the Redshift and name of the Database, then press ok. E.After this all the tables will be visible on the Right hand side. F.After this choose your ‘Visualizations’ and Filters and your Analytics is present infront of you. Procedure to connect the RedShift Database from Power BI IV. AWS Redshift has been a very commonly requested Database for Power-BI. Both Redshift and Power BI are the market leaders in their respective fields of Datawarehouse and Analytics. We tried to bring the two leaders in the same platform so that users can benefit the most. The intricate steps of connecting and configuring the Redshift and Power BI has been shown in detail in this paper. V. Recommendations It is recommended to use Redshift when you have multiple databases (atleast more than 5) having altogether Terabytes of storage, then only it will be true value for money. Next, if security is your foremost concern then you may choose to have your own in-house datawarehouse solution rather going for cloud based solutions. Further if you do not want cross platform interdependencies to bother you then you can use AWS Quick Sight with AWS Redshift and similarly you can use Microsoft SQL Datawarehouse with Microsoft Power BI. VI. References [1]AWS Redshift https://aws.amazon.com/redshift/ [4]Amazon Redshift Database Developer Guide https://docs.aws.amazon.com/redshift/latest/dg/reds hift-dg.pdf Conclusion [5]Michael Hart, 2017, “Quick Insights with Power BI”, Accessed online at https://powerbi.microsoft.com/en- us/documentation/powerbi-service-auto-insights/ [6]Microsoft Documentation, 2017, “What is Power BI”, Accessed online at https://powerbi.microsoft.com/en- us/what-is-power-bi/ [7]Microsoft, 2017, “Choose how to get started”,Accessed online at https://powerbi.microsoft.com/en-us/get- started/ [8]Maggie Sparkman, 2017, “Frequently asked questions about Power BIFrequently asked questions about Power BI”, Accessed https://powerbi.microsoft.com/en- us/documentation/powerbi-frequently- askedquestions/ online at [9]David Iseminger, 2017, “Get data from files”,Accessed online at https://powerbi.microsoft.com/en- us/documentation/powerbi-service-get-data-from- files/ Console [2]The Design and Implementation of Modern Column- Oriented Database https://dl.acm.org/citation.cfm?id=2602024 [10]Guido Moerkotte. Small Materialized Aggregates: A Light Weight Index Structure for Data Warehousing. VLDB '98 Proceedings of the 24rd International Conference on Very Large Data Bases. Pages 476-487 Systems [3]Pedro Joel Ferreira, Ana Almeida and Jorge Bernardino., Data Warehousing in the Cloud: Amazon Redshift vs Microsoft https://www.scitepress.org/papers/2017/65871/658 71.pdf. Azure SQL, @ IJTSRD | Unique Reference Paper ID – IJTSRD21545 | Volume – 3 | Issue – 2 | Jan-Feb 2019 Page: 986