Download
1 / 3
30 likes | 50 Vues
Most retailers wish they knew more about their sales and customers' buying habits. They want to know the right levers to push and pull to increase sales and customer satisfaction. However, there are many obstacles in their way that keep them from these insights. It could be that their data is split between disconnected systems or that they are dealing with legacy systems that can't keep up. It's complicated to converge the sales from different online and offline sales channels for analysis. Centralized the location and using the Data Cube gives benefits for business such as knowing the sales trends by product type, region, or time period and knowing how much inventory you have of each product easily. This proposed system will discuss what capabilities need to perform sales trend analysis and contribute the sales trend analysis effectively by using Data Cube in viewing data. Myint Myint Yee | San San New | Myat Mon Kyaw "Effective Data Viewing in Sale Trend Analysis by using Data Cube" Published in International Journal of Trend in Scientific Research and Development (ijtsrd), ISSN: 2456-6470, Volume-3 | Issue-5 , August 2019, URL: https://www.ijtsrd.com/papers/ijtsrd27836.pdf Paper URL: https://www.ijtsrd.com/computer-science/data-miining/27836/effective-data-viewing-in-sale-trend-analysis-by-using-data-cube/myint-myint-yee<br>

E N D
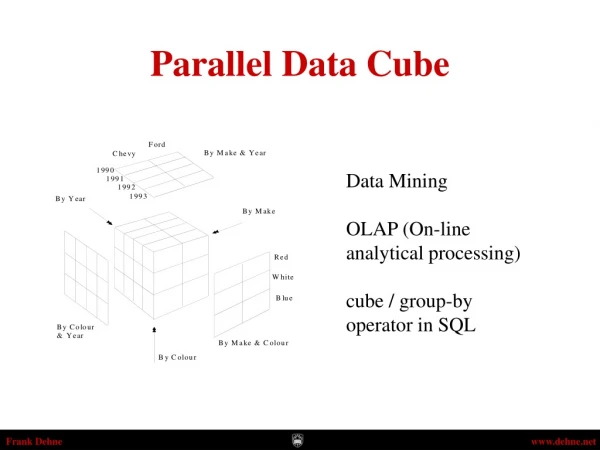
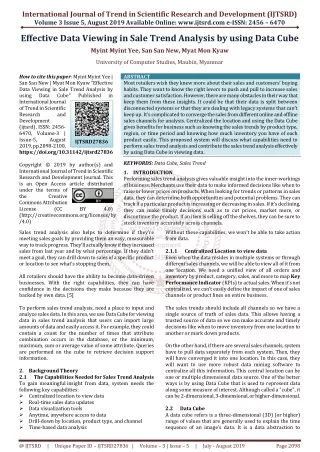
International Journal of Trend in Scientific Research and Development (IJTSRD) Volume 3 Issue 5, August 2019 Available Online: www.ijtsrd.com e-ISSN: 2456 – 6470 Effective Data Viewing in Sale Trend Analysis by using Data Cube Myint Myint Yee, San San New, Myat Mon Kyaw University of Computer Studies, Maubin, Myanmar How to cite this paper: Myint Myint Yee | San San New | Myat Mon Kyaw "Effective Data Viewing in Sale Trend Analysis by using Data Cube" International Journal of Trend in Scientific Research and Development (ijtsrd), ISSN: 2456- 6470, Volume-3 | Issue-5, August 2019, pp.2098-2100, https://doi.org/10.31142/ijtsrd27836 Copyright © 2019 by author(s) and International Journal of Trend in Scientific Research and Development Journal. This is an Open Access article distributed under the terms of the Creative Commons Attribution License (CC (http://creativecommons.org/licenses/by /4.0) Sales trend analysis also helps to determine if they’re meeting sales goals by providing them an easy, measurable way to track progress. They’ll actually know if they increased sales from last year and by what percentage. If they didn’t meet a goal, they can drill down to sales of a specific product or location to see what’s stopping them. All retailers should have the ability to become data-driven businesses. With the right capabilities, they can have confidence in the decisions they make because they are backed by own data. [5] To perform sales trend analysis, need a place to input and analyze sales data. In this area, we use Data Cube for viewing data in sales trend analysis that users can import large amounts of data and easily access it. For example, they could contain a count for the number of times that attribute combination occurs in the database, or the minimum, maximum, sum or average value of some attribute. Queries are performed on the cube to retrieve decision support information. 2.Background Theory 2.1 The Capabilities Needed for Sales Trend Analysis To gain meaningful insight from data, system needs the following key capabilities: Centralized location to view data Real-time sales data updates Data visualization tools Anytime, anywhere access to data Drill-down by location, product type, and channel Time-based data analysis ABSTRACT Most retailers wish they knew more about their sales and customers’ buying habits. They want to know the right levers to push and pull to increase sales and customer satisfaction. However, there are many obstacles in their way that keep them from these insights. It could be that their data is split between disconnected systems or that they are dealing with legacy systems that can’t keep up. It’s complicated to converge the sales from different online and offline sales channels for analysis. Centralized the location and using the Data Cube gives benefits for business such as knowing the sales trends by product type, region, or time period and knowing how much inventory you have of each product easily. This proposed system will discuss what capabilities need to perform sales trend analysis and contribute the sales trend analysis effectively by using Data Cube in viewing data. KEYWORDS: Data Cube, Sales Trend 1.INTRODUCTION Performing sales trend analysis gives valuable insight into the inner-workings of business. Merchants use their data to make informed decisions like when to raise or lower prices on products. When looking for trends or patterns in sales data, they can determine both opportunities and potential problems. They can track if a particular product is increasing or decreasing in sales. If it’s declining, they can make timely decisions such as to cut prices, market more, or discontinue the product. If an item is selling off the shelves, they can be sure to stock inventory accurately across channels. Without these capabilities, we won’t be able to take action from data. 2.1.1 Centralized Location to view data Even when the data resides in multiple systems or through different sales channels, we will be able to view all of it from one location. We need a unified view of all orders and inventory by product, category, sales, and more to map Key Performance Indicator (KPIs) to actual sales. When it’s not centralized, we can’t easily define the impact of one of sales channels or product lines on entire business. The sales trends should include all channels so we have a single source of truth of sales data. This allows having a trusted source of data so we can make accurate and timely decisions like when to move inventory from one location to another or mark down products. On the other hand, if there are several sales channels, system have to pull data separately from each system. Then, they will have converged it into one location. In this case, they will want to use more robust data mining software to centralize all this information. This central location can be one or multiple dimensional data source. One of the better ways is by using Data Cube that is used to represent data along some measure of interest. Although called a "cube", it can be 2-dimensional, 3-dimensional, or higher-dimensional. 2.2 DataCube A data cube refers is a three-dimensional (3D) (or higher) range of values that are generally used to explain the time sequence of an image's data. It is a data abstraction to Published in IJTSRD27836 BY 4.0) @ IJTSRD | Unique Paper ID – IJTSRD27836 | Volume – 3 | Issue – 5 | July - August 2019 Page 2098
International Journal of Trend in Scientific Research and Development (IJTSRD) @ www.ijtsrd.com eISSN: 2456-6470 evaluate aggregated data from a variety of viewpoints. It is also useful for imaging spectroscopy as a spectrally-resolved image is depicted as a 3-D volume. A data cube can also be described as the multidimensional extensions of two-dimensional tables. It can be viewed as a collection of identical 2-D tables stacked upon one another. Data cubes are used to represent data that is too complex to be described by a table of columns and rows. As such, data cubes can go far beyond 3-D to include many more dimensions. A data cube is generally used to easily interpret data. It is especially useful when representing data together with dimensions as certain measures of business requirements. A cube's every dimension represents certain characteristic of the database, for example, daily, monthly or yearly sales. The data included inside a data cube makes it possible analyze almost all the figures for virtually any or all customers, sales agents, products, and much more. Thus, a data cube can help to establish trends and analyze performance. Example: A database that contains transaction information relating company sales of a part to a customer at a store location. The data cube formed from this database is a 3- dimensional representation, with each cell (p,c,s) of the cube representing a combination of values from part, customer and store-location. A sample data cube for this combination is shown in Figure 1. The contents of each cell is the count of the number of times that specific combination of values occurs together in the database. Cells that appear blank in fact have a value of zero. The cube can then be used to retrieve information within the database about, for example, which store should be given a certain part to sell in order to make the greatest sales. [4] 2.2.1 m-Dimensional Array: A data cube built from m attributes can be stored as an m- dimensional array. Each element of the array contains the measure value, such as count. The array itself can be represented as a 1-dimensional array. For example, a 2- dimensional array of size x x y can be stored as a 1- dimensional array of size x*y, where element (i,j) in the 2-D array is stored in location (y*i+j) in the 1-D array. The disadvantage of storing the cube directly as an array is that most data cubes are sparse, so the array will contain many empty elements (zero values). List of Ordered Sets: To save storage space we can store the cube as a sparse array or a list of ordered sets. If we store all cells in the data cube from Figure 1, then the resulting data cube will contain (cardPart*cardStoreLocation*cardCustomer) combinations, which is 5 * 4 * 4 = 80 combinations. If we eliminate cells in the cube that contain zero, such as {P1, Vancouver, Allison}, only 27 combinations remain, as seen in Table 1. Table 1 shows an ordered set representation of the data cube. Each attribute value combination is paired with its corresponding count. This representation can be easily stored in a database table to facilitate queries on the data cube. Table 1: Ordered Set Representation of a Data Cube Representation {P3, Vancouver, Richard} 9 {P4, Vancouver, Richard} 2 Combination Count {P1, Calgary, Vance} 2 {P5, Vancouver, Richard} 9 {P2, Calgary, Vance} 4 {P3, Calgary, Vance} 1 {P1, Calgary, Richard} 2 {P1, Toronto, Vance} 5 {P2, Calgary, Richard} {P3, Toronto, Vance} 8 1 {P5, Toronto, Vance} 2 {P3, Calgary, Richard} {P5, Montreal, Vance} 5 4 {P1, Vancouver, Bob} 3 {P2, Calgary, Allison} 2 {P3, Vancouver, Bob} 5 {P5, Vancouver, Bob} 1 {P3, Calgary, Allison} Fi 1 gure 1(a): Front View ofSample Data Cube {P1, Montreal, Bob} 3 {P1, Toronto, Allison} {P3, Montreal, Bob} 8 2 {P4, Montreal, Bob} 7 {P2, Toronto, Allison} {P5, Montreal, Bob} 3 3 {P2, Vancouver, Richard} 11 {P3, Toronto, Allison} 6 {P4, Toronto, Allison} 2 2.2.2 Another aspect of data cube representation which can be considered is the representation of totals. A simple data cube Representation of Totals Figure 1(b): Entire View of Sample Data Cube @ IJTSRD | Unique Paper ID – IJTSRD27836 | Volume – 3 | Issue – 5 | July - August 2019 Page 2099
International Journal of Trend in Scientific Research and Development (IJTSRD) @ www.ijtsrd.com eISSN: 2456-6470 does not contain totals. The storage of totals increases the size of the data cube but can also decrease the time to make total-based queries. A simple way to represent totals is to add an additional layer on n sides of the n-dimensional data cube. This can be easily visualized with the 3-dimensional data cube introduced in Figure 1. Figure 2 shows the original cube with an additional layer on each of three sides to store total values. The totals represent the sum of all values in one horizontal row, vertical row (column) or depth row of the data cube. representation of this is ({ANY, Toronto, Vance},15), because it could be any part. The ordered set representation of all of Vance's transactions is ({ANY, ANY, Vance},27), that is all transactions at all store locations for Vance. The total number of transactions in the whole cube is found in the red cell and is 111. This is represented as ({ANY, ANY, ANY}, 111). 3.Conclusion Being able to effectively analyze the sales trends can have a major impact on how to run business. Through business data, they can gain valuable insight into the operations. Through key capabilities, like real-time updates and data visualization, they can make better informed business decisions. Data Cubes aggregations are an important function of queries and can benefit for business data analysis using large amounts of data. Summary results in the data cube can be used to perform data mining through attribute focusing methods. I have presented a general discussion regarding data cube computation with the help of sales trend analysis to perform data viewing on the data cube. In this article, I presented approach foranalyzing sales trend on Data Cube can reduce the amount of time, and effort have to put in to make decision making. References: [1]Dhanshri S. Lad , Rasika P. Saste “Different Cube Computation Approaches: Survey Paper” International Journal of Computer Science and Information Technologies, Vol. 5 (3) , 2014, 4057-4061 Figure2: Cube with Totals The color coding used in Figure 2 is as follows: White: Original values Light yellow: Total for one customer and one store location Light green: Total for one customer and one part Light blue: Total for one part and one store location Dark yellow: Total for one customer Dark green: Total for one part Dark blue: Total for one store location Red: Total number of transactions in all To store these totals in ordered set representation the value ANY can be used. For example, there are 15 transactions where Vance buys a part in Toronto. The ordered set [2]Prabhjot Kaurand Puneet Kaur “New Approach of Computing Data Cubes in Data Warehousing” International Journal of Information & Computation Technology. ISSN 0974-2239 Volume 4, Number 14 (2014), pp. 1411-1417 [3]Venky Harinarayan, Anand Rajaraman and Jeffery D. Ullman “Implementing Data Cubes Efficiently” [4]Information ~dbd/cs831/notes/dcubes/dcubes on http://www2.cs.uregina.ca/ [5]Information on https://www.nchannel.com/blog/ how-to-perform-sales-trend-analysis/ @ IJTSRD | Unique Paper ID – IJTSRD27836 | Volume – 3 | Issue – 5 | July - August 2019 Page 2100