Download
1 / 15
150 likes | 153 Vues
Diversity brings multi ethnic, multi racial and multi cultural perspective to organizations because the concept creates awareness of diverse populations both in workplaces and commercial markets. Broadly view, the objective of the study is to investigate if there are any significant differences of diversity management on Employees Engagement in Nigerian Universities. Specifically, the study is ought to explore the differences in the Nature of Relationship between Cultural Synergy and Employees Promotion among Universities in North Central Nigeria. A survey design was employed and the population comprises of Nine 9 selected universities that cut across the three 3 states under study. However, a sample size of 399 was determined using Taro Yamane sample size technique. Equality allocation format is shared among the three states under study hence 133 copies of questionnaires are distributed among each state. In return, 378 copies of questionnaire representing 95 of it is filled, returned and therefore used for the entire analysis. Descriptive statistics was use to test the mean differences while Kruskal Wallis test was used to test the hypotheses. Findings reviewed that all the significance levels are within 1 , indicating that there is no significant difference in the nature of relationship between cultural synergy and employee promotion. It was recommended that universities in the north central can be compared towards cultural synergy and employeesu00e2u20acu2122 promotions are guided by the same principles. This by implication implies that universities has standard of operations which are put into practice be it public or privates since they are being control by a central body called the National University Commission and public employments are still being controlled by the character commission. Nnabuife Ezimma K. | Madu Ikemefuna "Diversity Management and Employee Engagement: A Comparative Analysis of Tertiary Institutions In North Central Nigeria" Published in International Journal of Trend in Scientific Research and Development (ijtsrd), ISSN: 2456-6470, Volume-4 | Issue-3 , April 2020, URL: https://www.ijtsrd.com/papers/ijtsrd30283.pdf Paper Url :https://www.ijtsrd.com/management/equality-diversity-and-inclusion/30283/diversity-management-and-employee-engagement-a-comparative-analysis-of-tertiary-institutions-in-north-central-nigeria/nnabuife-ezimma-k<br>

E N D
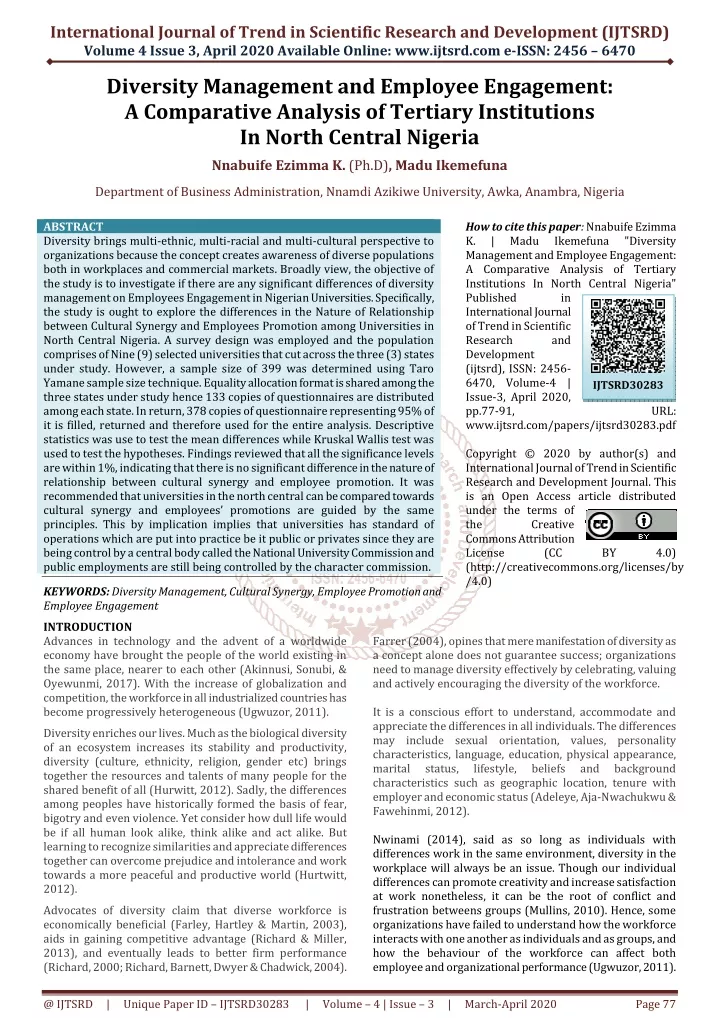
International Journal of Trend in Scientific Research and Development (IJTSRD) Volume 4 Issue 3, April 2020 Available Online: www.ijtsrd.com e-ISSN: 2456 – 6470 Diversity Management and Employee Engagement: A Comparative Analysis of Tertiary Institutions In North Central Nigeria Nnabuife Ezimma K. (Ph.D), Madu Ikemefuna Department of Business Administration, Nnamdi Azikiwe University, Awka, Anambra, Nigeria ABSTRACT Diversity brings multi-ethnic, multi-racial and multi-cultural perspective to organizations because the concept creates awareness of diverse populations both in workplaces and commercial markets. Broadly view, the objective of the study is to investigate if there are any significant differences of diversity management on Employees Engagement in Nigerian Universities. Specifically, the study is ought to explore the differences in the Nature of Relationship between Cultural Synergy and Employees Promotion among Universities in North Central Nigeria. A survey design was employed and the population comprises of Nine (9) selected universities that cut across the three (3) states under study. However, a sample size of 399 was determined using Taro Yamane sample size technique. Equality allocation format is shared among the three states under study hence 133 copies of questionnaires are distributed among each state. In return, 378 copies of questionnaire representing 95% of it is filled, returned and therefore used for the entire analysis. Descriptive statistics was use to test the mean differences while Kruskal Wallis test was used to test the hypotheses. Findings reviewed that all the significance levels are within 1%, indicating that there is no significant difference in the nature of relationship between cultural synergy and employee promotion. It was recommended that universities in the north central can be compared towards cultural synergy and employees’ promotions are guided by the same principles. This by implication implies that universities has standard of operations which are put into practice be it public or privates since they are being control by a central body called the National University Commission and public employments are still being controlled by the character commission. KEYWORDS: Diversity Management, Cultural Synergy, Employee Promotion and Employee Engagement INTRODUCTION Advances in technology and the advent of a worldwide economy have brought the people of the world existing in the same place, nearer to each other (Akinnusi, Sonubi, & Oyewunmi, 2017). With the increase of globalization and competition, the workforce in all industrialized countries has become progressively heterogeneous (Ugwuzor, 2011). Diversity enriches our lives. Much as the biological diversity of an ecosystem increases its stability and productivity, diversity (culture, ethnicity, religion, gender etc) brings together the resources and talents of many people for the shared benefit of all (Hurwitt, 2012). Sadly, the differences among peoples have historically formed the basis of fear, bigotry and even violence. Yet consider how dull life would be if all human look alike, think alike and act alike. But learning to recognize similarities and appreciate differences together can overcome prejudice and intolerance and work towards a more peaceful and productive world (Hurtwitt, 2012). Advocates of diversity claim that diverse workforce is economically beneficial (Farley, Hartley & Martin, 2003), aids in gaining competitive advantage (Richard & Miller, 2013), and eventually leads to better firm performance (Richard, 2000; Richard, Barnett, Dwyer & Chadwick, 2004). How to cite this paper: Nnabuife Ezimma K. | Madu Ikemefuna Management and Employee Engagement: A Comparative Analysis of Tertiary Institutions In North Central Nigeria" Published in International Journal of Trend in Scientific Research and Development (ijtsrd), ISSN: 2456- 6470, Volume-4 | Issue-3, April 2020, pp.77-91, www.ijtsrd.com/papers/ijtsrd30283.pdf Copyright © 2020 by author(s) and International Journal of Trend in Scientific Research and Development Journal. This is an Open Access article distributed under the terms of the Creative Commons Attribution License (CC (http://creativecommons.org/licenses/by /4.0) "Diversity IJTSRD30283 URL: BY 4.0) Farrer (2004), opines that mere manifestation of diversity as a concept alone does not guarantee success; organizations need to manage diversity effectively by celebrating, valuing and actively encouraging the diversity of the workforce. It is a conscious effort to understand, accommodate and appreciate the differences in all individuals. The differences may include sexual orientation, values, personality characteristics, language, education, physical appearance, marital status, lifestyle, characteristics such as geographic location, tenure with employer and economic status (Adeleye, Aja-Nwachukwu & Fawehinmi, 2012). Nwinami (2014), said as so long as individuals with differences work in the same environment, diversity in the workplace will always be an issue. Though our individual differences can promote creativity and increase satisfaction at work nonetheless, it can be the root of conflict and frustration betweens groups (Mullins, 2010). Hence, some organizations have failed to understand how the workforce interacts with one another as individuals and as groups, and how the behaviour of the workforce can affect both employee and organizational performance (Ugwuzor, 2011). beliefs and background @ IJTSRD | Unique Paper ID – IJTSRD30283 | Volume – 4 | Issue – 3 | March-April 2020 Page 77
International Journal of Trend in Scientific Research and Development (IJTSRD) @ www.ijtsrd.com eISSN: 2456-6470 McPherson (2013), Gotsis & Kortezi (2013), emphasise that virtues such as forgivingness, meekness and benignity as valued ends; and that they can reduce bias and prevent rigid social categorisation. This provides decreasing the level of stereotypes regarding any type of diversity. Such results of virtue ethics may eliminate the conflicts of employing a diverse workforce. The study is concentrating on studying diversity in the recognized universities situated in the North Central Nigeria which comprises of Abuja the federal capital territory, Benue, Kogi, Kwara, Nasarawa, Niger and Plateau State. The states have Public and Private Institutions which are made up of Federal, States and Private recognized Universitiesby the National University Commission (NUC). Statement of the Problem Education universalizes the human spirit; hence, one cannot be universalized if he’s acquainted to only one world, i.e the world of his ethnic group, the world of his neighborhood, the world of his religion or the world of his family. The word university is related to this idea. The concept of diversity brings a multi-ethnic, multi-racial, and multi-cultural perspective to organizations because that concept creates an awareness of diverse populations both in workplaces and commercial markets. The complexity of culture and cultural orientation in Nigeria is difficult for organizations and managers to understand and harness in the workplace. It is likely that inappropriate ethnic balancing, poor gender distribution, poor educational status spreading and other dimension of cultural diversity are responsible for poor work engagement in the civil service. North Central Nigeria is diverse as to its employment system because it has mixtures of believes, cultural differences and value system operating in every area and as such, diverse in its employment standard. Worldwide access to higher education fostered by globalization presents universities with a bigger market and wider customer base, a development which brings its opportunities along with challenges, one of them being diversity - a phenomenon which if properly managed can become a competitive advantage (George & Akaighe, 2017). Objectives of the Study Broadly view, the objective of the study is to investigate if there are any significant differences of diversity management on Employees Engagement in Nigerian Universities. Specifically, the study is ought to explore the differences in the Nature of Relationship between Cultural Synergy and Employees Promotion among Universities in North Central Nigeria. Research Hypotheses H0: There is no significant difference in the Nature of Relationship between Cultural Synergy and Employee Promotion among Universities in North Central Nigeria. REVIEW OF RELATED LITERATURE Conceptual Review Diversity Management Diversity management which is defined as the process of identifying, acknowledging, accepting, and capitalizing upon the various individual differences (gender, race, educational & cultural background and values) in a manner that allows the employees to reach their maximum potential in order to achieve competitive advantage (Hamden, 1993). Managing diversity is a top priority for managers in all organizations large and small, public and private; for profit and non-profit purposes, managers need to ensure that they and their subordinates appreciate the value that diversity brings to an organization, understand why diversity should be celebrated rather ignored and have the ability to interact and work effectively with men and women who are physically challenged or are of a diverse race, age, gender, ethnicity, nationality or sexual orientation. Bergen, Von & Teresa (2002), mentioned several positive benefits of diversity management, they are: 1.Enhanced personal effectiveness and interpersonal communications among employees. 2.Responsiveness to social and demographic changes. 3.Reduction of litigation and quicker resolution of disputes. 4.A climate of fairness and equality. 5.Greater productivity on complex tasks. 6.Increased sales, revenue, and profits. Another vital requirement when dealing with diversity is promoting a “safe” place for associate to communicate (Koonce, 2001). Social gathering and business meetings, where every member must listen and have the chance to speak, are good ways to create dialogues. Managers should implement policies such as mentoring programmes to provide associates access to information and opportunities. Also, associates should never be denied necessary, constructive, critical feedback for learning about mistakes and successes (Flagg, 2012). Fig. 1 Comprehensive Model of Diversity Management Comprehensive Model of Diversity Management (Pitts. 2005, p. 35) @ IJTSRD | Unique Paper ID – IJTSRD30283 | Volume – 4 | Issue – 3 | March-April 2020 Page 78
International Journal of Trend in Scientific Research and Development (IJTSRD) @ www.ijtsrd.com eISSN: 2456-6470 Cultural Synergy There is increasing awareness of the importance of organizational culture as not all organizations are aware. However, Wilderom, Glunk & Maslowski (2000), are increasing aware of the impact of organizational culture. Organizational culture or corporate culture comprises the attitudes, experiences, beliefs and values of an organization. It has been defined as ‘the specific collection of values and norms that are shared by people and groups in an organization and that control the way they interact with each other and with stakeholders outside the organization. Culture has three important functions; first, corporate culture is a deeply embedded form of social control that influences employee decisions and behavior. Culture is pervasive and operates unconsciously. It should be seen as an automatic pilot, directing employees in ways that are consistent with organizational expectations. Secondly, corporate culture is the ‘social glue’ that bonds people together and makes them feel part of the organizational experience. Employees are motivated to internalize the organization’s dominant culture because it fulfills their need for social identity. Finally, corporate culture assists the sense-making process. It helps employees understand organizational events. Employees can communicate more efficiently and reach higher levels of cooperation with each other because they share mental modes of reality (Mcshane & Glinow, 2000 in Ezigbo, 2011). Onodugo & Onodugo (2015), opined that socio cultural factors are those factors relating to both society and cultural matters. Socio cultural factors are the larger scale forces within cultures and society that affect the thoughts, feelings and behavior of individuals. Such factors include child rearing practices, cross cultural differences, cultural deprivation, cultural change, ethnic values, religion, family structure, kingship structure and regional differences. In Nigeria, socially accepted norms and expected family roles have a profound effect on the type of economic activities that women engage in the technologies available to them, the people and agencies with whom they can interact, the places they can visit, the time they have available and the control they can exert over their own resources such as capital (Sanusi, 2012). Kumar (2014), posits that socio-cultural factors are things that can affect our lifestyles as a society. They can have an influence on individual behaviours depending on one’s social values. Some of them could be religion, economic status, education, family, politics, cultural values etc. Nonetheless, several constraints are shared by both genders, women face additional obstacles which are deeply rooted socio cultural factors present in the regions’ business environment. Employees’ Engagement Employee engagement in today’s competitive world is a crucial driver for organizations success. The individual factors of employee engagement are also known as the drivers of employee engagement. There are increasing claims in management literature that engagement is needed for high-level organizational performance and productivity. For example the findings of many research works like (Harter, et al., 2002, Schaufeli & Bakker, 2004, Xanthopoulou et al., 2007; Fernandez., 2007, Bakker et al., 2007, Hewitt Associates., 2004, Hallberg, et al., 2007; Lewicka, 2011 & Saks, 2006) agrees that employee engagement could be a strong factor for organizational performance and success, as it seems to have a significant potential to affect employee retention, their loyalty and productivity, and also with some link to customer satisfaction, organizational reputation and the overall stakeholder value. Frank et al., (2004), defined employee engagement as emotional and intellectual commitment to the organization or the amount of discretionary effort exhibited by employees in their job. Harter et al., (2002), further defined employee engagement as “the individual’s involvement and satisfaction as well as enthusiasm for work”. Employee engagement is therefore the level of commitment and involvement an employee has towards his or her organization and its values. The construct of employee engagement is relatively new for HRM and appeared in the literature for nearly two decades (Robinson et al., 2005; Melcrum Publishing, 2005; Ellis & Sorensen, 2007). Saks (2006), & Roberts (2006), noted that engagement is most closely associated with the existing construct of job involvement and flow. International Survey Research (2003), described employee engagement as the practice by which a firm enhances the commitment and contribution of its human resources to achieve greater business outcomes. The International Survey Research resolved that employee engagement is a mixture of an employee’s cognitive, behavioral and affective dedication to his or her organization. Employee Promotion Promotion refers to change of rank within an organization. Rank, or grade level, differentiates among workers with respect to status, power, and salary; hence, any change in the determinants of promotion, as one move up the organizational ladder, would reveal how an individual's ultimate occupational achievement is patterned by particular background variables. For example, while race and gender may have little impact on advancement prospects in low salary grades, it has been suggested (e.g., Kanter 1977, Auster, 1988) that these personal attributes are significant factors in promotion decisions at higher levels. Few studies have examined how the determinants of promotion vary with organizational rank. Employees from different salary grades commonly are grouped together in an analysis (e.g., Wise 1975b; Bielby & Baron 1983; Medoff & Abraham 1980); in doing so it is implicitly assumed that the factors which influence advancement at one organizational level play a corresponding role at a different rank. Some exceptions are Rosenbaum (1979), DiPrete & Soule (1988), the former documented diverse age x @ IJTSRD | Unique Paper ID – IJTSRD30283 | Volume – 4 | Issue – 3 | March-April 2020 Page 79
International Journal of Trend in Scientific Research and Development (IJTSRD) @ www.ijtsrd.com eISSN: 2456-6470 education effects on the promotion rate for three occupational groups; the latter, in an analysis of gender and advancement, reported quite different results by salary grade level. In this article we examine the particular role of educational attainment in the promotion process. Theoretical Framework The study adopts the Organizational Culture Assessment Instrument (OCAI) theory which is based on Competing Values Framework developed by American researchers Kim S. Cameron and Robert E. Quinn (Cameron & Quinn, 2006). The purpose of the theory is to help understand organizational phenomena, such as organizational design, stages of life cycle development, organizational quality, leadership roles and management skills. Organizations are functioning in fast changing environment, which requires organizations to change as well. To be able to change, the organizations need to have and know their mission and vision. OCAI instrument does not include everything that can affect on organizational culture, it has been used in more than a thousand organizations and it has been found to predict the organizational performance. The theoretical model is based on several indicators of effectiveness, which differentiate from each other by two dimensions, hence forming four main clusters. First criteria of effectiveness emphasize flexibility, discretion, and dynamism from stability, order and control. The second dimension differentiates an internal orientation, integration and unity from external orientation, differentiation and rivalry. There are no rights or wrong answers. More important is that organization’s culture is in line with the organizational phenomena mentioned above. The answers indicate of what the employees think of being the contributors of efficiency. The elements like the age or size of the organization affect the answers. Respondents from different organizational units might give very different answers; hence they have different view of the culture in the organization. However, usually only one of the main clusters becomes more dominant than the others. Culture also changes over time without conscious efforts (Nummelin, 2006). Empirical Review Lo (2009), examined the relationship between leadership styles (focusing mainly on transformational and transactional leadership styles) and employees’ employee commitment in Malaysia using regression analysis and found that transformational leaders are more able to bring in commitment in employees than transactional leaders. Their finding indicates that transformational leaders have a more significant and stronger relationship with employee commitment. This implies that the leaders who give advices, supports, and pay attention to the individual needs of followers will enhance the level of employee commitment of the employees. Avolio (2004), examined the linkage between transformational leadership and employee commitment by focusing on psychological empowerment and structural distance using a sample of 520 staffs nurses employed by a large public hospital in Singapore. Their findings showed that there is a positive association between transformational leadership and employee commitment revealing that psychological empowerment medicated the relationship between transformational leadership and employee commitment. Akintayo (2010), investigated the impact of work-family role conflict on employee commitment of Industrial Workers in Nigeria using linear regression analysis and t-test and found that there was a significant but negative contribution of work- family role conflict to employee commitment. Based on this finding, he recommended that organizational support programme needs to be introduced and provided for all levels of workers in order to reduce the burden of work-family role conflict interface and virtually induced commitment to their jobs. He further stated that the level of family responsibilities of the workers need to be considered during recruitment, in assigning responsibilities and placement process in order to foster employee commitment. Ogbo, Kifordu & Wilfred (2014), carried out a research into the effect of workforce diversity on organizational performance of selected firms in Nigeria, with the identification of the poor policy framework, training failures and poor handling of specific goals as reflected in ineffective management of diversity in an organization. The study linked workforce diversity to customer related issues and profitability. Secondary data, interview and content analysis were used in the study with participants from selected brewing companies and a sample of 300 employees. The study concluded that workforce diversity is a modern critical success issue due to the broad based specialization. Deshwal & Choudhary (2012), examined workforce diversity management as the biggest challenge for 21st century managers. The study employed a survey of 120 employees from various organizations in information technology, production and the fast moving consumer goods sector in India. The findings reveal that diversity can be effectively managed with the commitment of top management to create value in the organizations through the processes of selection, placement, performance management, rewards and succession planning. Edewor & Aluko (2007), Managing Multiculturalism and organizational performance. They argued that Nigerian organizations should pay more attention to managing the increasing multiculturalism of their organizations in order to reap the benefits of managing diversity. They recognized that the task of truly managing diversity requires “cultural transformation,” that is, involving “comprehensive managerial processes for developing an environment that works for all employees.” This perspective is in line with international literature and is also supported by other local writers (Issa, 2011). This requires developing a strong organizational culture that includes deep knowledge of the organizational policies and objectives and shared values and beliefs. @ IJTSRD | Unique Paper ID – IJTSRD30283 | Volume – 4 | Issue – 3 | March-April 2020 Page 80
International Journal of Trend in Scientific Research and Development (IJTSRD) @ www.ijtsrd.com eISSN: 2456-6470 METHODS Research Design The study adopts survey research design. The survey research design is premised on the ground that the relationship between Diversity Management and Employee Engagement which is the main focus of the study can be measured quantitatively with the use of a questionnaire; thereby, allowing the test of hypotheses formulated and drawing inferences there from. The population of this study consists of all Public (Federal and State) and Private Universities in the North Central. Table1 List of Universities in North Central Nigeria States Universities University of Abuja Base University, Abuja Nigerian Turkish Nile University Veritas University Abuja African University of Science and Technology Federal University of Agriculture Makurdi Benue State University, Makurdi University of Mkar Federal University, Lokoja Kogi University, Anyigba Salem University, Lokoja University of Ilorin Kwara State University Landmark University, Umu-Aran Summit University Offa Crown Hill University Al-Hikmah University Federal University, Lafia Nasarawa State University, Keffi Bingham University, Auta Balifi Federal University of Technology, Minna. Ibrahim Badamasi University, Lapai. University of Jos Plateau State University, Bokkos However, the researcher selected states that have only one Federal University, State University and Private University. With this, three (3) states meet up with the condition of selection i.e. Benue, Kogi and Nasarawa States. The study population is based on this states that were selected for the study. Table2 Population of the Study States Universities Federal University of Agriculture Makurdi Benue State University, Makurdi University of Mkar Federal University, Lokoja Kogi State University, Anyigba Salem University, Lokoja Federal University, Lafia Nasarawa State University, Keffi Bingham University, Auta Balifi Sample Size and Sampling Techniques The study adopts the sample size by Yamane (1967) to draw adequate sample. The formula is given as thus; n=N1+N(e)2 Where; n = Sample size N = Population Size e= sample error of level of significance 1 = constant The Population of this study is N = 10,806, e = 5% Therefore, the sample size is: n = 10,780/1 + 10,780 (0.05)2 = 10,780/27 = 399.3 approximately, n = 399 Institution Type Federal Private Private Private Private Federal State Private Federal State Private Federal State Private Private Private Private Federal State Private Federal State Federal State Abuja Benue Kogi Kwara Nasarawa Niger Plateau Institution Type Federal State Private Federal State Private Federal State Private Benue Kogi Nasarawa @ IJTSRD | Unique Paper ID – IJTSRD30283 | Volume – 4 | Issue – 3 | March-April 2020 Page 81
International Journal of Trend in Scientific Research and Development (IJTSRD) @ www.ijtsrd.com eISSN: 2456-6470 Therefore, the sample size of 399 respondents was divided equally among the three states of north central comprises of Benue state 133, Kogi state 133 and Nasarawa state 133 to ensure objective comparisms. Sampling Technique The sampling technique was judgmentally determined and distributed to the staff of the universities of concentration. Data Analyses Techniques The descriptive statistics was used while the respondents’ responses were interpreted using mean score of rating. The mean average is 3 (5 + 4 + 3 + 2 + 1 = 15/5 = 3). Any mean equals to 3 and above shows an agreement with the question while any mean below 3 shows a disagreement with the question. Responses to the questionnaire shall be ranked across a five (5) point Likert scale of Strongly Agree (SA), Agree (A), Undecided (UD), Disagree (D) Strongly Disagree (SD). Statistical Package for Social Sciences (SPSS) version 22.0 was used to analyze the data while Kruskal Wallis test was used to compare the mean variance of the institutions and test all the null hypotheses formulated. ANALYSIS OF DATA Analysis of the data was based on the questionnaire administered to the respondents to analyze the bio data, the research objectives and to test the null hypotheses formulated. Table3 Questionnaire Distribution and Response Rate Questionnaire Number Percentage % Retrieval and usable Not Retrieved Total Distribution Source: Field Survey, 2019. Table4 Gender of Respondents Category Frequency Percentage % Male Female Total Source: Field Survey, 2019. Table5 Cadre of Respondents Cadre Number Percentage % Teaching Staff 250 Non-Teaching Staff 128 Total 378 Source: Field Survey, 2019. Table 6 Comparative views of the respondents regarding the differences in the nature of relationship between cultural synergy and employees’ promotion among universities in north central Nigeria. Descriptive Statistics Overall Mean (St. Dev.) 1.My institution does not consider ethnic nationality in its promotion processes. (1.17206) 2.My institution is not religious bias when it comes to promotion exercise. (1.19664) 3.My institution promotes the share of cultural synergy as a form of knowledge spread. 4.Diversified cultures are highly promoted in my institution. (1.35581) 5.My institutional growth is acquainted to cultural and promotional system. (1.29987) 6.Our institutional culture uses promotion to frustrate staffs who are active unionist. 7.Additional qualification is a cultural synergy which give room for staff promotion. Source: Researcher’s Computation Using SPSS 22.0 Version 378 21 399 95 05 100 264 114 378 70 30 100 Gender 66 34 100 Federal Mean (St. Dev.) 4.1905 (1.07118) 3.9365 (1.23123) State Mean (St. Dev.) 3.7222 (1.34247) 3.9603 (1.22899) Private Mean (St. Dev.) 4.2857 (1.01868) 4.0317 (1.16575) Mean Statements Difference 4.0476 No 3.9921 No 3.9603 (1.23548) 4.1032 (1.17867) 4.0079 (1.17641) 3.7540 (1.31871) No 3.7778 4.2540 (.99548) 4.2381 (1.00740) 3.4444 (1.46727) 3.8640 (1.38158) 3.6190 (1.43587) 3.6746 (1.39616) No 3.9206 No 4.0079 (1.16959) 4.2063 (1.03782) 4.4048 (.71754) 3.4240 (1.41001) No 3.9921 (1.22961) 4.2222 (1.04222) 4.0079 (1.20330) 3.7619 (1.38234) No @ IJTSRD | Unique Paper ID – IJTSRD30283 | Volume – 4 | Issue – 3 | March-April 2020 Page 82
International Journal of Trend in Scientific Research and Development (IJTSRD) @ www.ijtsrd.com eISSN: 2456-6470 Discussion of Results The results in table 6 show that there is no difference in the mean of federal, state and private universities in their views as they agreed that their institutions do not consider ethnic nationality in its promotion processes as all their mean values are above the average mean of 3.00 as indicated by the mean values of 4.1905, 3.7222 and 4.2857 respectively. The results also shows that there is no difference in the mean of federal, state and private universities views as they all agreed that their institutions are not religious bias when it comes to promotion exercise as indicated by all their mean values of 3.9365, 3.9603 and 4.0317 respectively which are all above the average mean of 3.00. The results in table above further show that there is no difference in the mean of federal, state and private universities views as they all agreed that their institutions promote the share of cultural synergy as a form of knowledge spread as indicated by all their mean values of 4.1032, 4.0079 and 3.7540 respectively which are all above the average mean of 3.00. The results in table above also show that there is no difference in the mean of federal, state and private universities views as they all agreed that their diversified cultures are highly promoted in their institutions as indicated by all their mean values of 4.2540, 3.4444 and 3.6190 respectively which are all above the average mean of 3.00. The results in table above show that there is no difference in the mean of federal, state and private universities views as they all agreed that their institutional growth is acquainted to cultural promotion system as indicated by all their mean values of 4.2381, 3.8640 and 3.6746 respectively which are all above the average mean of 3.00. The results in table further show that there is no difference in the mean of federal, state and private universities views as they all agreed that their institutional culture uses promotion to frustrate staffs who are active unionist as indicated by all their mean values of 4.2063, 4.4048 and 3.4240 respectively which are all above the average mean of 3.00. The results in table above finally show that there is no difference in the mean of federal, state and private universities views as they all agreed that the additional qualifications are cultural synergy which give room for staff promotion as indicated by all their mean values of 4.2222, 4.0079 and 3.7619 respectively which are all above the average mean of 3.00. Test of Hypotheses H0: There is no significant difference in the nature of relationship between cultural synergy and employee promotion among universities in north central Nigeria. Table7 Kruskal Wallis test of Hypotheses Federal Chi-Square (Sig.) State Private Chi-Square (Sig) Significant Chi-Square (Sig.) Statements Difference 1.My institution does not consider ethnic nationality in its promotion processes. 101.861 (0.00) No 110.407 (0.00) 97.295 (0.00) 2.My institution is not religious bias when it comes to promotion exercise. 123.675 (0.00) 121.757 (0.00) No 119.566 (0.00) 3.My institution promotes the share of cultural synergy as a form of knowledge spread. 121.808 (0.00) 109.440 (0.00) No 109.665 (0.00) 4.Diversified cultures are highly promoted in my institution. 105.840 (0.00) 116.506 (0.00) No 97.732 (0.00) 5.My institutional growth is acquainted to cultural promotion, system. 6.Our institutional culture uses promotion to frustrate staffs who are active unionist. No 107.000 (0.00) 120.854 (0.00) 108.896 (0.00) 104.229 (0.00) 96.575 (0.00) 94.905 (0.00) No 7.Additional qualification is a cultural synergy which gives room for staff promotion. 124.859 (0.00) 111.707 (0.00) No 108.070 (0.00) Source: Researcher’s Computation Using SPSS 22.0 Version The result from table 7 above shows that all the significance levels are within 1%, indicating that there is no significant difference in the nature of relationship between cultural synergy and employee promotion among universities in north central Nigeria. Based on this, the null hypotheses is accepted. Summary of Findings Data was generated using questionnaire and formulated hypotheses were tested using Kruskal Wallis test. The study revealed that there is no significant difference in the nature of relationship between cultural synergy and employee promotion among universities in north central Nigeria. Conclusion In line with the above findings, the study concludes that in comparing views of the respondents regarding to differences in the nature of relationship between cultural synergy and employees’ promotion among universities in north central Nigeria is attracted with strictness to work punctuality, @ IJTSRD | Unique Paper ID – IJTSRD30283 | Volume – 4 | Issue – 3 | March-April 2020 Page 83
International Journal of Trend in Scientific Research and Development (IJTSRD) @ www.ijtsrd.com eISSN: 2456-6470 [10]Cameron, K. S. & Quinn, R. E. (2006). Diagnosing and Changing Organizational Culture. Revised Edition, Jossey-Bass, US. First published by Addison-Wesley in 1999. [11]Davidson, M. J. & Fielden, S. L. (2003). Individual Diversity and Psychology in Organizations. John Wiley & Sons Ltd. The Atrium, Southern Gate, Chichester, West Sussex PO19 8SQ, England. disciplinary committee on organizational and administrative obsolesces, special packages are also attracted to employees as reward management system. Recommendation 1.It is recommended that there is no difference in the mean of federal, state and private universities in their views regarding their institutions ethnic nationality in its promotion processes. 2.That there is no sentiment as to religious bias when it comes to promotion exercise. 3.That they promote the share of cultural synergy as a form of knowledge spread. 4.That diversified cultures are highly promoted and institutional growth is acquainted to cultural promotion system, 5.Finally, institutional culture uses promotion to frustrate staffs and additional qualifications are cultural synergy which gives room for staff promotion, since it’s all have an average mean value of above 3.00. References [1] Adeleye, I., Aja-Nwachukwu, F. & Fawehinmi, Y. (2012). Managing Diversity in Nigeria: the chevron way. Human Resource Management Journal of the CIPMN 4(1):1-13. [2] Akinnusi, D. M., Sonubi, O., & Oyewunmi, A. E. (2017). Fostering Effective Workforce Diversity Management. International Review of Management and Marketing in Nigerian Organizations: The Challenge of Human Resource Management, 7(2), 108-116. [12]Deshwal, M. P., & Choudhary, D. S. (2012). Workforce diversity management: Biggest challenge for 21ST century managers. Multidisciplinary Research, 2 (4). [13]Dwyer, S., Richard, O.C. & Chadwick, K. (2003). Gender diversity in management and firm performance: the influence of growth orientation and organizational culture. Journal of Business Research, 56:1009–19. International Journal of [14]Edewor, P. A. & Aluko, Y. A. (2007). Diversity Management, Challenges and Opportunities in Multicultural Organizations. International Journal of the Diversity, 6(6):186-195. [15]Ellis, C. M. and A. Sorensen (2007). Assessing Employee Engagement: The Key to Improving Productivity. Perspectives: The Segal Group publication, Inc., pp: 15. [16]Ezigbo, C. A. (2007). “Managing Subordinates for Effectiveness in Nigerian University System.” International Research Journal for Development; January - April, 9(1). [17]Ezigbo, C. A. (2011). Advanced Management Theory and Application; 3rd ed. Enugu: Immaculate Publications Limited. [18]Farrer, J. (2004). “A Practical Approach to Diversity.” Industrial and Commercial Training, 36(4), 175-177. [19]Fernandez, C.P. (2007). “Employee Engagement.” Journal of Public Health Management and Practice. [20]Frank et al. (2004). “Assessing Employee Engagement: The Key to Improving Productivity.” Perspectives, 15(1). The Segal Group, Inc. Endres G. M., and Mancheno Smoak L. (2008). [3] Akintayo D.I. (2010). Work-Family Role Conflict and Organizational Commitment Among Industrial Workers in Nigeria. Journal of Psychology and Counselling. 2(1), Pp.1-8. [4] Ali I., Rehman K., Ali S. I., Yousaf J. & Zia M. (2010). Corporate Social Responsibility Influences, Employee Commitment and Organizational Performance. African Journal of Business Management. 4(12), Pp.2796- 2801. [5] Ali, R., & Ahmed, M. S. (2009). “The Impact of Reward and Recognition Programs on Employee’s Motivation and Satisfaction: An Empirical Study.” International Review of Business Research Papers, 5(4), 270-279. [21]Frank, A. T. (2013). When memory fails, intuition reigns. Department of Psychology. Journal University of Colorado Boulder. 1(8), 7-9. [22]Flagg, A. (2012). Managing Diverse Workforce groups successfully. United Behavioral Health Website Available on the World Wide Web at http://www. Ubinet.com [6] Avolio (2004). Transformational Leadership and Organizational Commitment Mediating Psychological Empowerment and Moderating Role of Structural Distance. Behavior, 25, 951-968. Published online in wiley Inter Science (www.interscience.wiley.com)DOI:10.1002/job.283 Role of Journal of Organizational [23]George, T. (2014). Cultural Diversity in the Workplace Issues and Strategies. Westport: Praeger Publisher. [24]George, O.J. & Akaighe, G.O. (2017). Cultural Diversity and work Engagement in Nigerian civil service. Journal of Economics and Business Research, ISSN: 2068-3537, E- ISSN (Online) 2069-9476, ISSN-L= 2068-3537, Year XXIII, 1:59-78. [25]Gupta, R. (2013). Organizational Performance. International Journal of Business and Management Invention, 2(6); 36-41. [7] Bakker, A. B. & Demerouti, E. (2007). “The Job Demands-Resources Model: State of the Art.” Journal of Managerial Psychology, 22: 309-32. [8] Bergen, C. W., Von, B. S., & Teresa F. (2002). Un- intended Negative Effects of Diversity Management. Public Personnel Management, 31(2), 239-251. Workforce Diversity and [9] Bielby, W., & Baron, J. (19983). Organization, technology and worker attachment to the firm. Research in Social Stratification and mobility. 2, 77- 113. [26]Hallberg, U. E. and W. B. Schaufeli (2006). “Same but Different? Can Work Engagement be Discriminated @ IJTSRD | Unique Paper ID – IJTSRD30283 | Volume – 4 | Issue – 3 | March-April 2020 Page 84
International Journal of Trend in Scientific Research and Development (IJTSRD) @ www.ijtsrd.com eISSN: 2456-6470 [42]Meyer, J. & Allen, N. (1991). A Three-Component Conceptualization of Organizational Commitment. Human Resources Management Review. 1, PP.61-89. [43]Meyer, P. J., & Allen, J.N. (1984). Testing the Side-Bet Theory of Organizational Commitment: Some Methodological Considerations. Journal of Applied Psychology. 69, Pp.372-374. [44]Miller, F. A., & Katz, J.H. (2002). The inclusion breakthrough: Unleashing the real power of diversity. San Francisco, CA: Berrett-Koehler. from Commitment?” European Psychologist, 11: 119-127. Job Involvement and Organizational [27]Harter, J. K., F. L. Schmidt & T. L. Hayes (2002). “Business-unit-level Relationship between Employee Satisfaction, Employee Engagement and Business Outcomes: A Meta-analysis. I.” Applied Psychol., 87: 268-279. [28]Hays-Thomas, R. (2010). The Contemporary Focus of Managing Diversity: In Psychology and Management of Workplace Diversity, Edited by Margaret S. Stockdale & Faye J. Crosby. Madden, MA: Blackwell Publishing. 3- 30. [29]Hewitt Associates (2004). “Employee Engagement at Double-digit Growth Companies”, Research Brief. [30]International Survey Research (2003). Engaged Employee Drives the Bottom Line. Research Summary. Chicago, Illinois, 10-35. [31]Jackson, E. S. (2013). Journal of Management: Domain of the present. www.researchgate.net. [32]Jackson, E. S. Joshi, A., & Erhardt, L. N. (2003). Recent Research on Team & Organizational Diversity: SWOT Analysis and implications, Journal of Management, 29:801–830. [33]Kanter, R. M. (2013). The Change Masters. New York: Simon and Schuster. [34]Kanter, R.M. (1977). Men and Women of the Corporation. Basic Books, New York. [45]Miller, F.A., & Katz, J.H. (2018). Safe enough to SOAR: Accelerating trust, inclusion, and collaboration in the workplace. San Francisco, CA: Berrett- Koehler. [46]Mullins, L. J. (2010). Management and Organizational Behaviour (9th ed.). England: Pearson Education Ltd. [47]Naik, P. (2013). Challenge for Business Survival – Managing Workforce Diversity. 7th International Business Research Conference Indian Education Society's Management Centre. IOSR Journal of Business and Management (IOSR JBM) e-ISSN: 2278-487X, p-ISSN: 2319-7668 Pp. 09-12 www.iosrjournals.org College and Research [48]Nummelin, J. (2006). Uncertainty management concerning cultural dynamics in project management - case study. Project Perspectives, (1), 79-85. [49]Nwinami, S. J. (2014). An Assessment of the Effect of Workforce Diversity on Employee Performance at Tanesco. Mzumbe: Master's Thesis. Retrieved 2017, from http://scholar.mzumbe.ac.tz/bitstream/handle/1119 2/644/MSc_MPA_Stella%20J%20Mwinami_2014.pdf? sequence=1119 [50]Ogbo, A. I., Anthony, K. A., & Ukpere, W. I. (2014). The Effect of Workforce Diversity on Performance of Selected Mediterranean Journal of Retrieved http://www.richtmann.org/journal/index.php/mjss/ article/view/2886 [35]Khan M.R., Ziauddin, Jam F.A. and Ramay M.I. (2010. The Impacts of Organizational Commitment on Employee Job Performance. European Journal of Social Sciences. 15(3), Pp. 292-298 [36]Koonce, R. (2001). Redefining Diversity. It’s not just the right thing to do; it is also makes sense. Training and Development, Workplace Trends Press, Starbucks. [37]Kundu, S. C., Mor, A., & Ranga, P. (2014). Receptivity of Diverse Workforce by Employers Study of Indian IT industry” In S.C. Kundu, B. K. Punia, V.P. Sheera, R, Kumar, (Ed.), “Researches in Business and Management.” Academic and Professional Perspective, New Delhi: Wisdom Publications, Pp.132- 139. [38]Lewicka, D. (2011). “Creating Innovative Attitudes in an Organization-Comparative Analysis of Tools Applied in IBM Poland and ZPAS Group.” Journal of Asia Pacific Business Innovation and Technology Management, Vol. 1, No. I, pp.1-12. [39]Lo M., Ramayah T. & Min H.W. (2009). Leadership styles and Organizational Commitment: A Test on Malaysia Manufacturing Industry. African Journal of Marketing Management. 1(6), Pp.133 good business Organizational Firms in Social Sciences, 5(10), 231. Nigeria. from and Employees: A [51]Oguegbulam, R. C., Onuoha, B. C. & Nwede, I. (2017). Workforce Diversity and Employee Retention in Deposit Money Banks Port Harcourt, River State. International Journal Research/Social & Management Sciences/ www. Ijaar.org ISSN: 2488-9849. 3(8), 121-139. [52]Ongori H. (2007). A Review of the Literature on Employee Turnover. African Journal of Business Management. PP. 49-54. [53]Onodugo, V. A. Ugwuonah, G. E., & Ebinne E. S. (2010). Social Sciencee Research, Principle, Method and Applications. Enugu: EI ‘Demark Publisher. [54]Onodugo, V. & Onodugo, C. I. (2015).The impact of socio-cultural factors on entrepreneurial development in Nigeria. African Educational Research Journal, 3(4): 246-254. [55]Pitts, D. W. (2005). “Modeling the Impact of Diversity Management.” Working Paper 06-18 August. Andrew Young School of Policy Studies Research Paper Series. of Advanced Academic [40]McGregor, D. (1960). The Human Side of Enterprise. McGraw-Hill Book Co., New York. [41]Melcrum Publishing (2005). “Employee Engagement: How to Build a High-performance Workforce.” An Independent Melcrum Research Report Executive Summary. @ IJTSRD | Unique Paper ID – IJTSRD30283 | Volume – 4 | Issue – 3 | March-April 2020 Page 85
International Journal of Trend in Scientific Research and Development (IJTSRD) @ www.ijtsrd.com eISSN: 2456-6470 [56]Pitts, D. W. (2009). “Diversity Management, Job Satisfaction, and Performance: Evidence Federal Agencies.” Public Administration Review, 69(2), 328-338. [57]Richard, O. C. (2000). “Racial Diversity, Business Strategy and Firm Performance: A Resource Based View.” Hong Kong. Academy of Management Journal, 43(2), 164-177. [66]Shastri, P. C., Shastri, J. P., & Shastri, D. (2010). Research in child and adolescent psychiatry in India. Indian J Psychiatry; 52, Suppl S3:219-23 [67]Ugwuzor, M. (2011). Management in Nigerian Firms: The Interplay of from US Workforce Diversity [68]Workforce Culture. Journal of Educational Research, 5(2), 1-8. [69]Wise, D. A. (1975). Academic Achievement and Job Performance. American Economic Review, June, 350- 365. [70]Xanthopoulou, D., A. B. Bakker, E. Demerouti & W. B. Schaufeli (2009). “Reciprocal Relationships between Job Resources, Personal Resources and Work Engagement.” Journal of Vocational Behaviour, 74: 235-244. APPENDIX I QUESTIONNAIRE SECTION A: Demographic Information INSTRUCTION:Please read and tick [] as appropriate in the provided boxes, your exact assessment of the following demographic information: 1.Name of institution _________________________________________? 2. Gender? (a) Male (b) Female 3. Cadre of Respondents (a) Teaching Staff (b) Non-Teaching Staff SECTION B: INSTRUCTION: Please indicate your views about the statements by ticking the option which most closely represents your opinion. Use the responses of the following keys: 5 = Strongly Agree (SA), 4 = Agree (A), 3 = Neutral (N), 2 = Disagree (D), 1 = Strongly Disagree (SD). [58]Richard, O. C., & Miller, C. D. (2013). Considering Diversity as a Source of Competitive Advantage in Organizations, in Q.M. Roberson (Ed.), “The Oxford Handbook of Diversity and Work”. New York: Oxford University Press. [59]Richard, O. C., Barnett, T., Dwyer, S., & Chadwick, K. (2004). “Cultural Diversity in Management, Firm Performance, and the Entrepreneurial Orientation Dimensions.” Academy of Management Journal, 47(2), 25 5-266. [60]Robinson, D., S. Perryman and S. Hayday (2004). “The Drivers of Employee Engagement, Brighton.” Institute of Employment Studies. Moderating Role of [61]Robinson, I. (2006). Human Resource Management in Organizations. London, CIPD. [62]Roberts, J. V. (2006). Employee Engagement and Commitment: A Guide to Understanding, Measuring and Increasing Engagement in your Organization. US: SHRM Foundation. [63]Saks, A. M. (2006). “Antecedents and Consequences of Employee Engagement.” Managerial Psychology, 21: 600-619. [64]Schaufeli, W. B., & Bakker, A. B. (2004). Job demands, job resources, and their relationship with burnout and engagement: A multi-sample study. Journal of Organizational Behavior, doi:10.1002/job.248 [65]Schaufeli, W.B., A.B. Bakker & M. Salanova (2006). “The Measurement of Work Engagement with a Short Questionnaire: A Cross-national Study.” Educational Psychological Measure. 66: 701-716. [ ] [ ] [ ] [ ] 25, 293-437. Diversity Management and Employees Engagement Cultural Synergyand Employees Promotion S/N 1 My institution does not consider ethnic Nationality in its promotion processes. 2 My institution is not religious bias when it comes to promotion exercise. 3 My institution promotes the share of cultural synergy as a form of knowledge spread. 4 Diversified cultures are highly promoted in my institution. 5 My institutional growth is acquainted to cultural promotion system. 6 Our institutional culture uses promotion to frustrate staffs who are active unionist. 7 Additional qualification is a cultural synergy which gives room for staff promotion. (1) My institution does not consider ethnic Nationality in its promotion processes. Questions SA 5 A 4 N 3 D 3 SD 1 Federal Frequency Percent Valid Percent Cumulative Percent 6 4.8 4.8 8 6.3 6.3 2 1.6 1.6 50 39.7 39.7 60 47.6 47.6 126 100.0 100.0 Strongly disagree Disagree Neutral Agree Strongly agree Total 4.8 11.1 12.7 52.4 100.0 Valid @ IJTSRD | Unique Paper ID – IJTSRD30283 | Volume – 4 | Issue – 3 | March-April 2020 Page 86
International Journal of Trend in Scientific Research and Development (IJTSRD) @ www.ijtsrd.com eISSN: 2456-6470 State Frequency Percent Valid Percent Cumulative Percent 10 7.9 7.9 24 19.0 19.0 3 2.4 2.4 43 34.1 34.1 46 36.5 36.5 126 100.0 100.0 Private Frequency Percent Valid Percent Cumulative Percent 5 4.0 4.0 7 5.6 5.6 1 .8 .8 47 37.3 37.3 66 52.4 52.4 126 100.0 100.0 Overall Mean Frequency Percent Valid Percent Cumulative Percent 7 5.6 5.6 13 10.3 10.3 2 1.6 1.6 49 38.9 38.9 55 43.7 43.7 126 100.0 100.0 Strongly disagree Disagree Neutral Agree Strongly agree Total 7.9 27.0 29.4 63.5 100.0 Valid Strongly disagree Disagree Neutral Agree Strongly agree Total 4.0 9.5 10.3 47.6 100.0 Valid Strongly disagree Disagree Neutral Agree Strongly agree Total 5.6 15.9 17.5 56.3 100.0 Valid (2) My institution is not religious bias when it comes to promotion exercise. Federal Frequency Percent Valid Percent Cumulative Percent 10 7.9 7.9 11 8.7 8.7 6 4.8 4.8 49 38.9 38.9 50 39.7 39.7 126 100.0 100.0 State Frequency Percent Valid Percent Cumulative Percent 10 7.9 7.9 10 7.9 7.9 7 5.6 5.6 47 37.3 37.3 52 41.3 41.3 126 100.0 100.0 Private Frequency Percent Valid Percent Cumulative Percent 8 6.3 6.3 10 7.9 7.9 5 4.0 4.0 50 39.7 39.7 53 42.1 42.1 126 100.0 100.0 Overall Mean Frequency Percent Valid Percent 9 7.1 10 7.9 6 4.8 49 38.9 52 41.3 126 100.0 Strongly disagree Disagree Neutral Agree Strongly agree Total 7.9 16.7 21.4 60.3 100.0 Valid Strongly disagree Disagree Neutral Agree Strongly agree Total 7.9 15.9 21.4 58.7 100.0 Valid Strongly disagree Disagree Neutral Agree Strongly agree Total 6.3 14.3 18.3 57.9 100.0 Valid Cumulative Percent 7.1 15.1 19.8 58.7 100.0 Strongly disagree Disagree Neutral Agree Strongly agree Total 7.1 7.9 4.8 38.9 41.3 100.0 Valid @ IJTSRD | Unique Paper ID – IJTSRD30283 | Volume – 4 | Issue – 3 | March-April 2020 Page 87
International Journal of Trend in Scientific Research and Development (IJTSRD) @ www.ijtsrd.com eISSN: 2456-6470 (3) My institution promotes the share of cultural synergy as a form of knowledge spread. Federal Frequency Percent Valid Percent Cumulative Percent 8 6.3 6.3 10 7.9 7.9 3 2.4 2.4 45 35.7 35.7 60 47.6 47.6 126 100.0 100.0 State Frequency Percent Valid Percent Cumulative Percent 8 6.3 6.3 11 8.7 8.7 5 4.0 4.0 50 39.7 39.7 52 41.3 41.3 126 100.0 100.0 Private Frequency Percent Valid Percent Cumulative Percent 11 8.7 8.7 18 14.3 14.3 8 6.3 6.3 43 34.1 34.1 46 36.5 36.5 126 100.0 100.0 Overall Mean Frequency Percent Valid Percent Cumulative Percent 9 7.1 7.1 13 10.3 10.3 5 4.0 4.0 46 36.5 36.5 53 42.1 42.1 126 100.0 100.0 Strongly disagree Disagree Neutral Agree Strongly agree Total 6.3 14.3 16.7 52.4 100.0 Valid Strongly disagree Disagree Neutral Agree Strongly agree Total 6.3 15.1 19.0 58.7 100.0 Valid Strongly disagree Disagree Neutral Agree Strongly agree Total 8.7 23.0 29.4 63.5 100.0 Valid Strongly disagree Disagree Neutral Agree Strongly agree Total 7.1 17.5 21.4 57.9 100.0 Valid (4) Diversified cultures are highly promoted in my institution. Federal Percent 3.2 6.3 1.6 39.7 49.2 100.0 State Frequency 4 8 2 50 62 126 Valid Percent 3.2 6.3 1.6 39.7 49.2 100.0 Cumulative Percent 3.2 9.5 11.1 50.8 100.0 Strongly disagree Disagree Neutral Agree Strongly agree Total Valid Frequency Percent Valid Percent Cumulative Percent 17 13.5 13.5 28 22.2 22.2 3 2.4 2.4 38 30.2 30.2 40 31.7 31.7 126 100.0 100.0 Private Frequency Percent Valid Percent 16 12.7 12.7 20 15.9 15.9 6 4.8 4.8 38 30.2 30.2 46 36.5 36.5 126 100.0 100.0 Strongly disagree Disagree Neutral Agree Strongly agree Total 13.5 35.7 38.1 68.3 100.0 Valid Cumulative Percent 12.7 28.6 33.3 63.5 100.0 Strongly disagree Disagree Neutral Agree Strongly agree Total Valid @ IJTSRD | Unique Paper ID – IJTSRD30283 | Volume – 4 | Issue – 3 | March-April 2020 Page 88
International Journal of Trend in Scientific Research and Development (IJTSRD) @ www.ijtsrd.com eISSN: 2456-6470 Overall Mean Frequency Percent Valid Percent Cumulative Percent 12 9.5 9.5 19 15.1 15.1 3 2.4 2.4 43 34.1 34.1 49 38.9 38.9 126 100.0 100.0 Strongly disagree Disagree Neutral Agree Strongly agree Total 9.5 24.6 27.0 61.1 100.0 Valid (5) My institutional growth is acquainted to cultural promotion system. Federal Frequency Percent Valid Percent Cumulative Percent 5 4.0 4.0 6 4.8 4.8 4 3.2 3.2 50 39.7 39.7 61 48.4 48.4 126 100.0 100.0 State Frequency Percent Valid Percent Cumulative Percent 15 11.9 12.0 11 8.7 8.8 5 4.0 4.0 39 31.0 31.2 55 43.7 44.0 125 99.2 100.0 1 .8 126 100.0 Private Frequency Percent Valid Percent Cumulative Percent 15 11.9 11.9 17 13.5 13.5 8 6.3 6.3 40 31.7 31.7 46 36.5 36.5 126 100.0 100.0 Overall Mean Frequency Percent Valid Percent Cumulative Percent 12 9.5 9.5 11 8.7 8.7 6 4.8 4.8 43 34.1 34.1 54 42.9 42.9 126 100.0 100.0 Strongly disagree Disagree Neutral Agree Strongly agree Total 4.0 8.7 11.9 51.6 100.0 Valid Strongly disagree Disagree Neutral Agree Strongly agree Total System Total 12.0 20.8 24.8 56.0 100.0 Valid Missing Strongly disagree Disagree Neutral Agree Strongly agree Total 11.9 25.4 31.7 63.5 100.0 Valid Strongly disagree Disagree Neutral Agree Strongly agree Total 9.5 18.3 23.0 57.1 100.0 Valid (6) Our institutional culture uses promotion to frustrate staffs who are active unionist. Federal Frequency Percent Valid Percent Cumulative Percent 5 4.0 4.0 8 6.3 6.3 3 2.4 2.4 50 39.7 39.7 60 47.6 47.6 126 100.0 100.0 Strongly disagree Disagree Neutral Agree Strongly agree Total 4.0 10.3 12.7 52.4 100.0 Valid @ IJTSRD | Unique Paper ID – IJTSRD30283 | Volume – 4 | Issue – 3 | March-April 2020 Page 89
International Journal of Trend in Scientific Research and Development (IJTSRD) @ www.ijtsrd.com eISSN: 2456-6470 State Frequency Percent Valid Percent Cumulative Percent 1 .8 .8 3 2.4 2.4 2 1.6 1.6 58 46.0 46.0 62 49.2 49.2 126 100.0 100.0 Private Frequency Percent Valid Percent Cumulative Percent 15 11.9 12.0 28 22.2 22.4 6 4.8 4.8 41 32.5 32.8 35 27.8 28.0 125 99.2 100.0 1 .8 126 100.0 Overall Mean Frequency Percent Valid Percent Cumulative Percent 7 5.6 5.6 13 10.3 10.3 4 3.2 3.2 50 39.7 39.7 52 41.3 41.3 126 100.0 100.0 Strongly disagree Disagree Neutral Agree Strongly agree Total .8 3.2 4.8 50.8 100.0 Valid Strongly disagree Disagree Neutral Agree Strongly agree Total System Total 12.0 34.4 39.2 72.0 100.0 Valid Missing Strongly disagree Disagree Neutral Agree Strongly agree Total 5.6 15.9 19.0 58.7 100.0 Valid (7) Additional qualification is a cultural synergy which gives room for staff promotion. Federal Frequency Percent Valid Percent Cumulative Percent 6 4.8 4.8 6 4.8 4.8 3 2.4 2.4 50 39.7 39.7 61 48.4 48.4 126 100.0 100.0 State Frequency Percent Valid Percent Cumulative Percent 8 6.3 6.3 12 9.5 9.5 6 4.8 4.8 45 35.7 35.7 55 43.7 43.7 126 100.0 100.0 Strongly disagree Disagree Neutral Agree Strongly agree Total 4.8 9.5 11.9 51.6 100.0 Valid Strongly disagree Disagree Neutral Agree Strongly agree Total 6.3 15.9 20.6 56.3 100.0 Valid @ IJTSRD | Unique Paper ID – IJTSRD30283 | Volume – 4 | Issue – 3 | March-April 2020 Page 90
International Journal of Trend in Scientific Research and Development (IJTSRD) @ www.ijtsrd.com eISSN: 2456-6470 Private Frequency Percent Valid Percent Cumulative Percent 14 11.1 11.1 16 12.7 12.7 6 4.8 4.8 40 31.7 31.7 50 39.7 39.7 126 100.0 100.0 Overall_Mean Frequency Percent Valid Percent Cumulative Percent 9 7.1 7.1 12 9.5 9.5 5 4.0 4.0 45 35.7 35.7 55 43.7 43.7 126 100.0 100.0 Strongly disagree Disagree Neutral Agree Strongly agree Total 11.1 23.8 28.6 60.3 100.0 Valid Strongly disagree Disagree Neutral Agree Strongly agree Total 7.1 16.7 20.6 56.3 100.0 Valid @ IJTSRD | Unique Paper ID – IJTSRD30283 | Volume – 4 | Issue – 3 | March-April 2020 Page 91