Download
1 / 6
60 likes | 210 Vues
A scientometric analysis is an effective method to increase the scope of library and information studies. The research articles presented have been revised to highlight the research done in the library and information studies area and to enable readers to read more information. In this research, a total of 9 volumes, 36 issues, 713 articles, and 8956 citations, etc, published in the International Journal of Library and Information Studies from 2011 to 2019 were referred for scientometric analysis. It shows the annual growth of published articles, authors distributions, geographical distribution, citations distribution, Degree of Collaboration, Etc. In a changing age, this study will certainly be useful to track the research literature available to expand the scope of library and information studies and to make transparent research. Narwade Mukesh Ramesh "Scientometric Analysis of Library and Information Studies" Published in International Journal of Trend in Scientific Research and Development (ijtsrd), ISSN: 2456-6470, Volume-4 | Issue-4 , June 2020, URL: https://www.ijtsrd.com/papers/ijtsrd30857.pdf Paper Url :https://www.ijtsrd.com/home-science/other/30857/scientometric-analysis-of-library-and-information-studies/narwade-mukesh-ramesh<br>

E N D
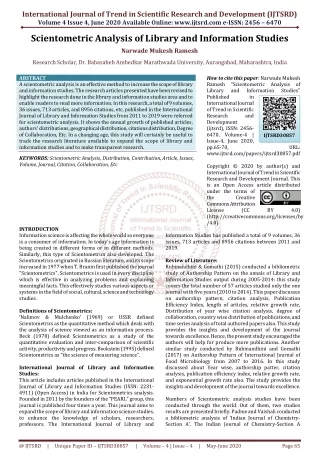
International Journal of Trend in Scientific Research and Development (IJTSRD) Volume 4 Issue 4, June 2020 Available Online: www.ijtsrd.com e-ISSN: 2456 – 6470 Scientometric Analysis of Library and Information Studies Narwade Mukesh Ramesh Research Scholar, Dr. Babasaheb Ambedkar Marathwada University, Aurangabad, Maharashtra, India ABSTRACT A scientometric analysis is an effective method to increase the scope of library and information studies. The research articles presented have been revised to highlight the research done in the library and information studies area and to enable readers to read more information. In this research, a total of 9 volumes, 36 issues, 713 articles, and 8956 citations, etc, published in the International Journal of Library and Information Studies from 2011 to 2019 were referred for scientometric analysis. It shows the annual growth of published articles, authors' distributions, geographical distribution, citations distribution, Degree of Collaboration, Etc. In a changing age, this study will certainly be useful to track the research literature available to expand the scope of library and information studies and to make transparent research. KEYWORDS: Scientometric Analysis, Distribution, Contribution, Article, Issues, Volume, Journal, Citation, Collaboration, Etc How to cite this paper: Narwade Mukesh Ramesh "Scientometric Analysis of Library and Information Published in International Journal of Trend in Scientific Research and Development (ijtsrd), ISSN: 2456- 6470, Volume-4 | Issue-4, June 2020, pp.65-70, www.ijtsrd.com/papers/ijtsrd30857.pdf Copyright © 2020 by author(s) and International Journal of Trend in Scientific Research and Development Journal. This is an Open Access article distributed under the terms of the Creative Commons Attribution License (CC (http://creativecommons.org/licenses/by /4.0) Studies" IJTSRD30857 URL: BY 4.0) INTRODUCTION Information science is affecting the whole world so everyone is a consumer of information. In today's age information is being created in different forms or in different methods. Similarly, this type of Scientometrics also developed. The Scientometrics originated in Russian literature, and its scope increased in 1977 when T. Branin first published the journal "Scientometrics". Scientometrics is used in every discipline which is effective in analyzing problems and explaining meaningful facts. This effectively studies various aspects or systems in the field of social, cultural, science and technology studies. Definitions of Scientometrics: ‘Nalimov & Mulchenko’ (1969) or USSR defined Scientometrics as the quantitative method which deals with the analysis of science viewed as an information process. Beck (1978) defined Scientometrics as a study of the quantitative evaluation and inter-comparison of scientific activity, productivity and progress. Bookstein (1995) defined Scientometrics as “the science of measuring science”. International Journal of Library and Information Studies: This article includes articles published in the International Journal of Library and Information Studies (ISSN: 2231- 4911) (Open Access) in India for Scientometrics analysis. Founded in 2011 by the founders of the “PEARL” group, this journal is published four times a year. This journal aims to expand the scope of library and information science studies, to enhance the knowledge of scholars, researchers, professors. The International Journal of Library and Information Studies has published a total of 9 volumes, 36 issues, 713 articles and 8956 citations between 2011 and 2019. Review of Literature: Rubinandhini & Gomathi (2015) conducted a bibliometric study of Authorship Pattern on the annals of Library and Information Studies output during 2005-2014: this study covers the total number of 57 articles studied only the one journal with five years (2010 to 2014). This paper discusses on authorship pattern, citation analysis, Publication Efficiency Index, length of articles, relative growth rate, Distribution of year wise citation analysis, degree of collaboration, country wise distribution of publications, and time series analysis of total authored papers also. This study provides the insights and development of the journal towards excellence. Hence, the present study encouraged the authors will help for produce more publications. Another similar study conducted by Rubinandhini and Gomathi (2017) on Authorship Pattern of International Journal of Food Microbiology from 2007 to 2016. In this study discussed about Year wise, authorship patter, citation analysis, publication efficiency index, relative growth rate, and exponential growth rate also. The study provides the insights and development of the journal towards excellence. Numbers of Scientometric analysis studies have been conducted through the world. Out of them, two studies results are presented briefly. Padme and Vaishali conducted a bibliometric analysis of ‘Indian Journal of Chemistry- Section A’. The Indian Journal of Chemistry-Section A @ IJTSRD | Unique Paper ID – IJTSRD30857 | Volume – 4 | Issue – 4 | May-June 2020 Page 65
International Journal of Trend in Scientific Research and Development (IJTSRD) @ www.ijtsrd.com eISSN: 2456-6470 published 482 research papers during the period of study i.e. from 2010 to 2014. The journal has published on an average of 96 research papers per year. The Double authors contributed the maximum numbers of papers 119 (24.69%). The 653 contributors from 36 countries, India stands first place with the 66.76 percent of contributions and among Indian state wise distribution of the contributors, West Bengal stand first place with 71(16.28%) contributions. Nattur4 analysis of 829 articles published in the Indian Journal of Physics during the year from 2004 to 2008 reveals that maximum number of articles published in the year 2004. The important note of the study is that the majority of the articles are contributed by multiple authors and majority of the authors were affiliated to Universities. Ninety-two percent of the contributors were belonged to India and eight per cent belonged to other countries. Among the India, contributors belonged to Karnataka dominated the other states in India. Arruda et. al. (2009), analyzed the distribution of some characteristics of computer scientists in Brazil according to region and gender. Findings revealed that in the areas of artificial intelligence, computers in education and human- computer interface, Brazilian computer scientists had 5.3 journal publications per male researchers and 6.0 per female researchers, and the difference is statistically significant. And for conferences, the productivity is 23.73 and 30.92 for males and females, respectively. On the other hand, there is not a significant difference in male and female productivity in areas of hardware, network, distributed systems, and theory. Regarding regional differences, there are some statistically significant differences in productivity among different regions, and some differences in the concentration of researchers in a few research topics. Objectives of the Study: The main objective of the present studies issue follows - 1.To Find Distribution of Contributions (Volume-wise). 2.To Find Authorship Pattern of Contributions. 3.To Find Authorship Pattern of Contributions (Issue- wise). 4.To Find Contribution (Institution –wise). 5.To Find Geographical distribution of state-level contributions in India. 6.To Find Average Citation per contribution in each volume. 7.To Find Average Page (per volume and per contribution) contribution. Research Methodology: Prior research has been thoroughly analyzed for this article and collected and evaluated online information likes books, articles, journals, websites, blogs, etc. The research is based on articles published in the International Journal of Library and Information Studies from 2011 to 2019. Scope & Limitations of the present study: The present study is concerned with the scientometrics analysis of the International Journal of Library and Information Studies from 2011 to 2019 in the field of Library & Information Science. The data collected from 9 volumes, 36 issues, 713 articles, and 8956 citations are utilized for the present investigation. Data Analysis: International journal of library & information studies: a scientometric analysis is a branch of bibliometric. It is an important research tool for understanding the subject it aims at measuring the utility of documents and the relationship between documents and fields. The research is based on articles published in the International Journal of Library & Information Studies (ISSN: 2231-4911) from 2011 to 2019. 1.Distribution of Contributions Volume-wise: Distribution of Contributions (Volume-wise) Table No.1 Vol. No. Issue Contribution 2011 1 4 2012 2 4 2013 3 4 2014 4 4 2015 5 4 2016 6 4 2017 7 4 2018 8 4 2019 9 4 Total 36 (Source: Collected Data in IJLIS). Figure No.1 No. of No. of Year Percentage 23 26 49 64 77 91 169 158 56 713 3.22% 3.64% 6.87% 8.97% 10.79% 12.76% 23.70% 22.16% 7.89% 100% (Source: Table No.1) Table No. 1.1 & Figure No. 1, depicts the details regarding the number of Articles published during 2011-2019 which was 713 and the year-wise analysis of the contribution shows that Vol. No.7 highest number of contributions is 23.70% in the year 2017 & Vol. No.1 lowest contribution of 3.22% in the year 2011. 2.Authorship Pattern of Contributions: Authorship Pattern of Contributions Table No.2 No. of Authors Contribution Single Authors Two Authors Three Authors More than Three Authors Total 713 (Source: Collected Data in IJLIS). No. of Total No. of Authorship Percentage 416 416 58.34% 163 326 22.86% 83 249 11.65% 51 227 7.15% 1218 100% @ IJTSRD | Unique Paper ID – IJTSRD30857 | Volume – 4 | Issue – 4 | May-June 2020 Page 66
International Journal of Trend in Scientific Research and Development (IJTSRD) @ www.ijtsrd.com eISSN: 2456-6470 Figure No. 2 (Source: Table No. 2) Table No. 2 & Figure No. 2, indicates that the details about the authorship pattern. 58.34% have been contributed by Single author who is followed by two authors contributed 22.86%, three authors contributed 11.65% & more than three authors contributed 7.15%. Where “The majority of the contributions are contributed by Single Authors”. 3.Authorship Pattern of Contributions Issue-wise: Authorship Pattern of Contributions (Issue-wise). Table No. 3 Vol. No. Single Author Two Author Three Author More than Three Authors Total No. of Contribution 1 16 5 2 2 14 8 4 3 29 14 5 4 38 17 6 5 41 21 11 6 56 20 9 7 88 37 25 8 103 28 14 9 31 13 7 Total 416 163 83 (Source: Collected Data in IJLIS). Figure No.3 0 0 1 3 4 6 19 13 5 51 23 26 49 64 77 91 169 158 56 713 (Source: Table No. 3) Table No.3 and Figure No. 3, shows the authorship pattern of contributions volume-wise regarding contributions by a single author records the highest contributions 416, However the two author contributions, 163 shows the three author contributions 83, the more than three author contributions 51 it reflects the lowest percentage. 4.Contribution Institution-Wise: Contribution of Institution-wise Table No.4 College University Other Total 21 31 32 27 39 36 22 47 46 61 33 89 121 174 137 109 23 41 474 615 (Source: Collected Data in IJLIS). Vol. No 1 2 3 4 5 6 7 8 9 Year 2011 2012 2013 2014 2015 2016 2017 2018 2019 9 8 4 28 12 7 23 21 17 129 61 67 79 97 119 129 318 267 81 1218 Total @ IJTSRD | Unique Paper ID – IJTSRD30857 | Volume – 4 | Issue – 4 | May-June 2020 Page 67
International Journal of Trend in Scientific Research and Development (IJTSRD) @ www.ijtsrd.com eISSN: 2456-6470 Figure No. 4 5.Geographical contributions in India: Geographical Distribution of Contribution. distribution of state-level Table No. 5 Contribution Percentage 227 132 109 107 93 89 76 65 58 49 42 32 31 25 23 60 1218 (Source: Collected Data in IJLIS). State Andhra Pradesh Telangana Kerala Maharashtra Tamilnadu Delhi Kolkata Gujarat Uttar Pradesh Madhya Pradesh Punjab Haryana Bihar Odisa Rajasthan Other Total 18.63% 10.83% 8.94% 8.78% 7.63% 7.30% 6.23% 5.33% 4.76% 4.02% 3.44% 2.62% 2.54% 2.05% 1.98% 4.92% 100% (Source: Table No. 4) Table No. 4 & Figure No. 4 depicts the institution wise distribution of contributions. University wise at the national level followed by institutions & colleges. It is inferred from the above table that university-wise contribution maximum is 615 contributions, College contribution was 474 contributions & lastly others 129 contribution. ”Maximum number of contribution is at university level". Figure No. 5 (Source: Table No. 5) Table No. 5 & Figure No. 5 shows the geographical distributions of contributions at Indian state level. Andhra Pradesh is Maximum percentage of 18.63% & minimum percentage of others is 6.78% (Others included national & international Contributions). 6.Average Citation per contribution in each volume: Average Citation per Contribution per volume. Table No.6 Vol. No. No. of Contribution No. of Citation Average 1 23 2 26 3 49 4 64 5 77 6 91 7 169 8 158 9 56 Total 713 (Source: Collected Data in IJLIS). 281 322 669 771 929 1183 2041 2079 681 8956 3.13% 3.59% 7.46% 8.90% 10.37% 13.20% 22.78% 23.21% 7.36% 100% @ IJTSRD | Unique Paper ID – IJTSRD30857 | Volume – 4 | Issue – 4 | May-June 2020 Page 68
International Journal of Trend in Scientific Research and Development (IJTSRD) @ www.ijtsrd.com eISSN: 2456-6470 Figure No.6 (Source: Table No. 6) Table No. 6 & Figure No.6, it can be observed for average citation per contribution in each volume. Average citation contribution is Vol. no. (7) 22.78% contributed 2041 citation. Highest numbers of citation appeared in Vol. no. (8) 23.21% contributed 2079 citations & which minimum number of citation appeared in Vol. no. (1) 3.13% contributed 281 citations. Where “The majority of the citation are Vol. no. 8”. 7.Average Page Contribution (per volume and per contribution): Average Page per volume & contribution. Table No.7 Vol. No. No. of Contribution No. of Pages Average 1 23 2 26 3 49 4 64 5 77 6 91 7 169 8 158 9 56 Total 713 Figure No. 7 259 307 578 719 791 1092 1521 1397 658 7322 3.53% 4.19% 7.89% 9.82% 10.80% 14.91% 20.81% 19.07% 8.98% 100% (Source: Table No. 7) Table No. 7 & Figure No.7 it can be observed for average pages per contribution in each volume. Vol. no. (6) 14.91% contributed 1092 pages. Contributions of which highest numbers of pages appeared in Vol. no. (7) 20.81% contributed 1521 pages & contribution of which minimum number of citation appeared in Vol. no.1 (3.53%) contributed 259 pages. @ IJTSRD | Unique Paper ID – IJTSRD30857 | Volume – 4 | Issue – 4 | May-June 2020 Page 69
International Journal of Trend in Scientific Research and Development (IJTSRD) @ www.ijtsrd.com eISSN: 2456-6470 Findings: 1.Highest Contributions of vol. no.7 is 23.70%. 2.The highest Contribution of Single authors is 58.34%. 3.A single author records the highest contribution is 416 articles. 4.The maximum number of contributions is at the university level is 474. 5.The maximum percentage of authors belongs to Andhra Pradesh is 18.63%. 6.The majority of the citations are Vol. no. 8 is 23.21% contributed 2079 citations. 7.The highest numbers of pages appeared in Vol. no.7 20.81% contributed 1521 pages. Conclusion: This analysis method is very useful and effective as we can verify any research through scientometric analysis. This article also examines the research data using this method. In the international journal of library & information studies, a large number of research works have been done from 2015 to 2018. The number of single authors is high and according to the geographical statistics, the number of authors from the state of Andhra Pradesh in India is large. A total of 8956 references have been used in this journal while 9 volumes of that journal have 7322 pages. References: [1]Arruda, D, & Et.al. (2009). Brazilian computer science research: Gender and Scientometrics, 79 (3), 651-665. regional distribution. [2]Brindha, Scientometrics Tools & Techniques: an Overview. T & Murugesapandian, N. (2016). [3]Nalimov & Mulchenko. (1969). ‘Definition of Scientometric’ http://www.shanlaxjournals.in/pdf/ASH/V4N2/Ash_V 4 N2_014.pdf Retrievedfrom: [4]Padme, S. L and Vaishali, K. Bibliometric analysis of Indian Journal of Chemistry- Section A, International Journal of Information Dissemination and Technology, 6 (2) (2016) 103-106. [5]PEARL, Group, (2011). International Journal of Library & Information Studies (Open Access Journal) output during 2011-2019: ISSN: 2231-4911. [6]Rubinandhini, A., & Gomathi, P. (2015). Authorship Pattern on the annals of Library and Information Studies output during 2005-2014: A bibliometric study. International Journal of Engineering Sciences and Management Research, 2(9), 141-151 @ IJTSRD | Unique Paper ID – IJTSRD30857 | Volume – 4 | Issue – 4 | May-June 2020 Page 70


![[Library name and information]](https://cdn1.slideserve.com/1964500/slide1-dt.jpg)

![[Library name and information]](https://cdn1.slideserve.com/2727637/slide1-dt.jpg)


![[Library name and information]](https://cdn3.slideserve.com/6074806/slide1-dt.jpg)