Area IV: Pollution
Area IV: Pollution. IVA3: Water Pollution. 22-1 Types, Effects, Sources of Water Pollution. water is polluted by infectious bacteria, inorganic and organic chemicals, and excess heat

Area IV: Pollution
E N D
Presentation Transcript
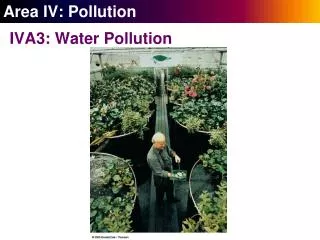
Area IV: Pollution IVA3: Water Pollution
22-1 Types, Effects, Sources of Water Pollution • water is polluted by infectious bacteria, inorganic and organic chemicals, and excess heat • water pollution: any chemical, biological, or physical change in water quality that has a harmful effect on living organisms • the WHO estimates that 3.4 million people/yr people die prematurely from waterborne diseases • an estimated 1.5 million people/yr in U.S. become ill from infectious agents
22-1 Types, Effects, Sources of Water Pollution • scientists monitor water quality by using bacterial counts, chemical analysis, and indicator organisms • number of colonies of fecal coliform bacteria present in a water sample • drinking water: 0 colonies/100 mL • swimming water: < 200 colonies/100 mL • bacterial source tracking (BST) • biological oxygen demand (BOD): the amount of dissolved oxygen consumed by aquatic decomposers
22-1 Types, Effects, Sources of Water Pollution • scientists monitor water quality, cont. • chemical analysis: inorganic and organic chemicals present, sediment content, and turbidity of water • indicator species • genetic techniques are being used to develop organisms that will glow in the presence of specific pollutants such as toxic heavy metals in the ocean and carcinogens in food
22-1 Types, Effects, Sources of Water Pollution • water pollution can come from a single source or variety of dispersed sources • point sources discharge at specific locations • examples: drainpipes, sewer lines • easy to identify, monitor, and regulate • non-point sources are scattered and diffuse and can’t be traced to any single site of discharge • examples: runoff from croplands, livestock feedlots • difficult and expensive to identify and control these discharges
22-1 Types, Effects, Sources of Water Pollution • sources of water pollution, cont. • leading sources: agriculture, industries, mining • agricultural activities: • erosion • overgrazing • fertilizers • pesticides • excess salt from irrigated soils
22-1 Types, Effects, Sources of Water Pollution • too much rain and too little rain can increase water pollution • increased moisture with more intense rains can flush harmful chemicals, plant nutrients, and microorganisms into waterways • prolonged drought can reduce river flows so there is less dilution available • warmer water contains less dissolved oxygen
22-2 Pollution of Freshwater Streams • streams can recover from moderate levels of degradable water pollutants if the flows are not reduced • dilution and biodegradation can allow recovery of stream pollution if: • they are not overloaded • do not have reduced flow due to damming, agricultural diversion, or drought
22-2 Pollution of Freshwater Streams • stream recovery, cont. • breakdown of pollutants by bacteria creates an oxygen sag curve • organisms with a high oxygen demand can’t survive in the curve • factors in size of curve: • volume of the stream • volume of wastes entering • flow rate • temperature • pH levels
22-2 Pollution of Freshwater Streams • most developed countries have reduced point source pollution, but toxic chemicals and pollution from non-point sources are still problems • the U.S. has avoided increases in pollution from point sources in most streams • cleanup of rivers: Cuyahoga River in Ohio and the Thames River in Great Britain • there are sometimes large fish kills, and contamination of drinking water from industry, mining, and non-point runoff of fertilizers and pesticides
22-2 Pollution of Freshwater Streams • stream pollution in most developing countries is a serious and growing problem • half of the world’s 500 major rivers are heavily polluted • many run through developing countries where waste treatment is minimal or nonexistent
22-2 Pollution of Freshwater Streams • the Ganges River in India is severally polluted • ~350 million people live in the Ganges River basin with little treatment of sewage • Hindu beliefs compound problem • air pollution from cremated bodies • water pollution from bodies thrown in river • government solutions: • waste treatment plants in the 29 large cities along the Ganges • electric crematoriums on its banks • introduction of snapping turtles as body scavengers
22-3 Pollution of Freshwater Lakes • lakes are less effective at diluting pollutants that enter them • often stratified with little vertical mixing • very little flow occurring • may take from 1–100 years to flush and change water in lakes and reservoirs • much more vulnerable to runoff contamination of all kinds of materials • chemical concentrations build up as they pass through the food webs in lakes
22-3 Pollution of Freshwater Lakes • human activities can reduce dissolved oxygen and kill some aquatic species • natural eutrophication: nutrient enrichment of lakes from runoff • depends on composition of the surrounding drainage basin • can enrich abundance of desirable organisms • cultural eutrophication occurs due to runoff • usually near urban or agricultural areas and in coastal water, enclosed estuaries, and bays • can lead to serious pollution problems
22-3 Pollution of Freshwater Lakes • human activities, cont. • cultural eutrophication, cont. • the EPA states that 85% of large lakes near major population centers in U.S. have some amount of cultural eutrophication • can be reduced or prevented by: • banning or limiting phosphates in detergents • advanced treatment methods to remove nitrates and phosphates from wastewater • use of soil conservation to reduce runoff
22-3 Pollution of Freshwater Lakes • human activities, cont. • hot weather or drought -> “blooms” of organisms -> reduction in lake productivity • reduced sunlight + decomposition -> increase in bacteria populations -> decrease in DO -> fish kills -> anaerobic bacteria take over • cleanup of lakes includes removing excess weeds, controlling plant growth, and pumping air through lakes and reservoirs to avoid oxygen depletion • pollution prevention is cheaper than cleanup
22-3 Pollution of Freshwater Lakes • Case Study in lake recovery: Lake Washington, Seattle • sewage diverted from the lake to Puget Sound, where rapid water exchange dilutes sewage • recovery took 4 years • lake had not filled with weeds and sediment • concern about Puget Sound due to increased urban runoff and growing population • What is the best way to deal with pollution?
22-3 Pollution of Freshwater Lakes • Case Study: pollution of the Great Lakes has dropped but is still a problem • the Great Lakes contain about 95% of the fresh surface water in the United States, and 20% of the world’s fresh surface water • > 38 million people obtain drinking water from the lakes • vulnerable due to less than 1% outflow to the St. Lawrence River but lots of inputs • Lake Erie: shallowest; was the most polluted; high concentration of people and industry
22-3 Pollution of Freshwater Lakes • Case Study: Great Lakes pollution, cont. • since 1972, the U.S. and Canada have worked together to reduce pollution • there is still a large area of depleted oxygen that occurs in the center of the lake each August for unknown reasons • a 2000 survey by the EPA stated that more than ¾ of the shoreline is not clean enough for swimming or use as drinking water • non-point land runoff is now a greater problem than industrial pollution
22-3 Pollution of Freshwater Lakes • Case Study: Great Lakes pollution, cont. • biomagnification of the depositions from atmospheric contaminants means that one fish in four is unsafe for human consumption • EPA funding for cleanup has also dropped by 80% since 1992 • environmentalists call for banning the use of bleach, building new incinerators, and stopping the discharge into the lakes of 70 toxic chemicals
22-4 Pollution of Groundwater • groundwater is vulnerable to pollution • spilling gasoline, oil, paint thinners, etc. onto the ground can contaminate groundwater • low-risk ecological problem • high-risk health problem • contaminated water in the aquifer will slowly flow, creating a plume of contaminated water • contaminants in groundwater are not diluted or dispersed because this water moves usually less than 0.3 meter per day
22-4 Pollution of Groundwater • groundwater vulnerability, cont. • cleansing is slow; factors: • lower oxygen content • colder temperature of the water • smaller populations of decomposing bacteria • it can take hundreds of years to cleanse degradable wastes; nondegradable wastes are there permanently
22-4 Pollution of Groundwater • the extent of groundwater contamination is generally unknown • EPA and U.S. Geological Survey figures state that one or more organic chemicals contaminate about 45% of municipal groundwater supplies in the U.S. • ~26,000 industrial waste ponds and lagoons in U.S. do not have a liner to prevent seepage • many underground storage tanks have leaks • determining the extent of a leak is costly, and the cost of cleanup is more costly yet
22-4 Pollution of Groundwater • groundwater contamination, cont. • nitrates can contaminate groundwater, esp. in agricultural areas; form nitrites in the body • arsenic is released into drinking water when a well is drilled into arsenic-rich soils and rock • WHO estimates that more than 112 million people drink water containing 5–100 times the recommended level of 10 parts/billion • Bangladesh has a serious problem with arsenic, but the UN and several NGOs have begun to assess wells and tag them
22-4 Pollution of Groundwater • prevention is the most effective and affordable way to protect groundwater from pollutants • underground tanks in the U.S. and some other developed countries are now strictly regulated • old, leaky tanks are being removed, and the surrounding soils are being treated
22-5 Ocean Pollution • oceans can disperse and break down large quantities of degradable pollutants if they are not overloaded • raw sewage, sludge, oil, and some degradable industrial wastes can be degraded, especially in deep-water areas • some marine animals have been less affected by pollutants than expected • there is controversy as to whether this is a viable solution to the problem
22-5 Ocean Pollution • pollution near heavily populated areas • ~40% of the world’s population lives on or within 62 miles of the coast • in most coastal developing countries and some developed countries, sewage is dumped into the sea without treatment • human viruses (not removed by waste treatment) have been found in coastal waters • nutrient enrichment from nitrate and phosphate runoffs causes algal blooms, killing fish and fish-eating birds
22-5 Ocean Pollution • pollution near populated areas, cont. • extensive non-point runoffs have caused seasonal, large oxygen-depleted zones in temperate coastal waters • the second largest of these zones forms each summer at the mouth of the Mississippi River in the Gulf of Mexico • scientists are investigating whether fine clay particles can pull algae out of the water • preventive measures: restore wetlands, reduce nitrogen inputs, sewage treatment
22-5 Ocean Pollution • pollutants from six states contaminate the shallow Chesapeake Bay estuary • a huge drainage basin adds both point and non-point pollutants to the waters • point sources: 60% of phosphates • nonpoint sources: 60% of nitrates • the bay is shallow, so only 1% of the waste that enters is flushed into the Atlantic Ocean • commercial harvest of oysters, crabs, and fish has fallen sharply since 1960 because of overfishing, pollution, and disease
22-5 Ocean Pollution • Chesapeake Bay estuary, cont. • in 1983, the U.S. started an integrated coastal management plan • reduction of runoff • upgrading waste treatment plants • better monitoring of industrial discharges • banning phosphates from detergents • between 1985 and 2000, 27% decline in phosphorus levels, 16% drop in nitrogen levels, recovery of grasses on bottom of bay • reduction in funding has slowed progress
22-5 Ocean Pollution • Chesapeake Bay estuary, cont. • introduction of disease-resistant oysters could greatly reduce water pollution because oysters filter algae and silt from water • oysters recycled the entire volume of the bay in 3–4 days • over-harvesting and two parasitic oyster diseases reduced the oyster population • several ways to reintroduce oysters into the bay are being considered
22-5 Ocean Pollution • oceans as dump sites • dumping industrial wastes off U.S. coasts has stopped, dumping of dredge spoils continues • many countries dump sewage sludge (banned in U.S. since 1992) • 50 countries with >80% of world’s merchant fleet agreed not to dump ship waste at sea • the London Dumping Convention of 1972: 100 countries agreed not to dump highly toxic pollutants, high-level radioactive wastes in open sea