Download
1 / 3
30 likes | 185 Vues
Relative induction of p-Erk1. Relative induction of p-IRAK1. Relative induction of p-RAF. Relative induction of p-Erk2. Relative induction of p-MKK6/3. Relative induction of p-MEK1/2. Fig. S1; Ritter et al. 2010. Relative induction of p-ELK. Relative induction of p-RSK.

E N D
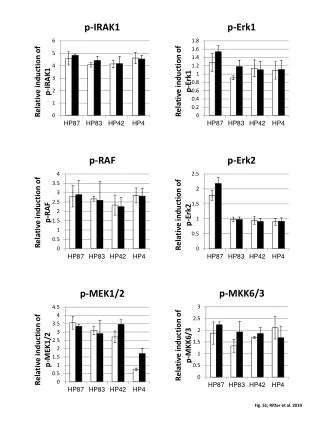
Relative induction of p-Erk1 Relative induction of p-IRAK1 Relative induction of p-RAF Relative induction of p-Erk2 Relative induction of p-MKK6/3 Relative induction of p-MEK1/2 Fig. S1; Ritter et al. 2010
Relative induction of p-ELK Relative induction of p-RSK Relative induction of p-JNK Relative induction of p-Jun * * Relative induction of p-ATF2 Relative induction of p-p65 * * Fig. S1; Ritter et al. 2010
Supplementary Figure 1. Densitometric analysis H. pylori induced phosphorylation of signal transduction protreins and downstream transcription factors. AGS cells were left untreated or were infected with H. pylori strains HP87, HP83, HP42 a HP4 by MOI 10 (white bars) and by MOI 100 (black bars). 30 minutes after infection cells were harvested and whole cellular extracts were isolated. All diagrams illustrate the data from densitometric analysis of detected bands in Western blots ± S.E.M. from three independent infection experiments. The signals were quantified and normalized to corresponding GAPDH signals in each experiment. The level of posphorylatedproteins in non nucleofected cells was set to 1 (not shown) and compared to respective signals in infected cells in each experiment to obtain a relative induction factor. Relative induction of phosphorylated protein levels are presented on Y-axis. H. pylori strains are indicated at the bottom of diagram. Data were analyzed for statistical significance by ANOVA test. The symbol * indicates significant difference (P ≤ 0.05) for H. pylori infected AGS cells versus non infected AGS cells.