THORPEX-Pacific Asian Regional Campaign (T-PARC) and TCS-08: Typhoon Sinlaku Insights
280 likes | 409 Vues
The THORPEX-Pacific Asian Regional Campaign (T-PARC) and Tropical Cyclone Structure-08 (TCS-08) projects provided critical insights into typhoon dynamics. Conducted from various international aircraft locations, these experiments encompassed collaborations from nine nations, focusing on tropical cyclone formation, intensification, and transition phenomena. Utilizing extensive aircraft operations, including over 500 flight hours and 76 missions across 11 tropical circulation systems, the research aimed to improve forecast accuracy and understand the structural changes during typhoon events like TY Sinlaku.

THORPEX-Pacific Asian Regional Campaign (T-PARC) and TCS-08: Typhoon Sinlaku Insights
E N D
Presentation Transcript
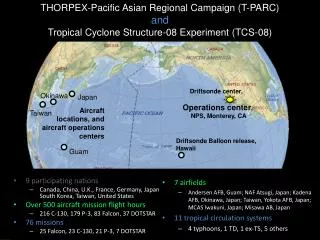
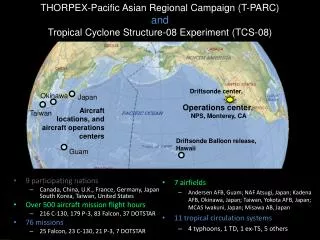
THORPEX-Pacific Asian Regional Campaign (T-PARC) and Tropical Cyclone Structure-08 Experiment (TCS-08) Driftsonde center, Okinawa Japan Operations center, NPS, Monterey, CA Aircraft locations, and aircraft operations centers Taiwan Driftsonde Balloon release, Hawaii Guam • 9 participating nations • Canada, China, U.K., France, Germany, Japan, South Korea, Taiwan, United States • Over 500 aircraft mission flight hours • 216 C-130, 179 P-3, 83 Falcon, 37 DOTSTAR • 76 missions • 25 Falcon, 23 C-130, 21 P-3, 7 DOTSTAR • 7 airfields • Andersen AFB, Guam; NAF Atsugi, Japan; Kadena AFB, Okinawa, Japan; Taiwan, Yokota AFB, Japan; MCAS Iwakuni, Japan; Misawa AB, Japan • 11 tropical circulation systems • 4 typhoons, 1 TD, 1 ex-TS, 5 others
Extratropical Transition Downstream Impacts TC Intensification. structure change, track uncertainty Recurvature, initiation of ET Formation Large-scale circulation, deep convection, monsoon depressions, tropical waves, TC formation
Experiments to study TC rapid intensification and concentric eye-wall cycles by C. C. Wu utilizing aircraft observations during the pre-recurvature period of TY Sinlaku
EXP 1003: Only Data Assimilated from the first flights into TY Sinlaku
Weissmann et al. Mon. Wea. Rev. 2010 Differences in 72-h DROP and NODROP track forecast errors Forecast degradation after recurvature Recurvature time Sinlaku Jangmi
Average track improvement (km) after assimilation of dropwindsonde data into the NCEP/GFS model during the 6-120-h forecast periods Recurvature time Chou et al. Mon. Wea. Rev. 2011
NCEP/GFS Sinlaku No Drops NCEP/GFS Sinlaku Drops NCEP/GFS Sinlaku Difference Drops Inclusion of dropwindsondes lead to and improvement in initial storm structure and better track forecast due to improved steering flow Best track RMW Wu et al. Mon. Wea. Rev. 2012
TY Sinlaku: 1200 UTC 10 September – 0000 UTC 21 September 21 20 19 1200 UTC 15 SEP 18 16 17 DLR FALCON WC-130J, NRL P-3 WC-130J, NRL P-3, DLR Falcon 15 WC-130J, NRL P-3, DLR Falcon WC-130J, NRL P-3, DLR Falcon DOTSTAR, DLR FALCON Transformation Stages Re-intensification as a typhoon Extratropical Stage • Impacts and Processes associated with the Extratropical Transition of TY Sinlaku • Uncertainty in downstream development • Utility of aircraft data in identifying important structural characteristics
ECMWF/UKMO Ensemble track predictions for TY Sinlaku prior to recurvature Forecasts obtained from the THORPEX Interactive Global Grand Ensemble (TIGGE) database
ECMWF/UKMO Ensemble track predictions for TY Sinlaku following recurvature Forecasts obtained from the THORPEX Interactive Global Grand Ensemble (TIGGE) database
ECMWF Forecast Experiments conducted by Martin Weissmann • ECMWF IFS with and without T-PARC data • Discussed in Weissmann et al. 2011 with respect to forecast track improvement • ~25 km, 91 levels • 4D-Var data assimilation with 09-21 UTC and 21-09 UTC data windows • Cycled • Forecasts initialized at 0000 UTC and 1200 UTC • Observations not included: • Dropwindsondes • Driftsondes • JMA Ship SYNOP and Rawindsondes • “Drops” experiment • First guess check relaxed to 40oN • Only a few dropwindsondes in the inner core of Sinlaku on 18 September were flagged.
No drops Drops
No drops Drops
Standard deviation of 500 hPa among ensemble members averaged between 40o-60oN Black dots = location of Sinlaku and ex-Sinlaku in individual members Red dot = location at time of Extratropical Transition 1200 UTC 15 SEP TIGGE Julia Keller, KIT, Karlsruhe, Germany
Use of TIGGE to examine the ability of ensemble systems to represent forecast scenarios as defined by a fuzzy cluster analysis of the large-scale upper-level flow patterns associated with TY Sinlaku and Jangmi during T-PARC Keller et al 2011 (GRL)
Post Recurvature Structure Change and Re-intensification • Synoptic-scale processes facilitated the re-invigoration of deep convection • Mesoscale and convective-scale processes contributed to an increase in the vorticity of the TC, which resulted in the re-intensification of Sinlaku. • Interactions between the tilted TC vortex and multiple mesoscale circulations • The re-intensification of Sinlaku continued as multiple episodes of deep convection rotated cyclonically around and inward toward the TC center. 21 20 19 Typhoon Sinlaku 07-22 September 2008 18 16 DLR FALCON 17 WC-130J, NRL P-3 Re-intensification 17-18 September 2008 WC-130J, NRL P-3, DLR Falcon 15 WC-130J, NRL P-3, DLR Falcon 18 Sep / 0200 UTC 17 Sep / 0200 UTC 16 Sep / 1800 UTC WC-130J, NRL P-3, DLR Falcon DOTSTAR, DLR FALCON
Sinlaku CC / Convective Towers (>14 km) • Deep convection • Reflectivity • Multiple towers with reflectivity > 35 dBZ at 12 km • Base of reflectivity in the tower region increases to the east • Vorticity • Deep towers of positive vorticity coincident with towers of high reflectivity; maximum between 10-12 km • Maxima associated with the Sinlaku LLCC tilts eastward with height into western tower of positive vorticity • Vertical Motion • ~30 m s-1 • Maximum between 10-12 km • Convergence into the column through 10 km; divergence at upper-levels W E
TY Sinlaku: 1200 UTC 10 September – 0000 UTC 21 September 21 20 19 18 16 17 DLR FALCON WC-130J, NRL P-3 WC-130J, NRL P-3, DLR Falcon 15 WC-130J, NRL P-3, DLR Falcon WC-130J, NRL P-3, DLR Falcon DOTSTAR, DLR FALCON Transformation Stages Re-intensification as a typhoon Extratropical Stage • Impacts and Processes associated with the Extratropical Transition of TY Sinlaku • Uncertainty in downstream development • Utility of aircraft data in identifying important structural characteristics
NE NW SE SW 7.5 m s-1 shear from the WSW ELDORA reflectivity and horizontal winds as defined by the SAMURAI analysis package developed by Michael Bell. TC Structural characteristics are related to the forcing due to westerly vertical wind shear Annette Forster, KIT, Karlsruhe, Germany
Final Stage of Extratropical Transition TY Sinlaku: 1200 UTC 10 September – 0000 UTC 21 September 21 20 19 18 16 17 DLR FALCON WC-130J, NRL P-3 WC-130J, NRL P-3, DLR Falcon 15 WC-130J, NRL P-3, DLR Falcon WC-130J, NRL P-3, DLR Falcon DOTSTAR, DLR FALCON Transformation Stages Re-intensification as a typhoon Extratropical Stage • Impacts and Processes associated with the Extratropical Transition of TY Sinlaku • Uncertainty in downstream development • Utility of aircraft data in identifying important structural characteristics
Analysis of aircraft dropwindsonde data, satellite winds, and ELDORA winds with the background field defined by the ECMWF analysis as obtained from the YOTC database Julian Quinting, KIT, Karlsruhe, Germany
South North South North Convective region (x = 125 km) ELDORA Reflectivity with SAMURAI in-plane and vertical winds SAMURAI in-plane and vertical winds and moist static energy Julian Quinting, KIT, Karlsruhe, Germany
South North South North ECMWF Samurai Convective region (x = 125 km) ELDORA Reflectivity with SAMURAI in-plane and vertical winds SAMURAI in-plane and vertical winds and moist static energy Julian Quinting, KIT, Karlsruhe, Germany
Summary and Outlook • Successful field campaign • Design • Execution • Data processing – QC • Distributed Data Archive (http://data.eol.ucar.edu/master_list/?project=T-PARC) • Initial Results • Concentrated on results of targeted data experiments • Data denial experiments • Improved forecast tracks during pre-recurvature periods • Forecast improvements are sensitive to the type of aircraft observations (i.e., inner core, near-storm environment, remote sensitive area • Forecast improvements are sensitive to the type of measurement (i.e., dropwindsonde, Doppler wind lidar). • Most recent results are examining the relative impacts of targeted satellite data • Meetings • International Workshop on Tropical Cyclones (ITWC) March 2010 • AMS 30th Conference on Hurricanes and Tropical Meteorology • International Workshop on Extratropical Transition (IWET) May 2012
Summary and Outlook • Process studies • Tropical cyclone structure and intensity changes • Interaction with YOTC and TIGGE • Physical processes • Forecast Verification • Extratropical Transition • Predictability of downstream impacts • New data sets providing detailed examination of structural characteristics. • Identification of the evolution to an extratropical cyclone • Outlook • Link detailed observations of post recurvature structure to impacts on the predictability associated with downstream impacts and development of the extratropical cyclone. • Examination of structure and intensity changes • Relative roles of satellite and in situ observations relative to improved track forecasts.