
Uploaded by
tejano
3 SLIDES
169 VUES
30LIKES
https://insight.mc.vanderbilt/AllTab.jsp
DESCRIPTION
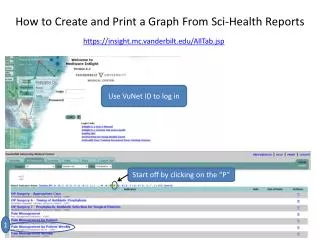
How to Create and Print a Graph F rom Sci -Health Reports. https://insight.mc.vanderbilt.edu/AllTab.jsp. Use VuNet ID to log in. Start off by clicking on the “P”. 1. Select VUH. Select location. Click on the View dropdown menu, select Run Chart
Download
1 / 3
Télécharger la présentation 
https://insight.mc.vanderbilt/AllTab.jsp
An Image/Link below is provided (as is) to download presentation
Download Policy: Content on the Website is provided to you AS IS for your information and personal use and may not be sold / licensed / shared on other websites without getting consent from its author.
Content is provided to you AS IS for your information and personal use only.
Download presentation by click this link.
While downloading, if for some reason you are not able to download a presentation, the publisher may have deleted the file from their server.
During download, if you can't get a presentation, the file might be deleted by the publisher.
E N D
Presentation Transcript
How to Create and Print a Graph From Sci-Health Reports https://insight.mc.vanderbilt.edu/AllTab.jsp Use VuNet ID to log in Start off by clicking on the “P” 1
Select VUH Select location • Click on the View dropdown menu, select RunChart • Click on the Perioddropdown menu, select the previous week to get a whole weeks worth of data • Click on the View By dropdown menu, select History 4 • Tabular • Run Chart • SPC Chart • Node • History


More Related