Streamlining Student Test Results Presentation: A Step-by-Step Guide
290 likes | 401 Vues
This guide offers a straightforward approach to inputting and presenting student test results effectively. Learn how to save reports, customize titles, and manage slides for better clarity. Step-by-step instructions will help you add scores for cognitive skills and audiograms, ensuring accurate representation of data. The guide emphasizes visual clarity by adjusting columns for left and right ear scores if necessary. Follow this easy process to enhance your reports, thanking Megan Bennett for the inspiration and methodology.

Streamlining Student Test Results Presentation: A Step-by-Step Guide
E N D
Presentation Transcript
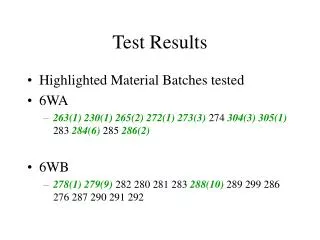
How to use this • “Save as” with a new file name for your student’s report. • Click on the first page and change the title to the name of your student. • Go to “view”, “slide sorter”, delete any slides you don’t need. • Go to “normal” (to the left of “slide sorter”). • Click on the chart, right click the mouse, click on “edit data”, on the list of scores under column 1, put in the scores for your student. If you have more than one year’s worth of data, put the first year under column 1 and this year’s data under column 2. [note: if you don’t see “design”, click on another part of the chart] • Move the red line to show your student’s general cognitive skills. • Continued for audiogram on the next slide. Thanks to Megan Bennett for the idea and general “how to”.
Entering data in the audiogram Use the same procedure. Click on the chart, go to “design”, then to “edit data”. Enter the Db in the correct column. *If a student’s right and left ear are the same, you may want to put one ear at 1 number more for visual clarity.