Download
1 / 23
240 likes | 409 Vues
Star Formation and the GBT K-Band Focal Plane Array. Crystal Brogan (NRAO/NAASC). T. R. Hunter (NRAO), C. J. Chandler (NRAO), K. Devine (U. Wisconsin), L. Morgan (NRAO), R. Indebetouw (NRAO/UVa), C. Cyganowski (U. Wisconsin). KFPA Workshop Nov. 26, 2007.

E N D
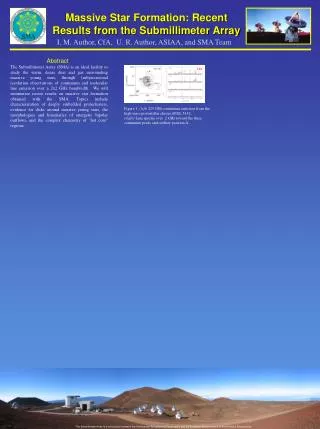
Star Formation and the GBT K-Band Focal Plane Array Crystal Brogan (NRAO/NAASC) T. R. Hunter (NRAO), C. J. Chandler (NRAO), K. Devine (U. Wisconsin), L. Morgan (NRAO), R. Indebetouw (NRAO/UVa), C. Cyganowski (U. Wisconsin) KFPA Workshop Nov. 26, 2007
Massive Stars Play a Key Role in Galactic Evolution • Massive stars throughout their lifecycles dominate our view of galaxies • Ionizing photons & mechanical energy • Cosmic rays & heating of dust • Heavy elements & organic chemistry • Radio/mm/submm astronomy provides a unique window on their birth and death • The regions where massive stars are born and die are often opaque at optical and near-IR wavelengths
2MASS 2mm 90cm VLA Mosaic resolution 42” Brogan et al. (2006) Massive Stars Play a Key Role in Galactic Evolution • Massive stars throughout their lifecycles dominate our view of galaxies • Ionizing photons & mechanical energy • Cosmic rays & heating of dust • Heavy elements & organic chemistry • Radio/mm/submm astronomy provides a unique window on their birth and death • The regions where massive stars are born and die are often opaque at optical and near-IR wavelengths
Distribution of O & B stars in Galactic Plane Wood & Churchwell (1989) Latitude Longitude Where and How Do Massive Stars Form? • Massive stars are concentrated in the Galactic mid-plane h < 90 pc • Most are located toward the Inner Galaxy at distances > 1 kpc • - Best studied low mass regions are at d < 200 pc (Ophiuchus, Perseus, Taurus) • Most form in complex clustered environments • Confusion: both spatial and kinematic are often severe • Using a high density tracer is key • Catching fast evolving massive stars at the earliest stages in their evolution is essential: Infrared Dark Clouds (IRDCs)
90cm VLA Mosaic resolution 42” Brogan et al. (2006) Galactic plane around G18.6-0.0 SNR HII: Sh-53 HII: W39
A GLIMPSE of Infrared Dark Clouds (IRDCs) 1o • Extinction features seen in silhouette against the Galactic IR background • Thought to harbor the earliest observable phases of massive star formation • Often very filamentary • 1,000s seen in the Spitzer GLIMPSE survey (and previous surveys like MSX)
SNR HII: Sh-53 HII: W39
G19.3+0.07 d ~ 2.2 kpc (3” = 6,600 AU) > 1 at 24 mm N(H2) > 1023 cm-2 No radio continuum detected 2’ 3.6 mm4.5 mm8.0 mm Brogan, Indebetouw et al. (in prep.)
Dense Molecular Gas Toward G19.3 Ammonia (1,1) and (2,2) data trace warm dense gas with temperatures in the range 10-30 K Saturation in the region of MM1 and MM2 suggest temps climb even higher toward mm peaks Despite high extinction, dense gas not detected throughout cloud – what makes the cores special? 8mm and NH3 (1,1) 8mm and NH3 (2,2) Very Large Array
IRDC G28.34+0.06: VLA + Effelsberg Wang et al. (2007)
VLA NH3 (1,1) and CCS (25.9 GHz) IRDC G35.47-0.31 5’ Contours: VLA NH3 (1,1) emission (lowest contour 0.012 Jy) • CCS thought to be most abundant at early times (van Dishoeck & Blake 1998) • Comparison with CCS (2-1) at 25.9 GHz suggests southern part of cloud may be chemically younger • The few sources we have data for show similar behavior Devine et al. (2008)
CCS Zeeman • CCS (2-1) has a Zeeman coefficient comparable to OH • However, the Zeeman signal scales as nu-1 so much more difficult to dectect, this line is also rather weak • For Zeeman work it is desirable to have the native feed polarization to be linear • Due to the weakness of the signal it is unlikely that it can ever be mapped… (see efforts by Levine et al.) unfortunately this is not really a science case for the KFPA
Triggered Star Formation (?): Bright Rimmed Clouds MIPS 24 µm L. Morgan GBT project with 400 pointings (~20 hours) Would like to map whole MIPS region shown And other similar sources for comparison
Triggered Star Formation? Large scale NH3 images with 30” resolution of these bubbles would be better suited to identify the densest cores than the 45” 13CO(1-0) BU data shown here (ncrit ~ 103 cm-3) 3.6 mm8.0 mm24 mm 13CO(1-0) 2’ VLA PB Brogan & Indebetouw, in prep.
Para-NH3: K¹3n (n: integer) (all H spins not parallel) Ammonia Ammonia ncrit~ 2x104 cm-3: J: Rotational Quantum Number K: Projection on Symmetry Axis Dipole Selection Rules: DJ=0, ±1 DK=0 J>K: non-metastable (decay time: 10-100 s) J=K: metastable (decay time: 100 yr) Ortho-NH3: K=3n (all H spins parallel) Huettemeister et al. (1995)
Upper Tuning Range NH3 (9,9) 27.4779 GHz may be seen toward the most luminous and thus hottest massive star forming regions: The Ortho lines tend to be 3x the Para lines To measure the Ortho temperature you need two Ortho lines. The non-thermal excitation often seen in the (3,3) line makes the (6,6)/(9,9) ratio key (in hot enough sources >150 K) Huettemeister et al. (1995) Using Effelsberg toward SgrB2 HC3N (3-2) at 27.294 GHz with ncrit~ 104 cm-3 also has promise: The abundance of HC3N ranges from 0.1% to 10% of NH3. Shows clear spatial gradients compared to ammonia (Pratap et al. 1997) and is also thought to show promise as a chemical clock Thought to be a key progenitor of longer cyanopolyyenes (HCxN)
H69a H66a H64a H70a H68a H67a H65a H63a H62a H71a K-Band Lines of Interest (many more than discussed here)
90cm VLA Mosaic resolution 42” Brogan et al. (2006) Continuum Capabilities • Spinning dust (signal is maximum between 20-40 GHz) provides a potentially interesting science case for KFPA continuum capability. See Brian Mason… • Large scale mapping of extended Galactic structures like evolved HII regions (and bubbles) and SNRs with 30” resolution also compelling • There is no other comparable resolution continuum survey at short cm wavelengths. Would provide tremendous synergy with for example IGPA (R. Taylor talk)
GBT K-FPA Compared to EVLA in WIDAR Era • The 7-element KFPA will be done on similar timescale as EVLA WIDAR correlator (2009) • Collecting area of EVLA is a bit larger (120m) but the antenna efficiency (0.5) is a bit worse; they cancel almost exactly so the point source sensitivity for the same bandwidth is similar • EVLA PB is 16x larger than GBT, so compared to 7-element FPA the EVLA mapping speed is ~2.3 times faster • Possible to map many more lines simultaneously with the EVLA (8 GHz bandwidth), and with ~10x more continuum bandwidth • EVLA linear resolution is 5 to 150 times better • GBT is MUCH more sensitive to large angular scale (> 20”) emission KFPA science should be focused toward EXTENDED emission (> 20”). Even if beam dilution were not a problem on smaller scales, it cannot compete… In the Galaxy: IRDCs and IR Bubbles are great (extended) targets
~700 AU Characteristics of HMPOs • Cores have mass> 100 M and luminosity > 104 L • Strong submm-λ dust and weak cm-λ free-free ionized continuum emission • High temperatures in dense dusty cores – ‘hot cores’ • - Copious emission from organic molecules • - Can only be observed at small spatial scales 30” is 30,000 AU (5x1017 cm) at 1kpc
Time Needed to Make a Big Map • Our IRDC GBT mapping was done in PointMap mode with frequency switching and 30sec integrations (on) for an rms noise of ~40 mJy (Not OTF because non-rectangular sources in scan direction) • In this mode about 4’x4’ could be mapped in ~7 hours with 2.5 beam sampling • Relaxing this to 2.2 beam sampling, and assuming less overhead for OTF: 5’x5’ could be mapped in 7 hours Great for mapping over larger scales than previously likely to be granted time So with the seven element FPA: 5’x5’ in 1 hour and 144 hours to do 1ox1o Essential for a transformational survey of inner Galactic plane to map the dense component of the “Galactic Molecular Web” With a 61 element FPA: ~17 hours to do 1ox1o
61 element array: Blind Galactic water maser survey Synergy with JCMT HARP-B and SCUBA2 Galactic legacy surveys