Download

1 / 52
520 likes | 580 Vues
Explore the concepts of capital, investment, wealth, and saving, and understand their roles in determining real interest rates and financial decisions. Learn how government influences these factors and their impact on global financial markets.

E N D
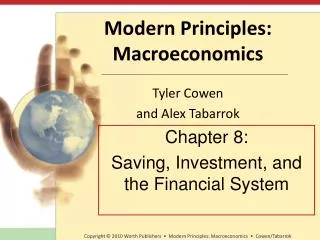
Chapter Nine • Capital, Investment, and Saving
CHAPTER CHECKLIST • Define and explain the relationships among capital, investment, wealth, and saving. • Explain how investment and saving decisions are made and how these decisions interact in financial markets to determine the real interest rate. • Explain how government influences the real interest rate, investment, and saving.
LECTURE TOPICS • Capital, Investment, Wealth, and Saving • Investment, Saving, and Interest • Government in the Financial Market
9.1 CAPITAL, INVESTMENT, WEALTH, SAVING • Physical capital • The tools, instruments, machines, buildings, and other constructions [“plant and equipment” plus housing stock and physical infrastructure] that have been produced in the past and that are used to produce goods and services. • Financial capital • The funds that firms use to buy and operate physical capital.
9.1 CAPITAL, INVESTMENT, WEALTH, SAVING • Capital and Investment • Gross investment • The total amount spent on new capital goods. A flow variable. • Net investment • The change in the quantity of capital — equals gross investment minus depreciation. • Both gross and net investment are flow variables [how much per year]; the total quantity of physical capital is a stock variable, what the total stock of capital is. Change in a stock is a flow.
9.1 CAPITAL, INVESTMENT, WEALTH, SAVING Figure 9.1 illustrates the relationship between capital and investment. On January 1, 2001,Tom’s DVD Burning, Inc. had DVD recording machines valued at $3,000.
9.1 CAPITAL, INVESTMENT, WEALTH, SAVING During 2001, the value of Tom machines falls by $2,000, depreciation. He spent $3,000 on new machines—gross investment. Tom’s net investment was $1,000, so at the end of 2001,Tom had capital valued at $4,000.
9.1 CAPITAL, INVESTMENT, WEALTH, SAVING • Wealth and Saving • Wealth • The value of all the things that a person owns. • Saving • The amount of income that is not paid in taxes or spent on consumption goods and services—adds to wealth. • Wealth is a stock variable, saving a flow variable.
9.1 CAPITAL, INVESTMENT, WEALTH, SAVING • Financial Markets • Financial markets • The financial relationships between households, firms, governments, banks, and other financial institutions that lend and borrow. • Global Financial Markets • Lenders seek the highest possible real interest rate, and borrowers seek the lowest possible real interest rate, [both adjusted for risk], in a single global financial market. With only a few ‘frictions,’ finance [money] can move rapidly world-wide.
9.1 CAPITAL, INVESTMENT, WEALTH, SAVING • We will discuss four groups of financial markets: • Stock markets • Bond markets • Short-term securities markets • Loans markets
9.1 CAPITAL, INVESTMENT, WEALTH, SAVING • Stock Markets • Stock • A certificate of [fractional] ownership of, and claim to the profits that a firm makes. • Stock market • A financial market in which shares of companies’ stocks are traded. Note we don’t mean the place, we mean the network of connections between [potential] buyers and sellers – many of whom now do all their dealing over the internet and by phone/telex, from widely scattered locations.
9.1 CAPITAL, INVESTMENT, WEALTH, SAVING • Bond Markets • Bond • A promise to pay specified sums of money on specified dates; it is debt for the issuer [who got a loan by issuing, selling, the promise originally]. • Bond market • A financial market in which bonds issued by firms and governments are traded.
9.1 CAPITAL, INVESTMENT, WEALTH, SAVING • Short-Term Securities Markets • Short-term securities are commercial bills and Treasury bills—promises by large firms and government to pay an agreed sum 90 days or less in the future. • Loans Markets • Banks and other financial institutions lower the cost of financing firms’ capital expenditures, and large purchases by consumers, by accepting short-term deposits and making longer-term loans.
9.2 INVESTMENT, SAVING, AND INTEREST • Investment Demand • Other things remaining the same, the higher the real interest rate, the smaller is the quantity of investment demanded; and lower the real interest rate, the greater is the quantity of investment demanded. • Quantity of investment demanded – how much new capital firms want to buy, given the real interest rate and everything else [e.g. price of capital goods] fixed.
9.2 INVESTMENT, SAVING, AND INTEREST • The real interest rate is the opportunity cost of the funds used to finance the purchase of capital, and firms compare the real rate of interest with the rate of profit they expect to earn on their new capital. • Firms invest only when they expect to earn a rate of profit that exceeds the real interest rate. • The higher the real interest rate, the fewer projects that are expected to be profitable, so the smaller is the amount of investment demanded.
9.2 INVESTMENT, SAVING, AND INTEREST • Investment Demand Curve • Investment demand • The relationship between the quantity of investment demanded and the real interest rate, other things [such as expectations, prices of capital goods] remaining the same. • Investment demand is shown by an investment demand schedule or an investment demand curve.
9.2 INVESTMENT, SAVING, AND INTEREST Figure 9.2 shows investment demand. The table and figure show the quantity of investment demanded at five real interest rates. Points A through E on the investment demand curve correspond to the rows in the table.
9.2 INVESTMENT, SAVING, AND INTEREST • Changes in Investment Demand • When the expected rate of profit changes, investment demand changes. • Other things remaining the same, the greater the expected profit from new capital, the greater is the amount of investment. • Shifts of the Investment Demand Curve • When investment demand changes, the investment demand curve shifts.
9.2 INVESTMENT, SAVING, AND INTEREST • The many influences on expected profit can be placed in three groups: • Objective influences such as the phase of the business cycle, technological change, and population growth • Subjective influences summarized in the phrase “animal spirits” • Contagion effects summarized in the phrase “irrational exuberance”
9.2 INVESTMENT, SAVING, AND INTEREST Figure 9.3 shows changes in investment demand. An increase in the expected profit increases investment demand and shifts the investment demand curve rightward to ID1. A decrease in the expected profit decreases investment demand and shifts the investment demand curve leftward to ID2.
Saving Decisions National Saving • The sum of private saving and government saving. • Government saving is government revenue minus government expenditure, the ‘budget surplus.’ • Private Saving is the sum of household saving and business saving. • Business saving is net profits retained in the business, i.e. not distributed to owners. • Household saving is disposable income minus consumption expenditure. As measured, it ignores ‘capital gains’ of households.
Saving Decisions Some factors affecting household saving are: • The real interest rate • Disposable income • Purchasing power of net assets [i.e. real wealth] • Expected future income
Saving Decisions The Real Interest Rate • Changes in the interest rate have two effects on saving, in opposite directions. • The interest rate is the opportunity cost of not saving, i.e. consuming now; so a higher interest rate makes consuming now more expensive, consumption decreases, you save more. • But higher interest rates mean higher future income from net financial assets, i.e. households expect higher future income, so will consume more now, save less.
Saving Decisions • Real interest rate [continued] • These two effects go in opposite directions; which dominates is an empirical question. Despite your textbook, the answer is not clear -- higher real interest rates may or may not increase saving in the aggregate. • Empirical evidence is very clear on one point -- higher real interest rates on particular financial assets do increase the flow of saving into those assets, as one would expect. • Empirically, in the US higher real interest rates probably increase household saving, ceteris paribus, but only a little.
Saving Decisions Disposable Income • The greater a household's disposable income the greater is its saving [and its consumption]. Purchasing Power of Net Assets • Net assets are assets minus debts, i.e. real wealth. • The greater the purchasing power of a household’s net assets the less is its saving, ceteris paribus; the increase in wealth from stock market and house-value gains probably largely explains current low HH savings rates in the US.
Saving Decisions Expected Future Income • Ceteris paribus, the lower a household’s expected future income, the greater its saving now. • *************************************** Saving Supply • Illustrates the relationship between saving and the real interest rate
9.2 INVESTMENT, SAVING, AND INTEREST • Saving Supply • The higher the real interest rate, the greater is the quantity of saving supplied, other things remaining the same. • The lower the real interest rate, the smaller is the quantity of saving supplied, other things remaining the same. • This is what we will assume, despite the ambiguities, because it does seem consistent with US experience. Note that because of international flows of finance, this is clearly correct for the ‘supply of finance for investment’ – if US real interest rates are higher than European rates, finance will flow into the US to be lent.
9.2 INVESTMENT, SAVING, AND INTEREST • Saving Supply Curve • Saving supply • The relationship between the quantity of saving supplied and the real interest rate, other things remaining the same. How much lenders want to lend, at each possible real interest rate, given everything else unchanged. • Saving supply is illustrated by a saving supply schedule or a saving supply curve.
9.2 INVESTMENT, SAVING, AND INTEREST Figure 9.4 shows saving supply. The table and figure show the quantity of saving supplied at five real interest rates. Points A through E on the saving supply curve correspond to the rows in the table.
9.2 INVESTMENT, SAVING, AND INTEREST • Changes in Saving Supply • The three main factors that influence saving supply are: • Disposable income • Buying power of net assets • Expected future disposable income
9.2 INVESTMENT, SAVING, AND INTEREST • Disposable income • Income earned minus net taxes. • The greater a household’s disposable income, other things remaining the same, the greater is its saving. • The greater the buying power of the net assets a household has accumulated, other things remaining the same, the less it will save. • The higher a household’s expected future disposable income, other things remaining the same, the smaller is its saving.
9.2 INVESTMENT, SAVING, AND INTEREST • Shifts of the Saving Supply Curve • Along the saving supply curve, all the influences on saving other than the real interest rate remain the same. • A change in any of these influences on saving changes saving supply and shifts the saving supply curve.
9.2 INVESTMENT, SAVING, AND INTEREST Figure 9.5 shows a change in saving supply. The saving supply curve shifts rightward from SS0 to SS1 if: • Disposable income increases • The buying power of net assets decreases • Expected future disposable income decreases
9.2 INVESTMENT, SAVING, AND INTEREST The saving supply curve shifts leftward from SS0 to SS2 if: • Disposable income decreases • The buying power of net assets increases • Expected future disposable income increases
9.2 INVESTMENT, SAVING, AND INTEREST • Financial Market Equilibrium • Figure 9.6 shows how the real interest rate is determined. • ID is the investment demand curve • SS is the saving supply curve
9.2 INVESTMENT, SAVING, AND INTEREST 1. If the real interest rate is 8 percent a year, the quantity of investment demanded is less than the quantity of saving supplied. 2. If the real interest rate is 4 percent a year, the quantity of investment demanded exceeds the quantity of saving supplied.
9.2 INVESTMENT, SAVING, AND INTEREST 3. When the real interest rate is 6 percent a year, the quantity of investment demanded equals the quantity of saving supplied. There is neither a shortage nor a surplus of saving, and the real interest rate is at its equilibrium level.
9.3 GOVERNMENT IN THE FINANCIAL MARKET • Government Budget and Government Saving • GDP is the sum of consumption expenditure, C; investment, I; government purchases, G; and net exports, (X – M). • In the global economy, net exports are zero, so for the world as a whole: • Y = C + I + G
9.3 GOVERNMENT IN THE FINANCIAL MARKET • GDP equals total income, which is the sum of consumption expenditure, saving, S, and net taxes, NT. So: • Y = C + S + NT • By combining these two ways of looking at GDP, you can see that: C + I + G = C + S + NT
9.3 GOVERNMENT IN THE FINANCIAL MARKET • Because consumption is on both sides of this equation, we can subtract C and simplify the equation to: • I + G = S + NT • Now subtract government purchases from both sides of this equation to obtain: • I = S + (NT – G) • This equation tells us that investment is financed by private saving and government saving, NT – G. • Government saving, NT – G, is also the government budget surplus.
9.3 GOVERNMENT IN THE FINANCIAL MARKET • Total saving equals private saving plus government saving. • So when the government has a budget surplus, it contributes toward financing investment. • But when the government has a budget deficit, it competes with businesses for private saving and decreases the amount available for investment.
9.3 GOVERNMENT IN THE FINANCIAL MARKET • Effect of Government Saving • A government budget surplus increases total saving supply. • To find total saving supply, we must add the government budget surplus to private saving supply. • An increase in saving supply brings a lower interest rate, which decreases the quantity of private saving supplied and increases the quantity of investment.
9.3 GOVERNMENT IN THE FINANCIAL MARKET Figure 9.7 shows the effects of government saving. With balanced government budgets, the real interest rate is 6 percent a year and investment equals saving at $10 trillion a year. 1. A government budget surplus of $2 trillion is added to private saving to determine the saving supply curve SS.
9.3 GOVERNMENT IN THE FINANCIAL MARKET 2. The real interest rate falls to 4 percent a year. 3. Private saving decreases to $9 trillion. 4. Total saving and investment increase to $11 trillion.
9.3 GOVERNMENT IN THE FINANCIAL MARKET • Government Deficit and Crowding Out • A government budget deficit works in the opposite way to the surplus. It decreases total saving. • To find total saving, subtract the government budget deficit from private saving. • A decrease in total saving brings a higher interest rate, which increases the quantity of private saving supplied but decreases investment in a crowding-out effect.
9.3 GOVERNMENT IN THE FINANCIAL MARKET • Crowding-out effect • The tendency for a government budget deficit to decrease investment.
9.3 GOVERNMENT IN THE FINANCIAL MARKET Figure 9.8 shows a crowding-out effect. With balanced government budgets, the real interest rate is 6 percent a year and investment equals saving at $10 trillion a year. 1.A government budget deficit is negative government saving (dissaving). Subtract the government deficit from private saving to determine the saving supply curve SS.
9.3 GOVERNMENT IN THE FINANCIAL MARKET 2.The real interest rate rises to 8 percent a year, 3. Private saving increases to $11 trillion, and 4.Total saving and investment decrease to $9 trillion. Investment is crowded out.
Reality check: • In the real world, we do not observe such strong connections between budget deficits or surpluses and real interest rates. • One reason why is the existence of the global financial market, and the ease with which finance can move between countries. • Relatively small movements of real interest rates in one country, with no change in other expectations, can induce large movements of finance in or out of that country.
Equilibrium in the World Economy Real interest rates are not the same in every country for many reasons. For example: -- owners of assets perceive investments in some countries as riskier than in others. -- the expected profit rate in some countries is much larger than in others, often compensating for the risk differences. -- perceptions of likely future inflation and growth prospects in each country vary.