Download
1 / 38
380 likes | 494 Vues
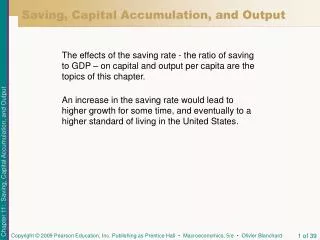
Saving, Capital Accumulation, and Output. The effects of the saving rate - the ratio of saving to GDP – on capital and output per capita are the topics of this chapter.

E N D
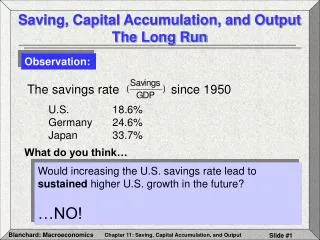
Saving, Capital Accumulation, and Output • The effects of the saving rate - the ratio of saving to GDP – on capital and output per capita are the topics of this chapter. • An increase in the saving rate would lead to higher growth for some time, and eventually to a higher standard of living in the United States.
11-1 Interactions between Output and Capital • At the center of the determination of output in the long run are two relations between output and capital: • The amount of capital determines the amount of output being produced. • The amount of output determines the amount of saving and, in turn, the amount of capital accumulated over time.
11-1 Interactions between Output and Capital Figure 11 - 1 Capital, Output, and Saving/Investment
11-1 Interactions between Output and Capital The Effects of Capital on Output • Under constant returns to scale, we can write the relation between output and capital per worker as follows:
11-1 Interactions between Output and Capital The Effects of Capital on Output • Since the focus here is on the role of capital accumulation, we make the following assumptions: • The size of the population, the participation rate, and the unemployment rate are all constant. • There is no technological progress.
11-1 Interactions between Output and Capital The Effects of Capital on Output • With these two assumptions, our first relation between output and capital per worker, from the production side, can be written as In words, higher capital per worker leads to higher output per worker.
11-1 Interactions between Output and Capital The Effects of Output on Capital Accumulation • To derive the second relation, between output and capital accumulation, we proceed in two steps: • We derive the relation between output and investment. • We derive the relation between investment and capital accumulation.
11-1 Interactions between Output and Capital The Effects of Output on Capital Accumulation • We make three assumptions to derive the relation between output and investment: • We assume the economy is closed. • We assume public saving, T – G, is equal to zero. • We assume that private saving is proportional to income, so • Combining these two relations gives: Output and Investment
11-1 Interactions between Output and Capital Combining the relation from output to investment, , and the relation from investment to capital accumulation, we obtain the second important relation we want to express, from output to capital accumulation: The Effects of Output on Capital Accumulation • The evolution of the capital stock is given by: Investment and Capital Accumulation denotes the rate of depreciation
11-1 Interactions between Output and Capital The Effects of Output on Capital Accumulation • Rearranging terms in the equation above, we can articulate the change in capital per worker over time: Investment and Capital Accumulation Output and Capital per Worker: In words, the change in the capital stock per worker (left side) is equal to saving per worker minus depreciation (right side).
11-2 The Implications of AlternativeSaving Rates • First relation:Capital determines output. • Second relation:Output determines capital accumulation • Our two main relations are: Combining the two relations, we can study the behavior of output and capital over time.
11-2 The Implications of AlternativeSaving Rates _ = _ Change in capitalfrom year t to year t + 1 Investmentduring year t Depreciationduring year t = Dynamics of Capital and Output From our main relations above, we express output per worker (Yt/N) in terms of capital per worker to derive the equation below:
11-2 The Implications of AlternativeSaving Rates _ = Change in capitalfrom year t to year t + 1 _ Investmentduring year t Depreciationduring year t = Dynamics of Capital and Output • This relation describes what happens to capital per worker. The change in capital per worker from this year to next year depends on the difference between two terms: • If investment per worker exceeds depreciation per worker, the change in capital per worker is positive: Capital per worker increases. • If investment per worker is less than depreciation per worker, the change in capital per worker is negative: Capital per worker decreases.
11-2 The Implications of AlternativeSaving Rates Dynamics of Capital and Output At K0/N, capital per worker is low, investment exceeds depreciation, thus, capital per worker and output per worker tend to increase over time.
11-2 The Implications of AlternativeSaving Rates Dynamics of Capital and Output At K*/N, output per worker and capital per worker remain constant at their long-run equilibrium levels. • Investment per worker increases with capital per worker, but by less and less as capital per worker increases. • Depreciation per worker increases in proportion to capital per worker.
11-2 The Implications of AlternativeSaving Rates Figure 11 - 2 Capital and Output Dynamics Dynamics of Capital and Output When capital and output are low, investment exceeds depreciation, and capital increases. When capital and output are high, investment is less than depreciation, and capital decreases.
11-2 The Implications of AlternativeSaving Rates Steady-State Capital and Output • The state in which output per worker and capital per worker are no longer changing is called the steady state of the economy. In steady state, the left side of the equation above equals zero, then: Given the steady state of capital per worker (K*/N), the steady-state value of output per worker (Y*/N), is given by the production function:
Capital Accumulation and Growth in France in the Aftermath of World War II When WWII ended in 1945, France had suffered some of the heaviest losses of all European countries. A vivid picture of the destruction of capital is provided by the numbers in Table 1.
11-2 The Implications of AlternativeSaving Rates The Saving Rate and Output • Three observations about the effects of the saving rate on the growth rate of output per worker are: • The saving rate has no effect on the long run growth rate of output per worker, which is equal to zero. • Nonetheless, the saving rate determines the level of output per worker in the long run. Other things equal, countries with a higher saving rate will achieve higher output per worker in the long run. • An increase in the saving rate will lead to higher growth of output per worker for some time, but not forever.
11-2 The Implications of AlternativeSaving Rates Figure 11 - 3 The Effects of Different Saving Rates The Saving Rate and Output A country with a higher saving rate achieves a higher steady- state level of output per worker.
11-2 The Implications of AlternativeSaving Rates Figure 11 - 4 The Effects of an Increase in the Saving Rate on Output per Worker The Saving Rate and Output An increase in the saving rate leads to a period of higher growth until output reaches its new, higher steady-state level.
11-2 The Implications of AlternativeSaving Rates Figure 11 - 5 The Effects of an Increase in the Saving Rate on Output per Worker in an Economy with Technological Progress The Saving Rate and Output An increase in the saving rate leads to a period of higher growth until output reaches a new, higher path.
11-2 The Implications of AlternativeSaving Rates The Saving Rate and Consumption • An increase in the saving rate always leads to an increase in the level of output per worker. But output is not the same as consumption. To see why, consider what happens for two extreme values of the saving rate: • An economy in which the saving rate is (and has always been) 0 is an economy in which capital is equal to zero. In this case, output is also equal to zero, and so is consumption. A saving rate equal to zero implies zero consumption in the long run. • Now consider an economy in which the saving rate is equal to one: People save all their income. The level of capital, and thus output, in this economy will be very high. But because people save all their income, consumption is equal to zero. A saving rate equal to one also implies zero consumption in the long run.
11-2 The Implications of AlternativeSaving Rates The Saving Rate and Consumption • The level of capital associated with the value of the saving rate that yields the highest level of consumption in steady state is known as the golden-rule level of capital.
11-2 The Implications of AlternativeSaving Rates Figure 11 - 6 The Effects of the Saving Rate on Steady- State Consumption per Worker The Saving Rate and Consumption An increase in the saving rate leads to an increase and then to a decrease in steady-state consumption per worker.
Social Security, Saving, and Capital Accumulation in the United States • One way to run a social security system is the fully-funded system, where workers are taxed, their contributions invested in financial assets, and when workers retire, they receive the principal plus the interest payments on their investments. • Another way to run a social security system is the pay-as-you-go system, where the taxes that workers pay are the benefits that current retirees receive. • In anticipation of demographic changes, the Social Security tax rate has seen increases, and contributions are now larger than benefits, leading to the accumulation of a Social Security trust fund.
11-3 Getting a Sense of Magnitudes • Assume the production function is: Output per worker is: Output per worker, as it relates to capital per worker is: Given our second relation, Then,
11-3 Getting a Sense of Magnitudes The Effects of the Saving Rate on Steady-State Output • Steady-state output per worker is equal to the ratio of the saving rate to the depreciation rate. • A higher saving rate and a lower depreciation rate both lead to higher steady-state capital per worker and higher steady-state output per worker.
11-3 Getting a Sense of Magnitudes Figure 11 - 7 The Dynamic Effects of an Increase in the Saving Rate from 10% to 20% on the Level and the Growth Rate of Output per Worker The Dynamic Effects of an Increase in the Saving Rate It takes a long time for output to adjust to its new, higher level after an increase in the saving rate. Put another way, an increase in the saving rate leads to a long period of higher growth.
11-3 Getting a Sense of Magnitudes The U.S. Saving Rate and the Golden Rule • In steady state, consumption per worker is equal to output per worker minus depreciation per worker. Knowing that: and then: These equations are used to derive Table 11-1 in the next slide.
11-3 Getting a Sense of Magnitudes The U.S. Saving Rate and the Golden Rule
11-4 Physical versus Human Capital • The set of skills of the workers in the economy is called human capital. • An economy with many highly skilled workers is likely to be much more productive than an economy in which most workers cannot read or write. • The conclusions drawn about physical capital accumulation remain valid after the introduction of human capital in the analysis.
11-4 Physical versus Human Capital Extending the Production Function • When the level of output per workers depends on both the level of physical capital per worker, K/N, and the level of human capital per worker, H/N, the production function may be written as: An increase in capital per worker or the average skill of workers leads to an increase in output per worker.
11-4 Physical versus Human Capital Extending the Production Function • A measure of human capital may be constructed as follows: • Suppose an economy has 100 workers, half of them unskilled and half of them skilled. The relative wage of skilled workers is twice that of unskilled workers. • Then:
11-4 Physical versus Human Capital Human Capital, Physical Capital, and Output • An increase in how much society “saves” in the form of human capital—through education and on-the-job-training—increases steady-state human capital per worker, which leads to an increase in output per worker. • In the long run, output per worker depends not only on how much society saves but also how much it spends on education.
11-4 Physical versus Human Capital Human Capital, Physical Capital, and Output • In the United States, spending on education comprises about 6.5% of GDP, compared to 16% investment in physical capital. This comparison: • Accounts for the fact that education is partly consumption. • Does not account for the opportunity cost of education. • Does not account for the opportunity cost of on-the-job-training. • Considers gross, not net investment. Depreciation of human capital is slower than that of physical capital.
11-4 Physical versus Human Capital Endogenous Growth • A recent study has concluded that output per worker depends roughly equally on the amount of physical capital and the amount of human capital in the economy. • Models that generate steady growth even without technological progress are called models of endogenous growth, where growth depends on variables such as the saving rate and the rate of spending on education. • Output per worker depends on the level of both physical capital per worker and human capital per worker. • Is technological progress unrelated to the level of human capital in the economy? Can’t a better-educated labor force lead to a higher rate of technological progress? These questions take us to the topic of the next chapter: the sources and the effects of technological progress.
Key Terms • saving rate • steady state • golden-rule level of capital • fully funded system • pay-as-you-go system • trust fund • human capital • models of endogenous growth